


MODIS Airborne Simulator (MAS)
CAMPAIGN SUMMARY INFORMATION
|
Winter Cloud Experiment Dates: 23 January - 13 February 1997 Location: Upper Midwest, Great Lakes, New England, & Canada Principal Investigators: Dr. Paul Menzel (UWisc) Additional Sensors: Camera (RC-10), CPL, NAST-I, & S-HIS Objective: This campaign was designed to improve remote detection of clouds over snow and ice fields, in addition to snow and ice fields through clear skies. |
||||||||||||||||||||||||||||
|
Processing Information Flights Processed: 10 of 10 Total Flight Tracks: Total Scanlines: Level-1B Version: #2 Calibration Type: Final Calibration Version: WINCE ARC 1.0 Temperature Adjustment: None Status: Level-1B Data in HDF format is available Noted Irregularities |
||||||||||||||||||||||||||||
|
Spectral Information Spectral Band Configuration Spectral Response Function Table |
||||||||||||||||||||||||||||
|
Level-1B Data Distribution Level 1 / Atmosphere Archive and Distribution System (LAADS) NASA Distributive Active Archive Centers (DAACs) |
||||||||||||||||||||||||||||
|
||||||||||||||||||||||||||||
|
Related Web Sites Official WINCE Home Page CPL Home Page NAST-I Home Page S-HIS Home Page NASA Airborne Science Program |
||||||||||||||||||||||||||||
Noted Irregularities
|
||||||||||||||||||||||||||||
 Flight: 97-041
 Flight: 97-042
 Flight: 97-043
 Flight: 97-044
 Flight: 97-045
 Flight: 97-046
 Flight: 97-047
 Flight: 97-048
 Flight: 97-049
 Flight: 97-050
WINCE


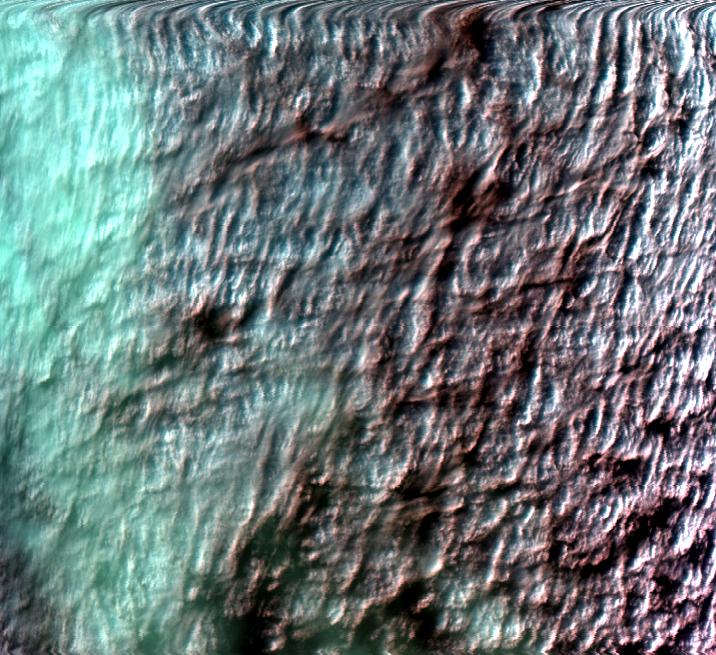
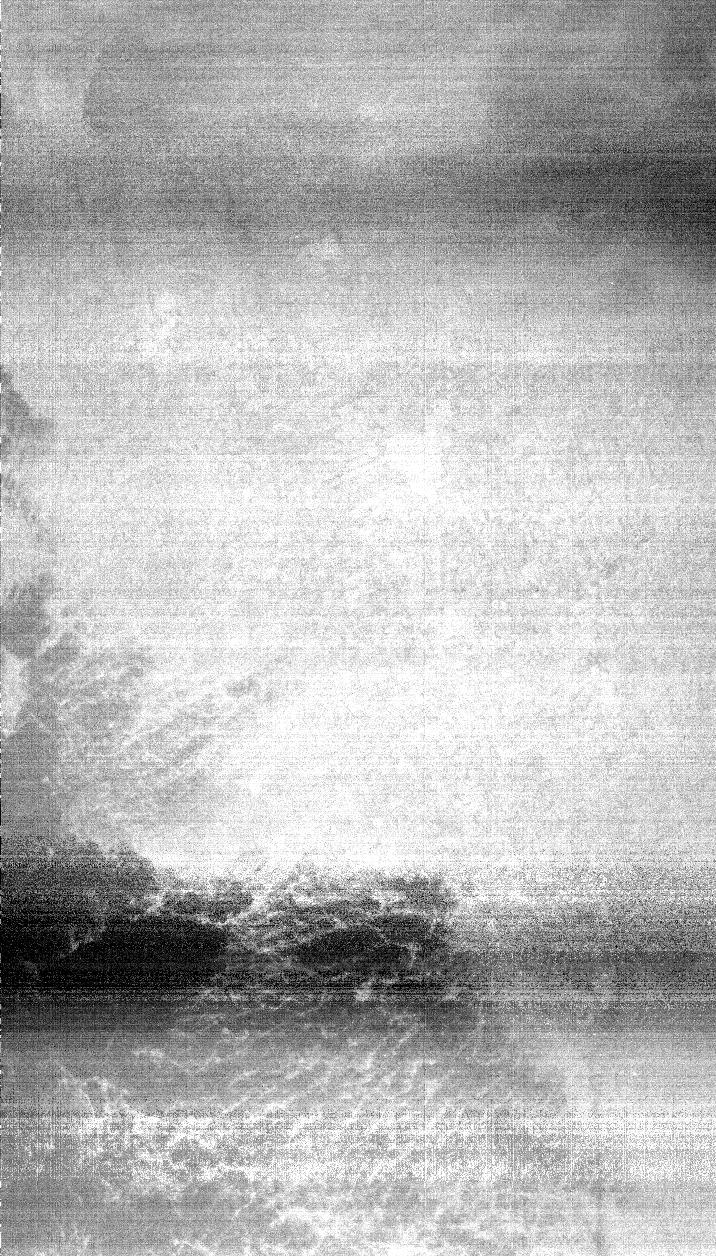
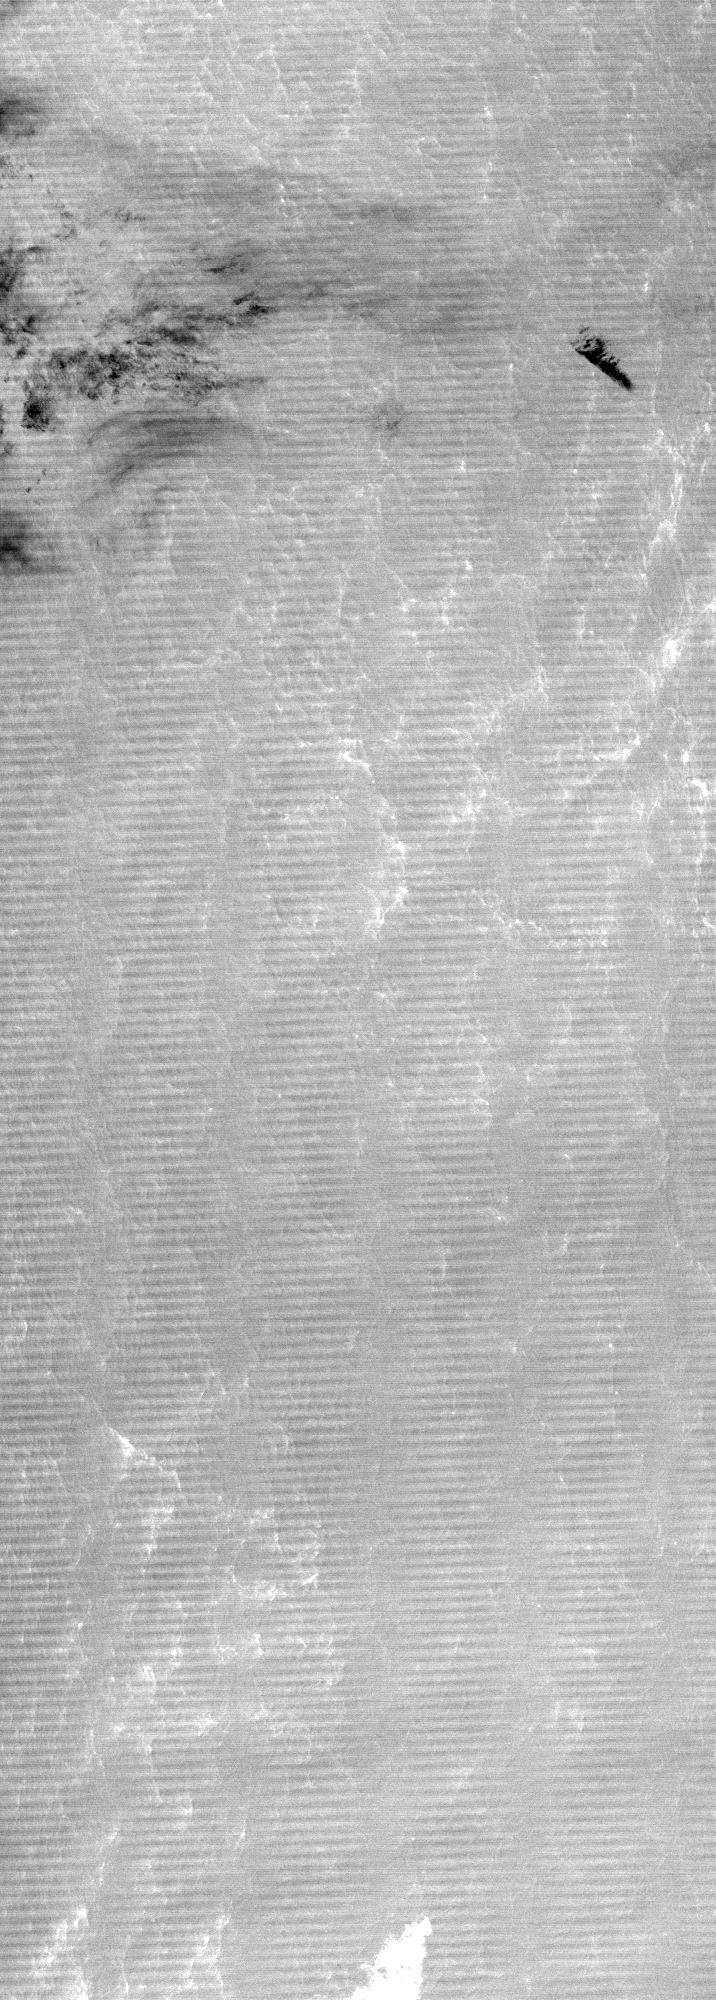
| Sample Imagery |
| Click image for full resolution |
|
Flight: 97-047, Track #03 Lake Erie, New York |


|
|
R: 2.15µm G: 0.95µm B: 0.65µm |
- NASA Official: Matt Fladeland
- Project Manager: James Jacobson
- Website Editor: Eric Fraim
- Last Updated: March 21, 2024


