
|
Sample Image

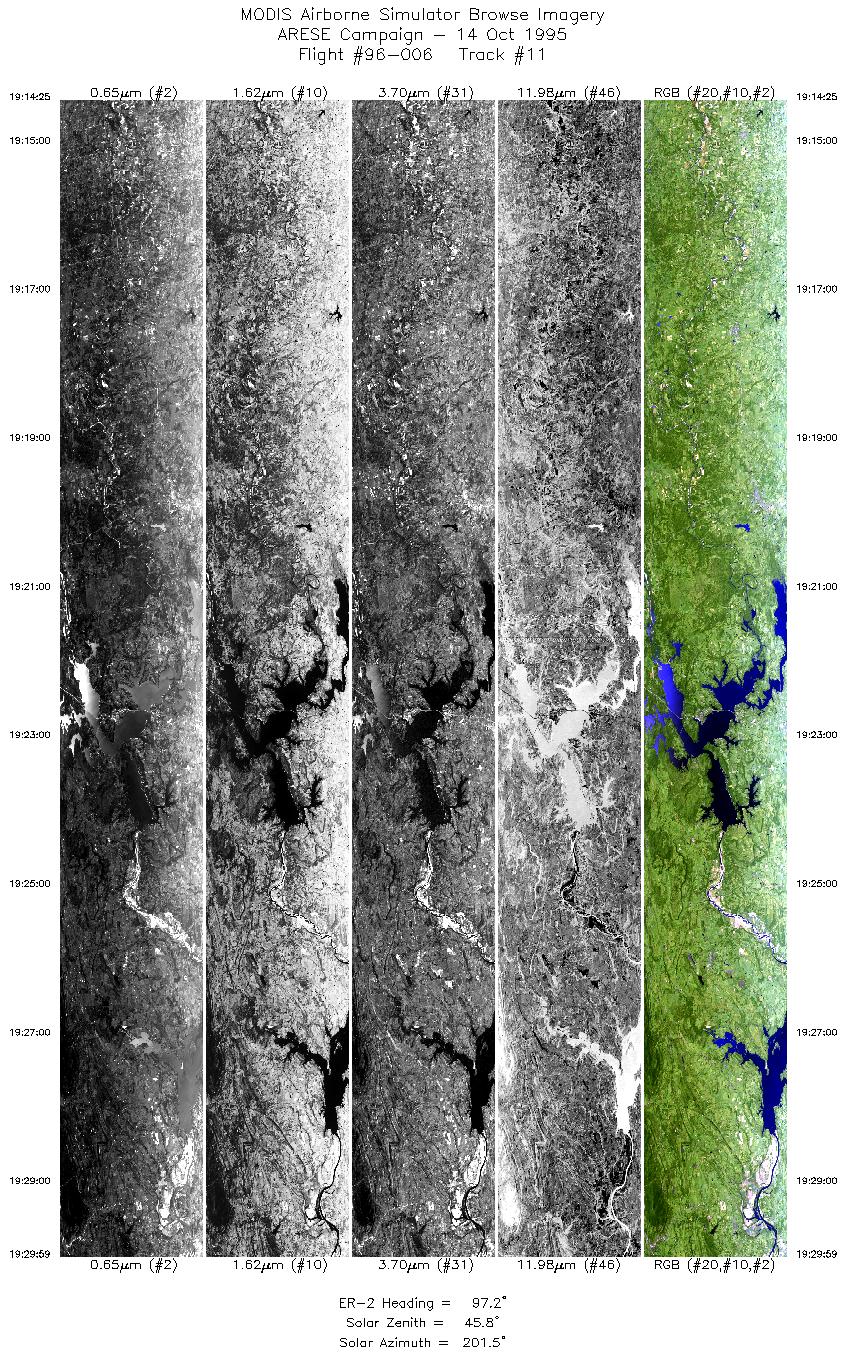
14 Oct 1995
Track #11
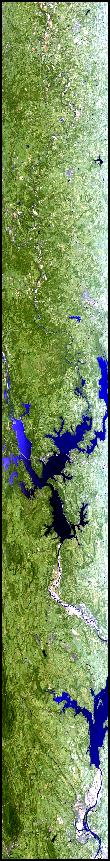

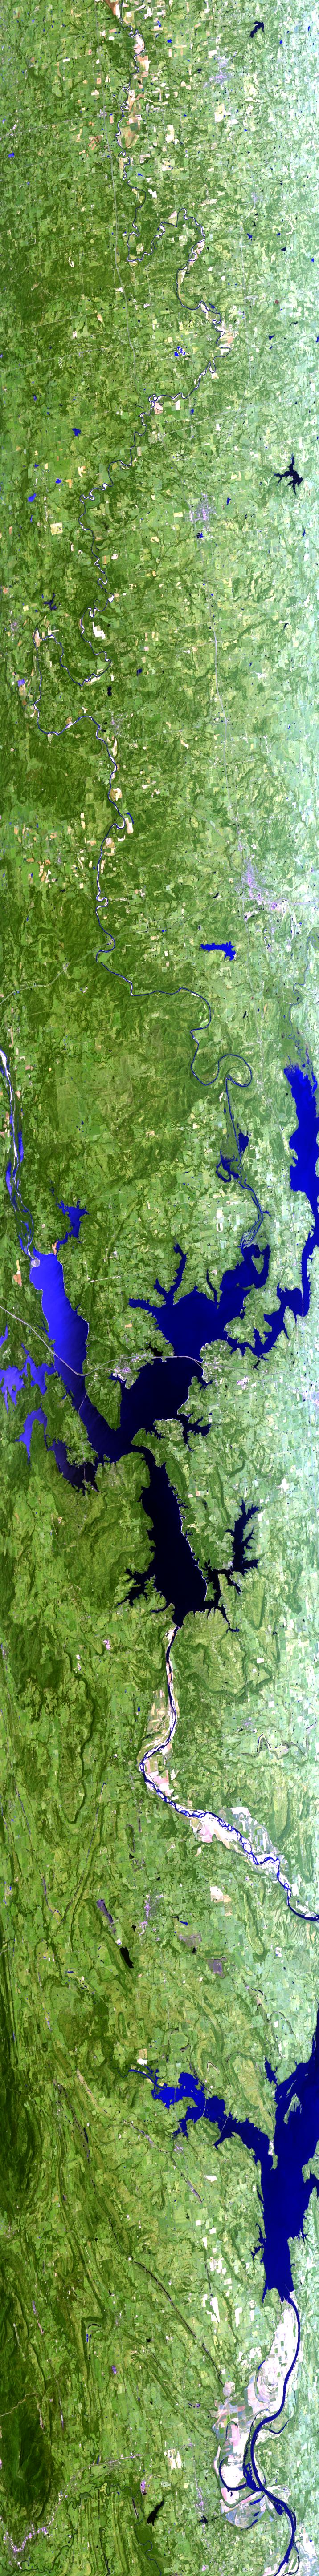
The image to left begins east of Shawnee, Oklahoma and proceeds east following the North Canadian River into Eufaula Lake. Continues following the Canadian River into Robert S. Kerr Lake; and finally the Arkansas River as it drains from Kerr Lake. (North is to the right in this image.)
R: 2.14 microns
G: 1.62 microns
B: 0.55 microns
|
|
Mission Summary
Date: October 14, 1995
ER-2 Flight Number: 96-006
Flight Location: New Mexico, Arkansas, Texas
Principal Investigator: Dr. Francisco Valero (Scripps)
Additional Sensors: RAMS, CLS, VIS
Objective: Investigate the absorption of solar radiation by clouds, aerosols, and atmospheric gases.
Level-1B Processing Information
Level-1B Data processed by: Ames Research Center
Level-1B Data Version: #09
Level-1B Configuration: (sample file)
Calibration Type: Final
Calibration Version: ARESE 1.0
Temperature Adjustment: 35C
Status: Completed with final calibration
|
|
Flight Track Map

|
Level-1B Browse Imagery
Straight Line Flight Tracks: 26
Scanlines Processed: 95792
Solar Azimuth and Zenith Angles
|
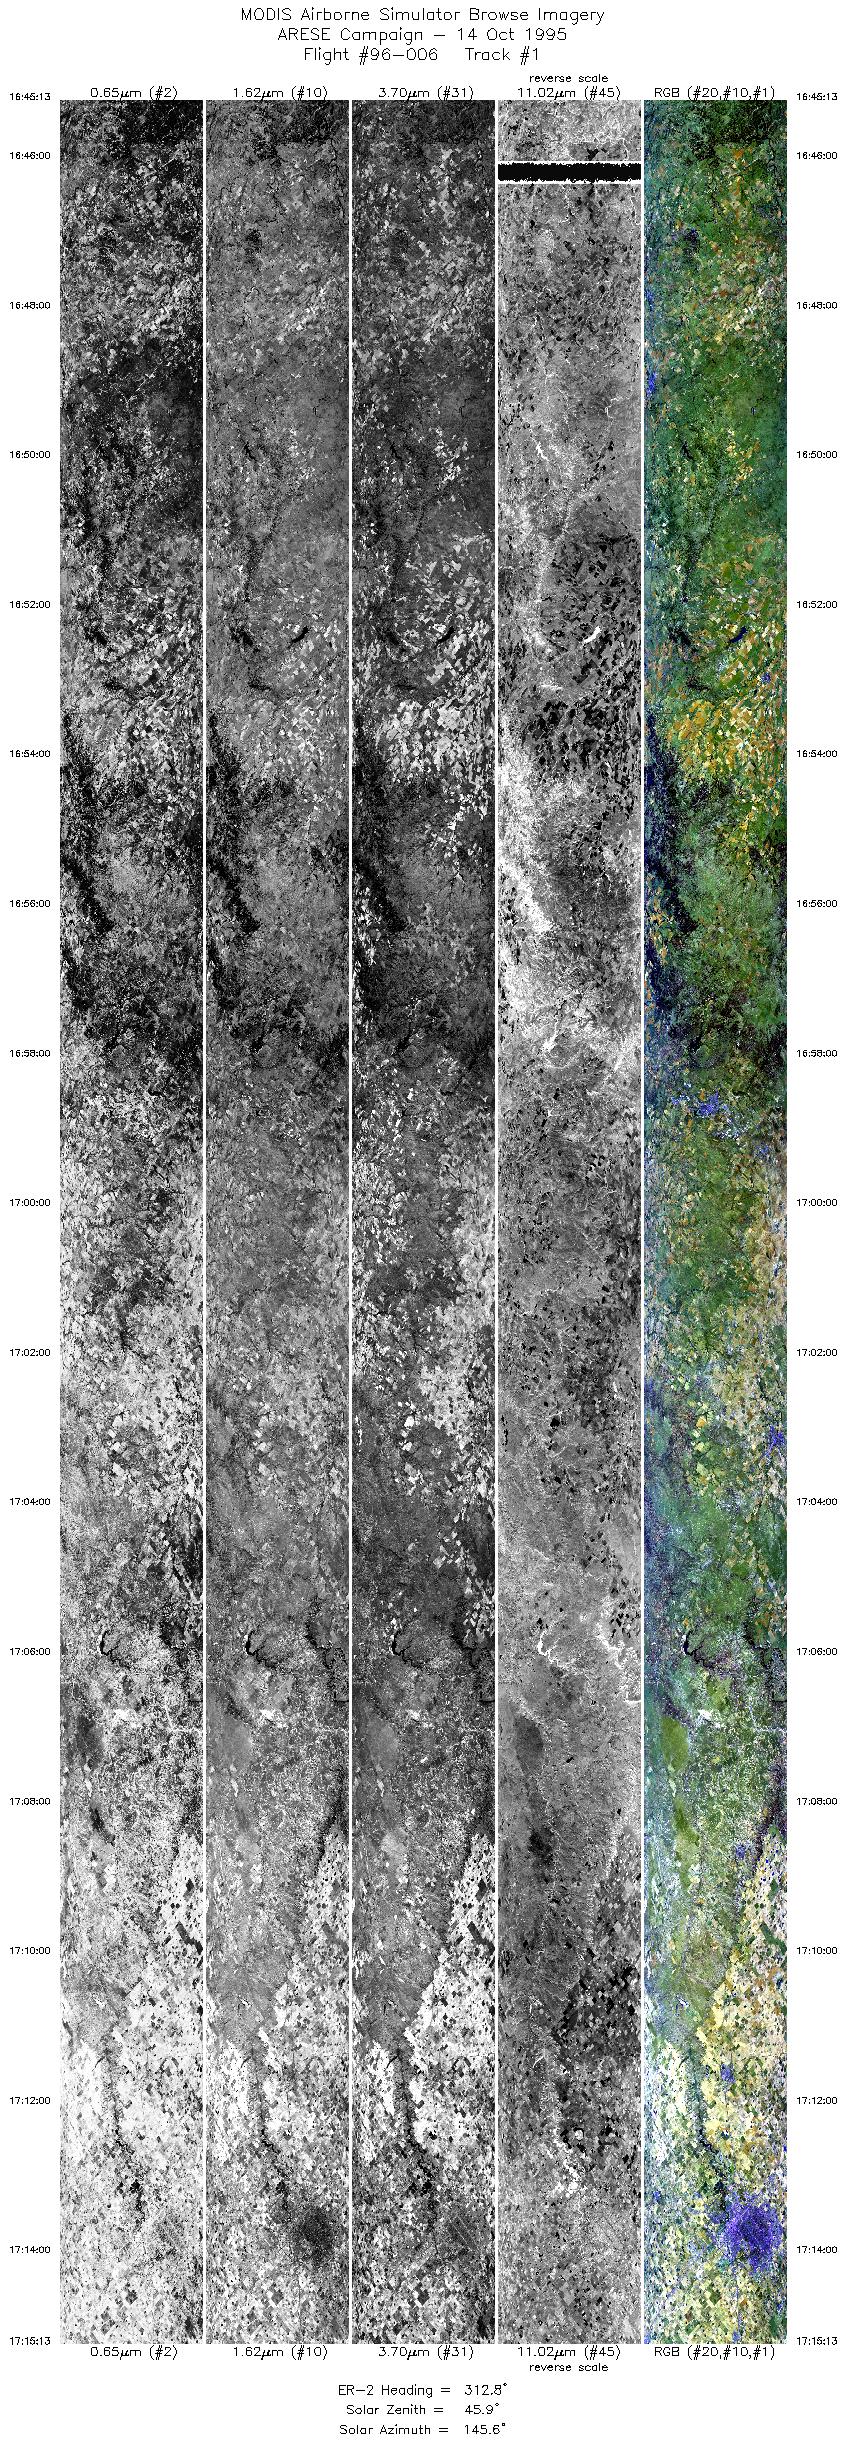
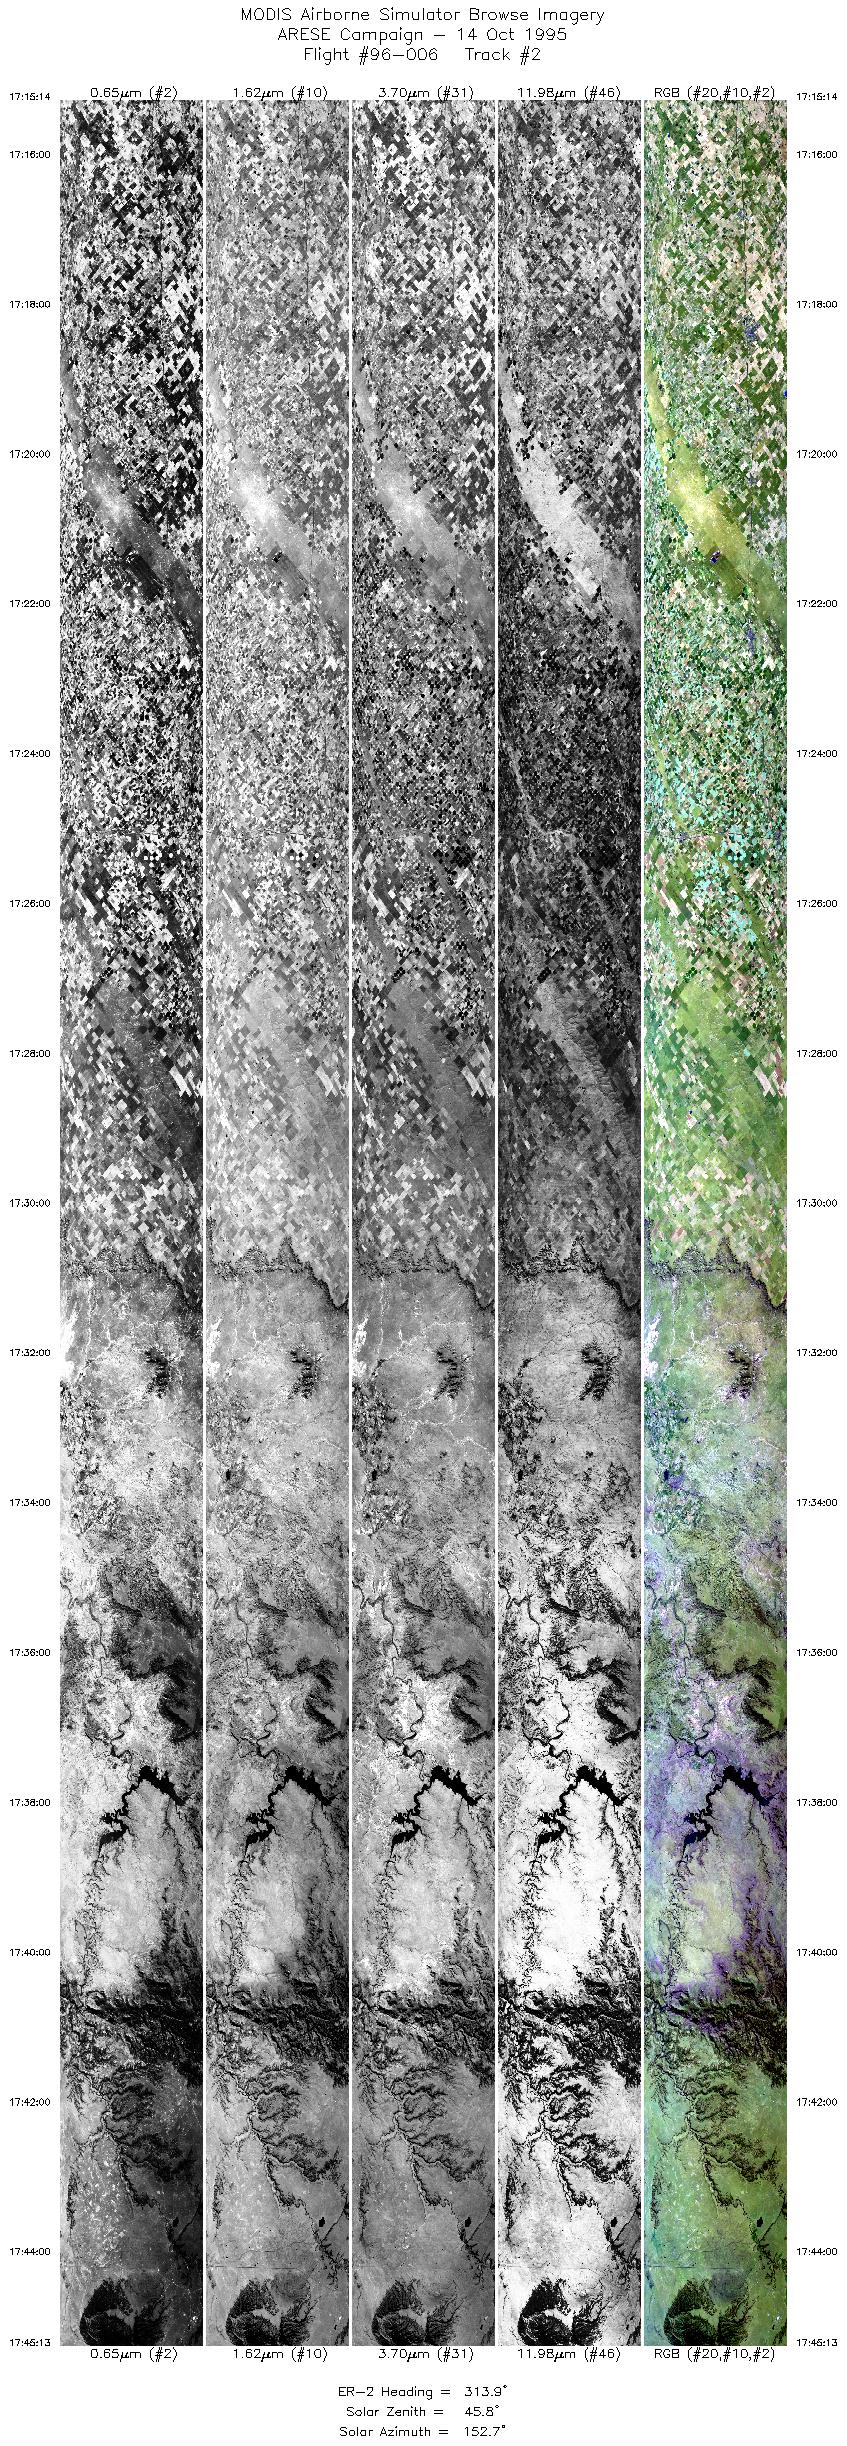
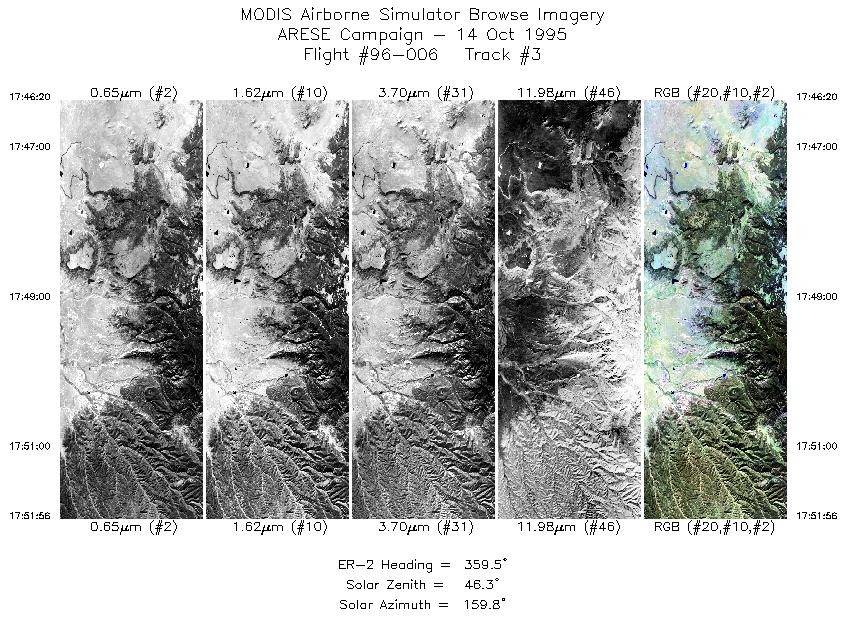
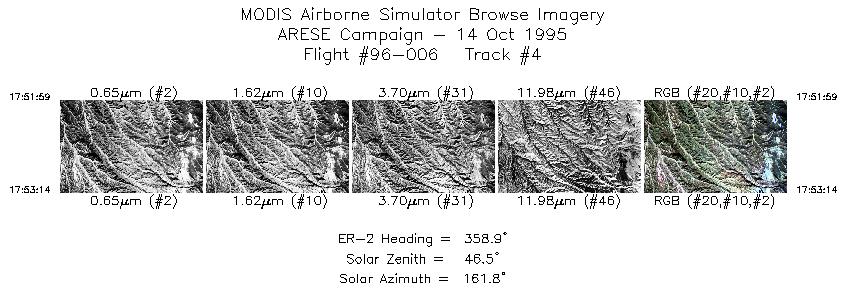
Browse Images
|
Click on the Flight Track number to load images.
Lat/Lon ranges are for the BEG-END scanline nadir pixels.
|
Flight
Track |
Time_Span
(GMT) |
Heading
(Deg) |
Lat_Range
(Deg_N) |
Lon_Range
(Deg_W) |
Length
(Scanlines) |
Altitude
(Meters) |
| 1 |
16:45-17:15 |
313 |
31.43-33.72 |
99.18-101.96 |
11222 |
~20000 |
| 2 |
17:15-17:45 |
314 |
33.73-35.97 |
101.97-104.94 |
11232 |
~20000 |
| 3 |
17:46-17:51 |
359 |
36.08-36.69 |
105.00-105.00 |
2099 |
~20000 |
| 4 |
17:51-17:53 |
359 |
36.70-36.83 |
105.00-105.00 |
469 |
~20000 |
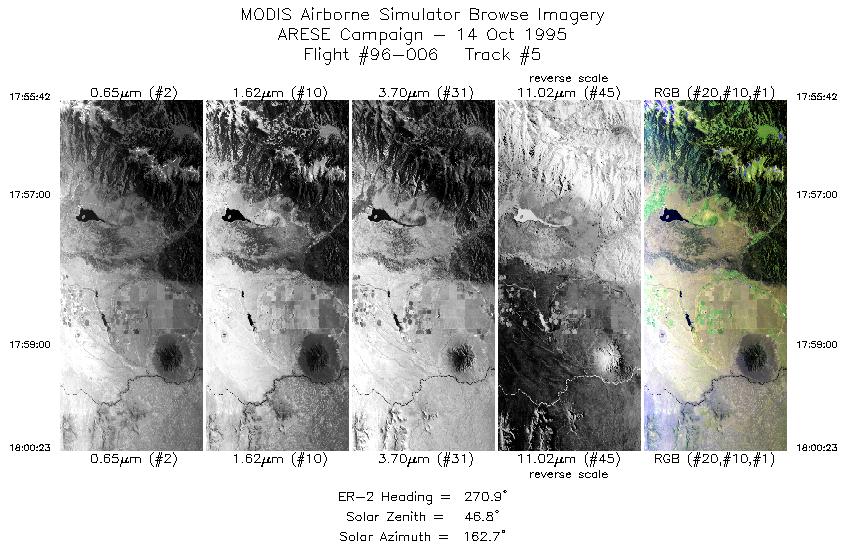
| 5 |
17:55-18:00 |
271 |
37.00-37.00 |
105.19-105.85 |
1756 |
~20000 |
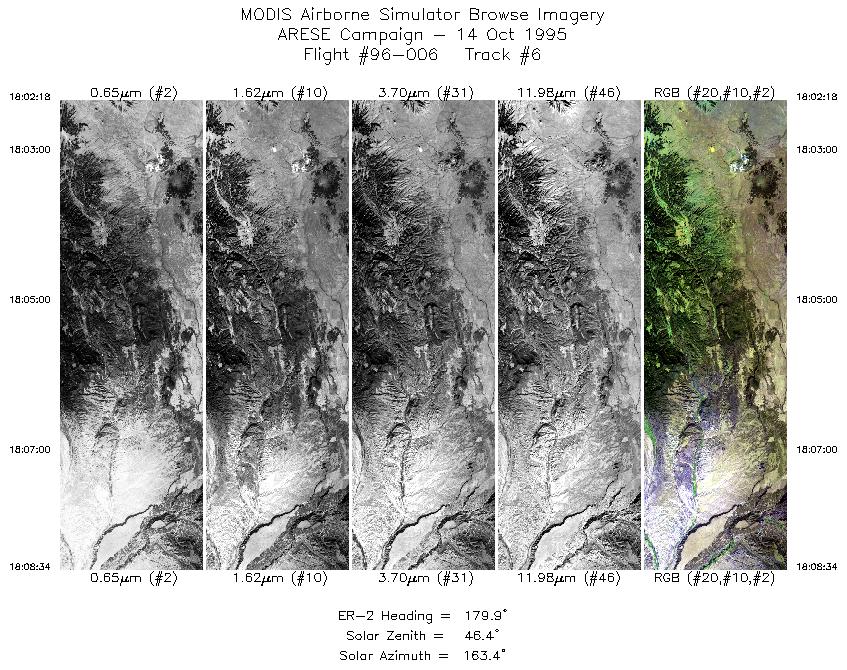
| 6 |
18:02-18:08 |
180 |
36.85-36.13 |
106.00-106.00 |
2350 |
~20000 |
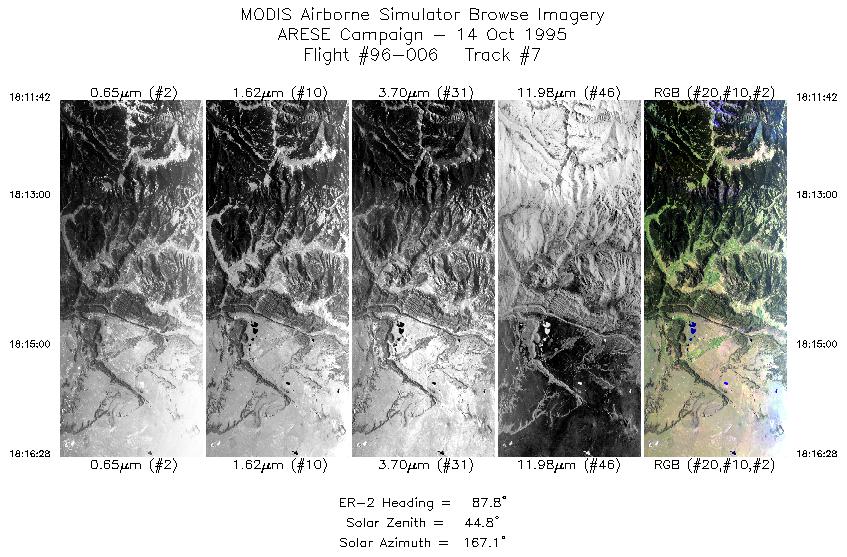
| 7 |
18:11-18:16 |
88 |
35.98-36.00 |
105.66-104.99 |
1787 |
~20000 |
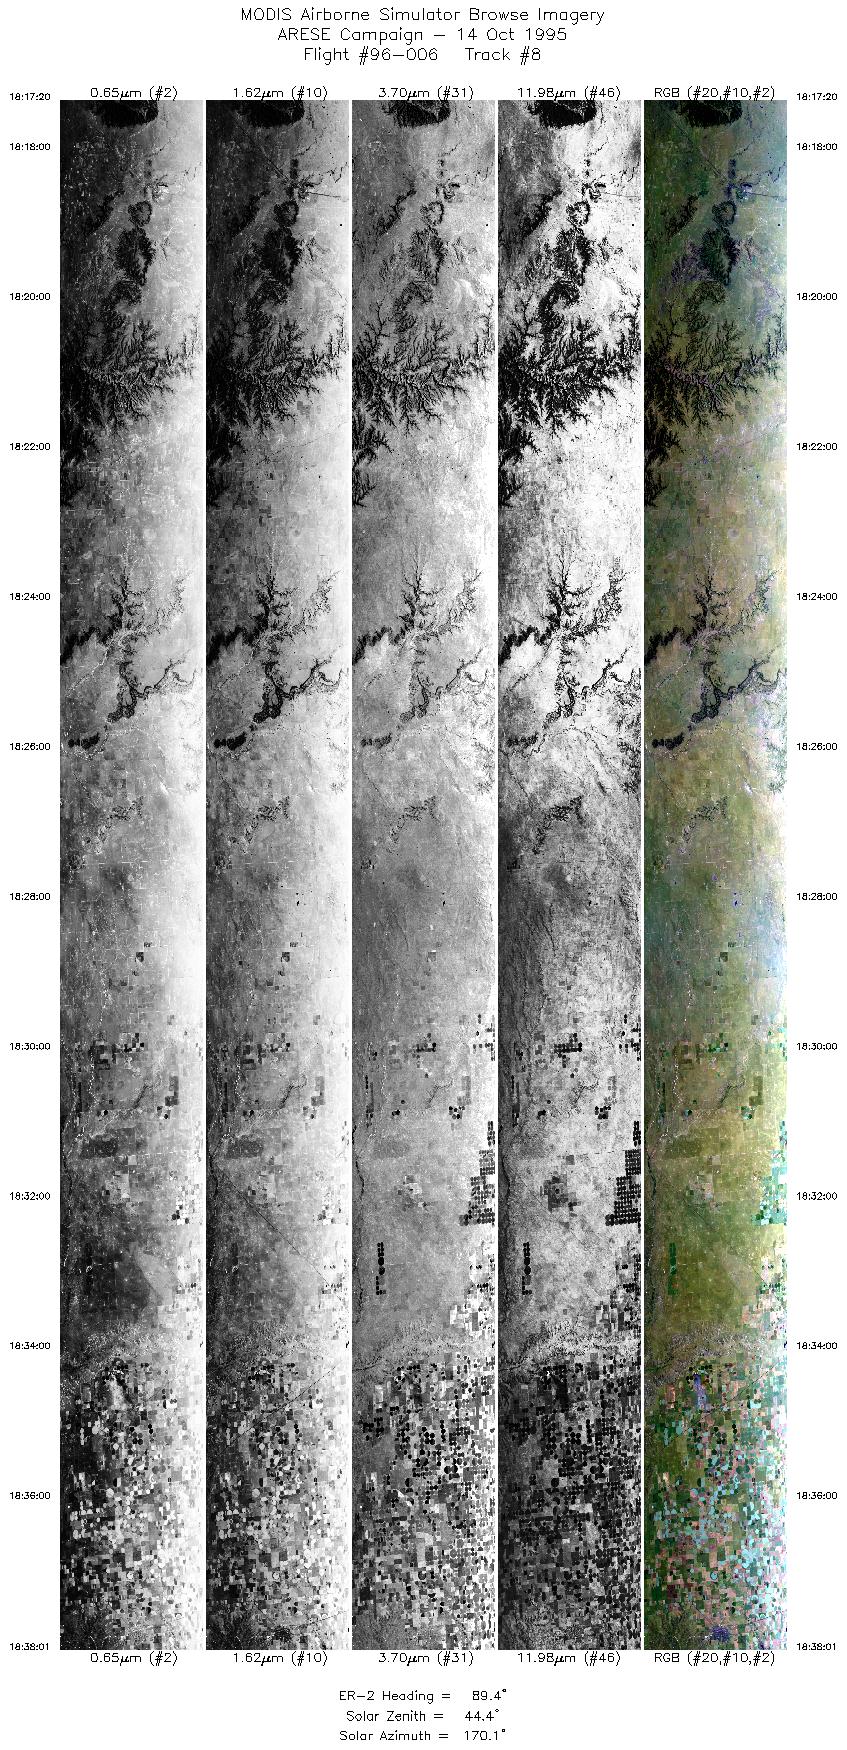
| 8 |
18:17-18:37 |
89 |
36.00-35.87 |
104.88-101.94 |
7751 |
~20000 |
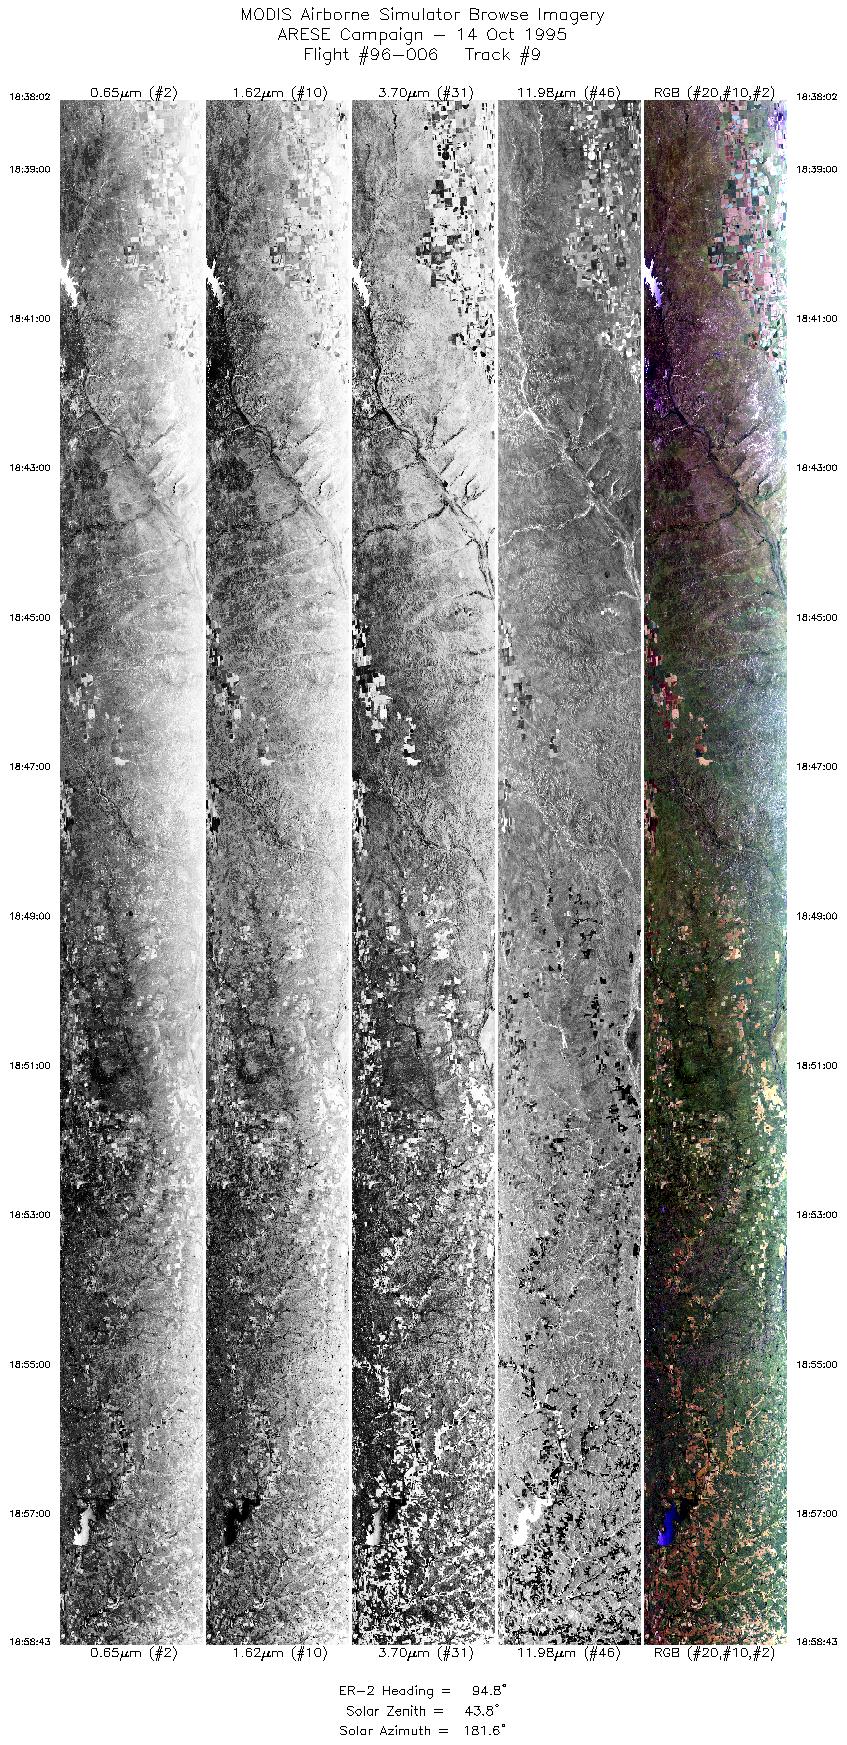
| 9 |
18:38-18:58 |
95 |
35.87-35.66 |
101.94-98.99 |
7728 |
~20000 |
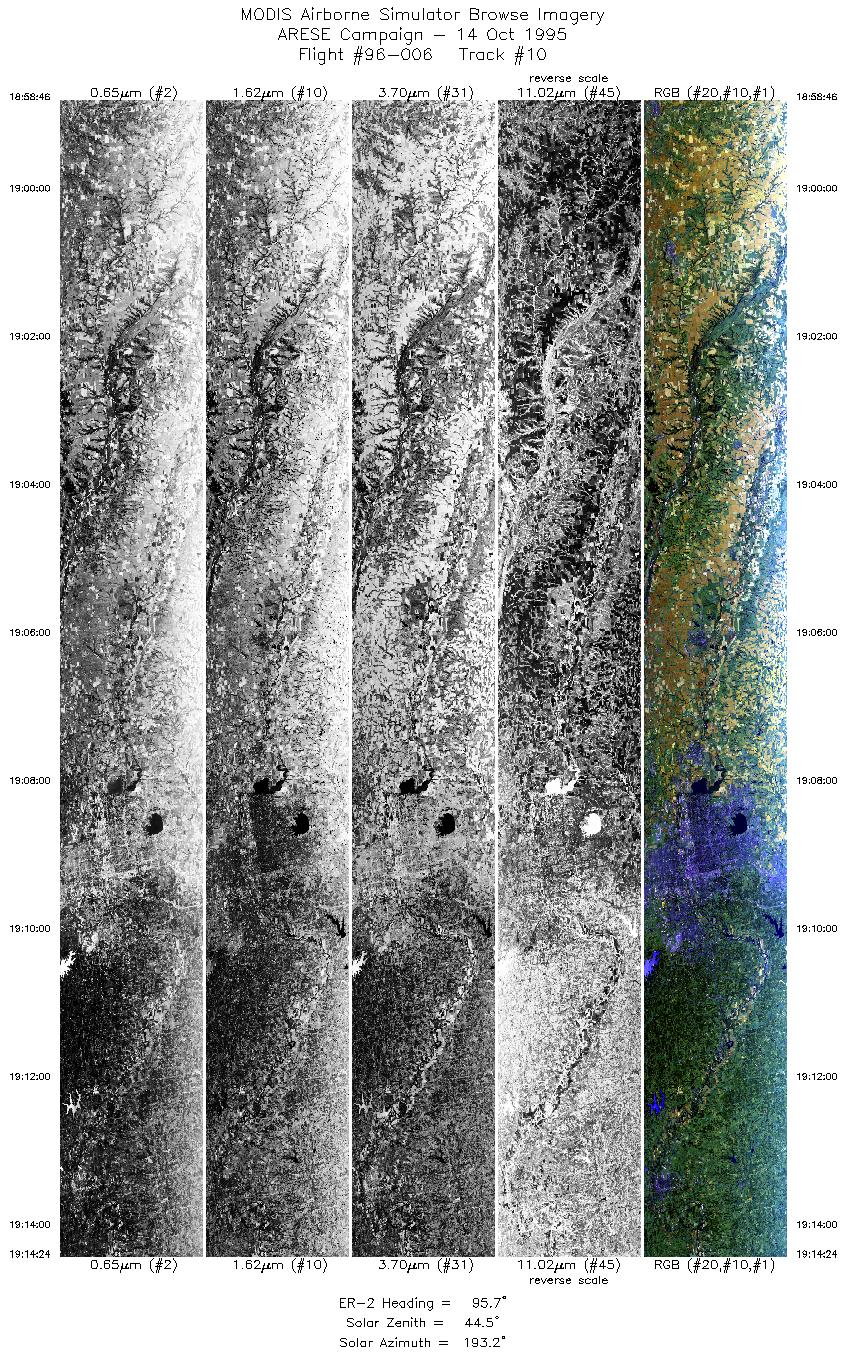
| 10 |
18:58-19:14 |
96 |
35.65-35.45 |
98.98-96.76 |
5785 |
~20000 |
| 11 |
19:14-19:29 |
97 |
35.45-35.21 |
96.76-94.57 |
5789 |
~20000 |
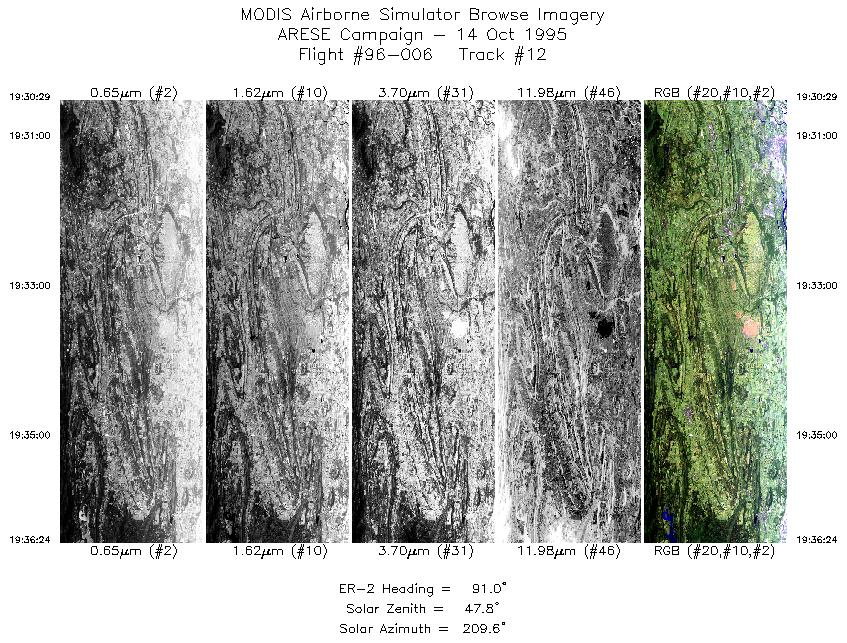
| 12 |
19:30-19:36 |
91 |
35.20-35.20 |
94.50-93.68 |
2218 |
~20000 |
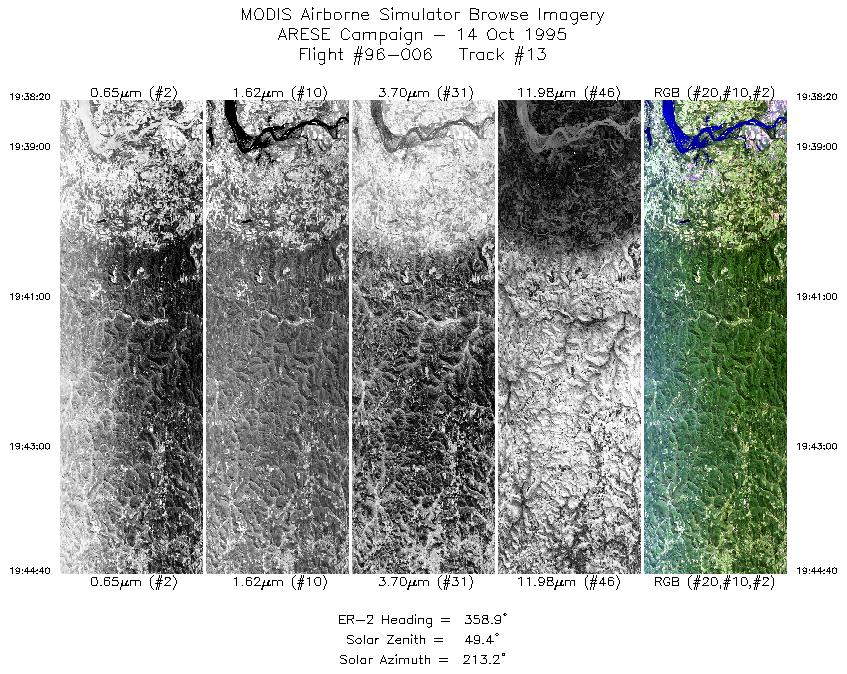
| 13 |
19:38-19:44 |
359 |
35.35-36.08 |
93.53-93.53 |
2374 |
~20000 |
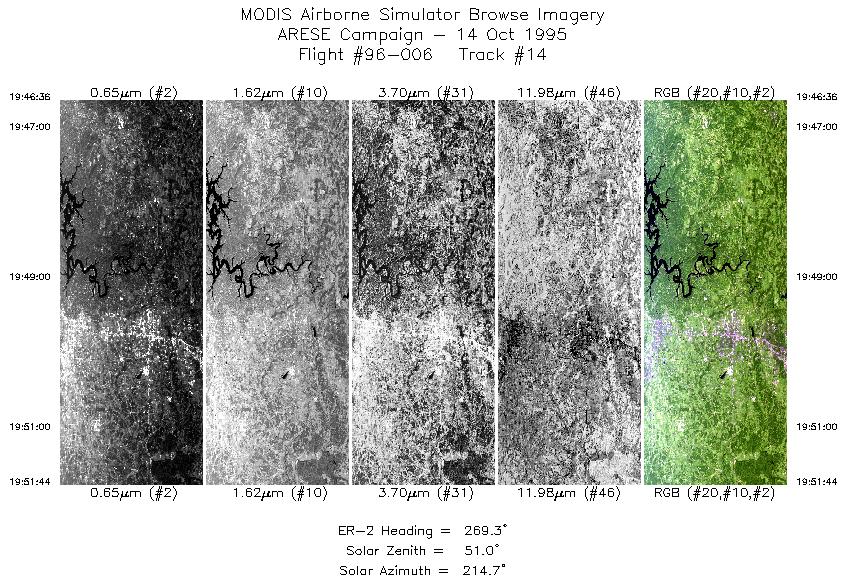
| 14 |
19:46-19:51 |
269 |
36.20-36.20 |
93.71-94.41 |
1925 |
~20000 |
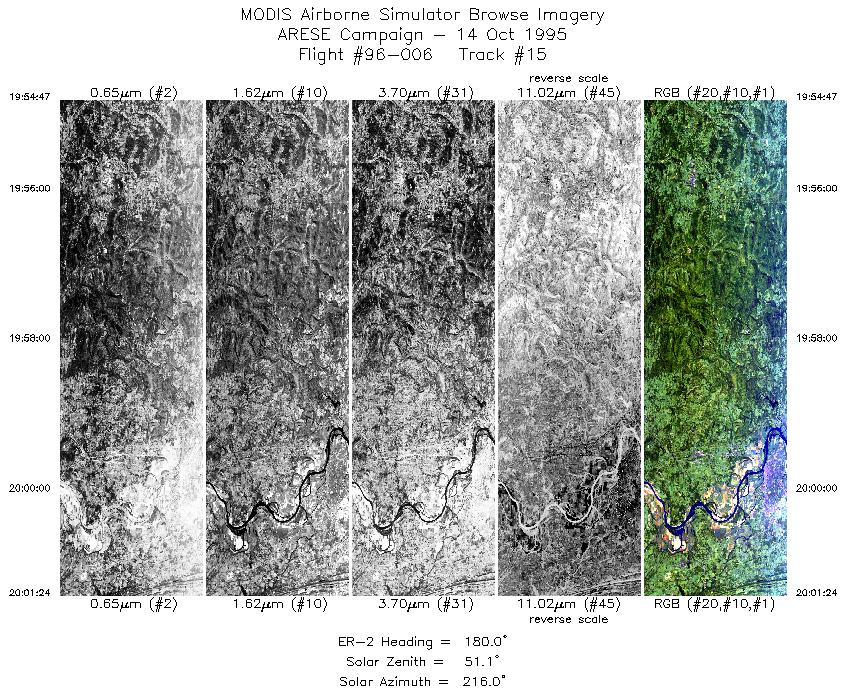
| 15 |
19:54-20:01 |
180 |
35.94-35.20 |
94.58-94.53 |
2480 |
~20000 |
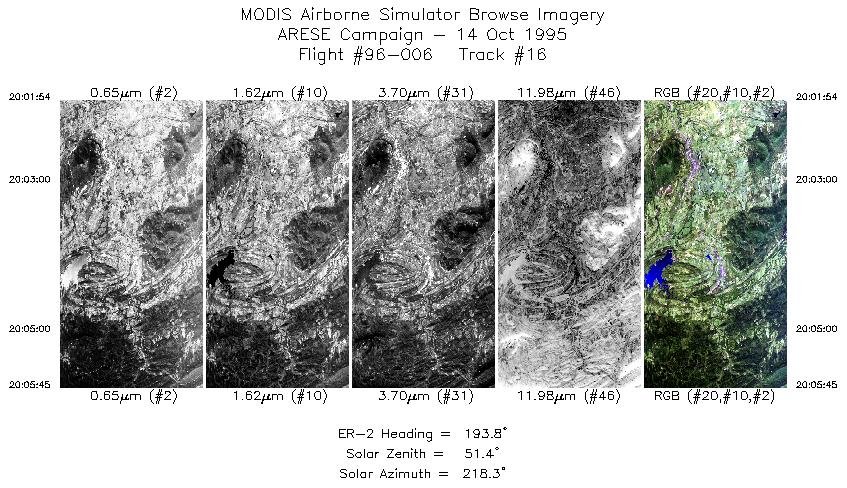
| 16 |
20:01-20:05 |
194 |
35.14-34.73 |
94.54-94.66 |
1443 |
~20000 |
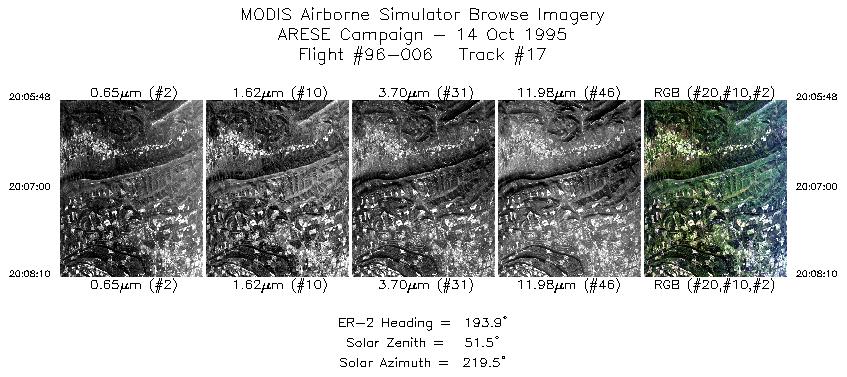
| 17 |
20:05-20:08 |
194 |
34.72-34.46 |
94.66-94.73 |
886 |
~20000 |
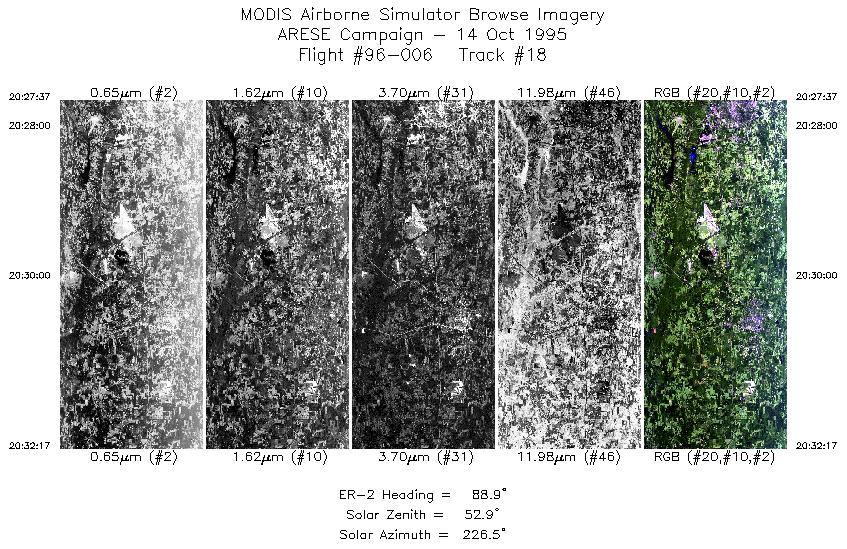
| 18 |
20:27-20:32 |
89 |
32.47-32.47 |
94.76-94.14 |
1748 |
~20000 |
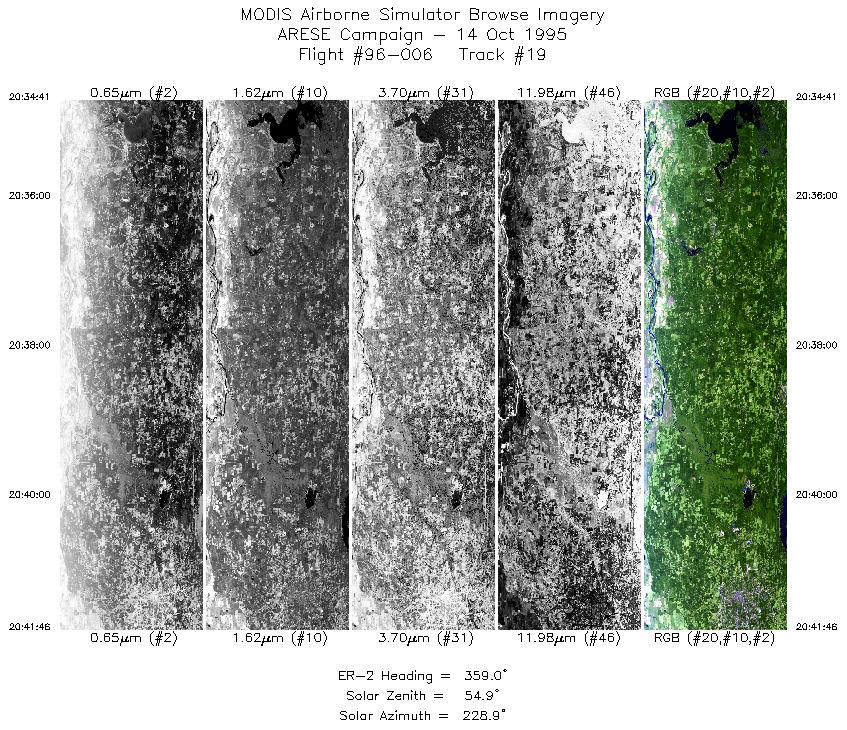
| 19 |
20:34-20:41 |
359 |
32.67-33.48 |
94.00-94.00 |
2654 |
~20000 |
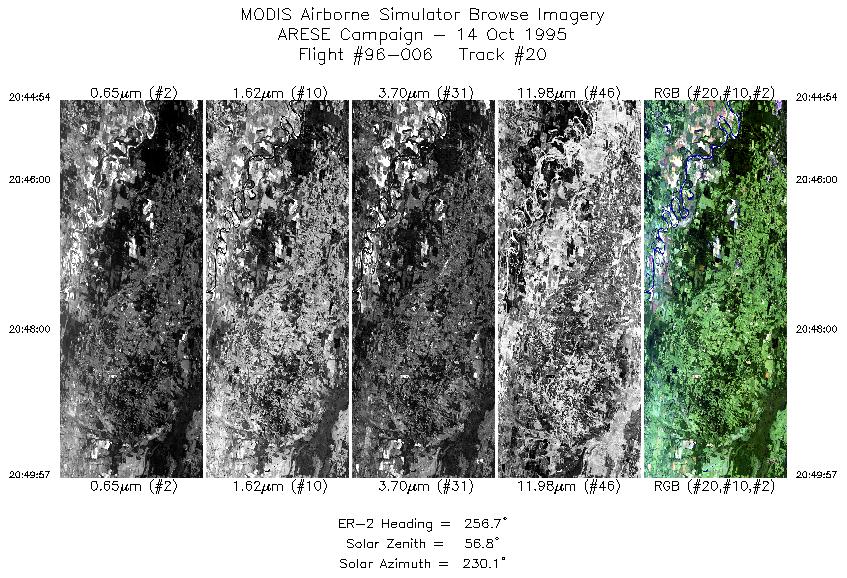
| 20 |
20:44-20:49 |
257 |
33.60-33.47 |
94.34-94.99 |
1893 |
~20000 |
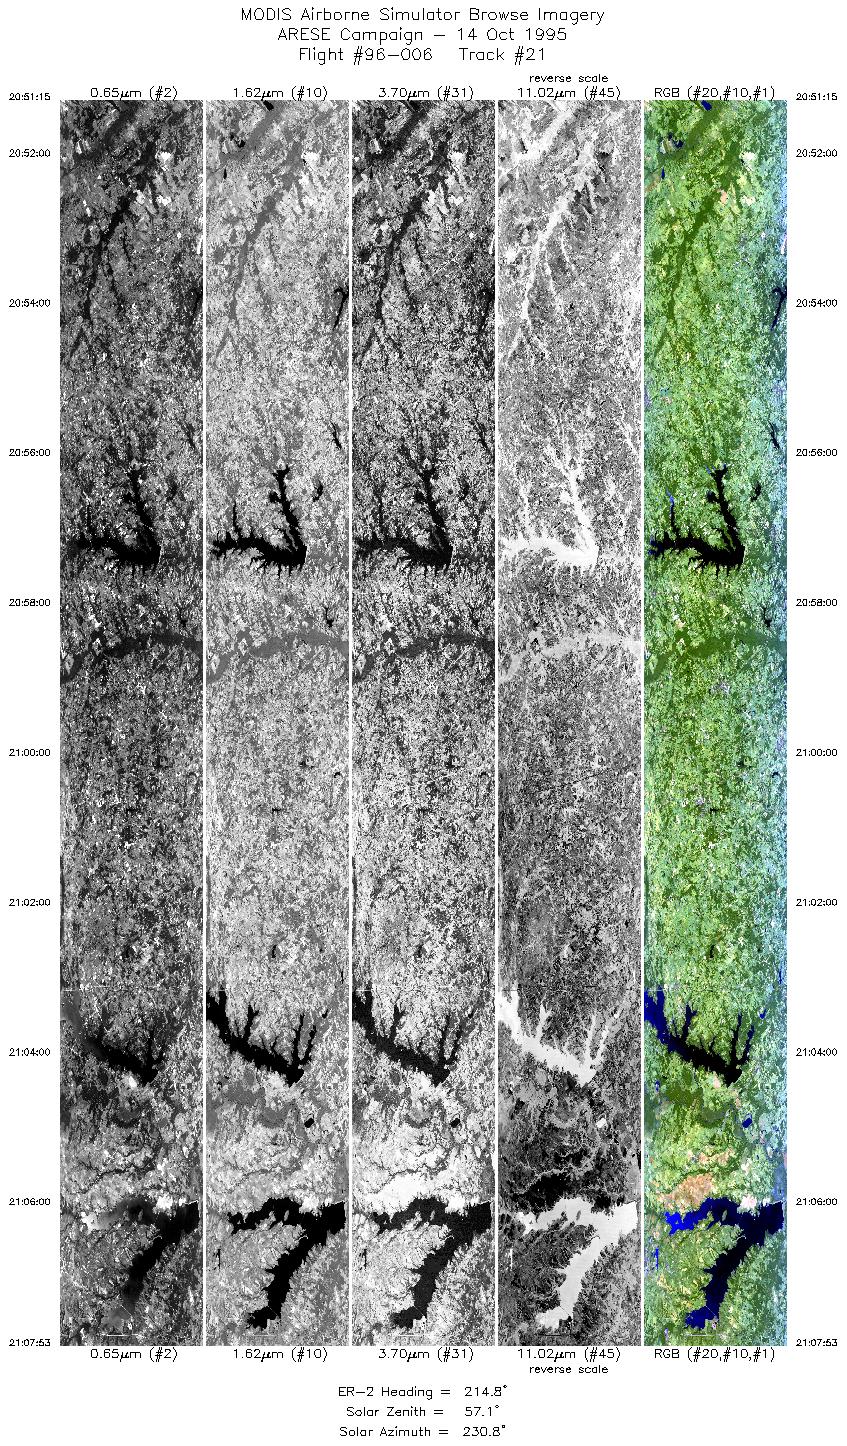
| 21 |
20:51-21:07 |
215 |
33.39-31.88 |
95.12-96.37 |
6234 |
~20000 |
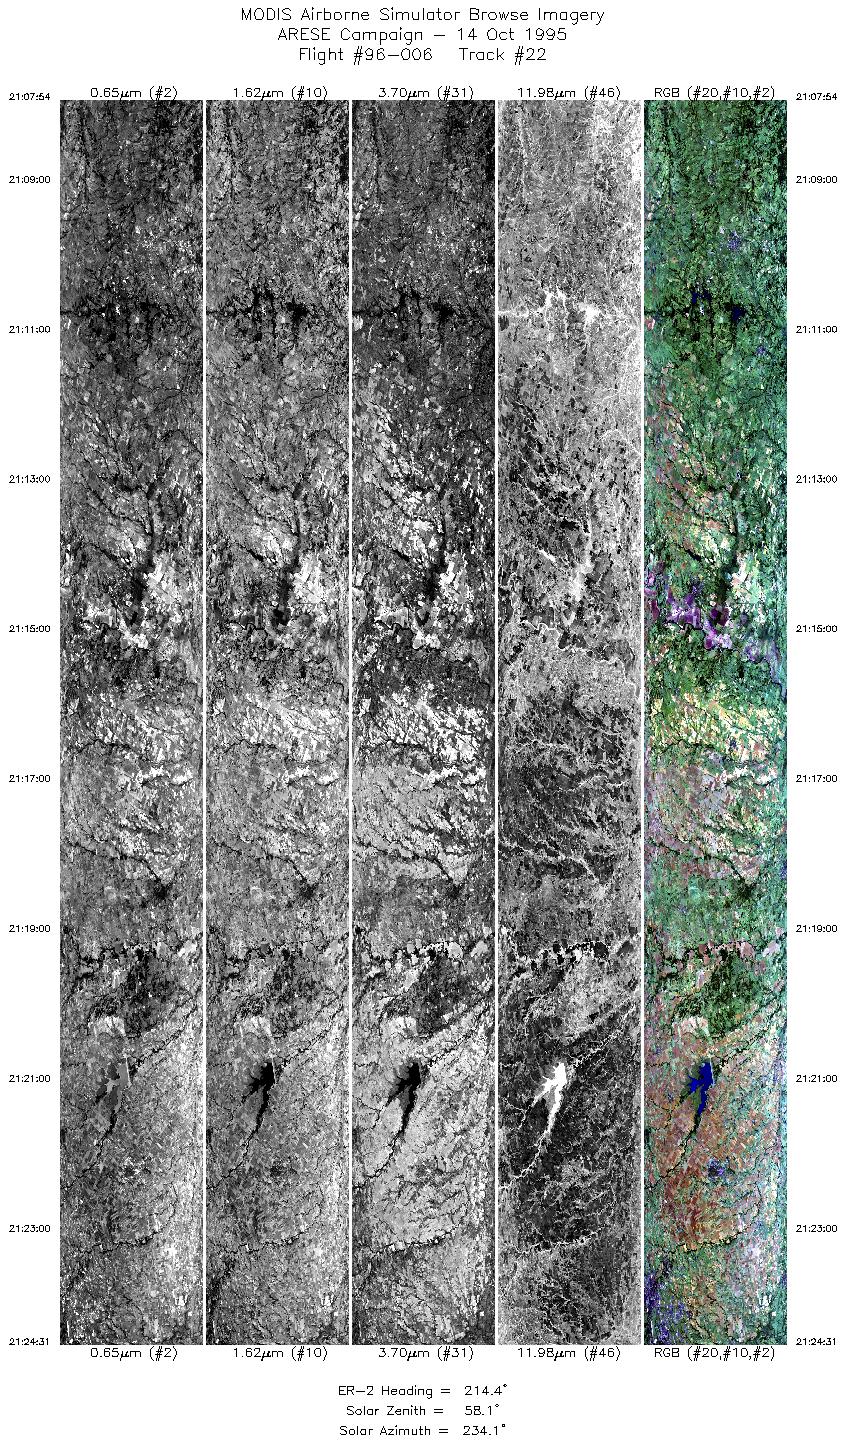
| 22 |
21:07-21:24 |
214 |
31.88-30.36 |
96.37-97.58 |
6227 |
~20000 |
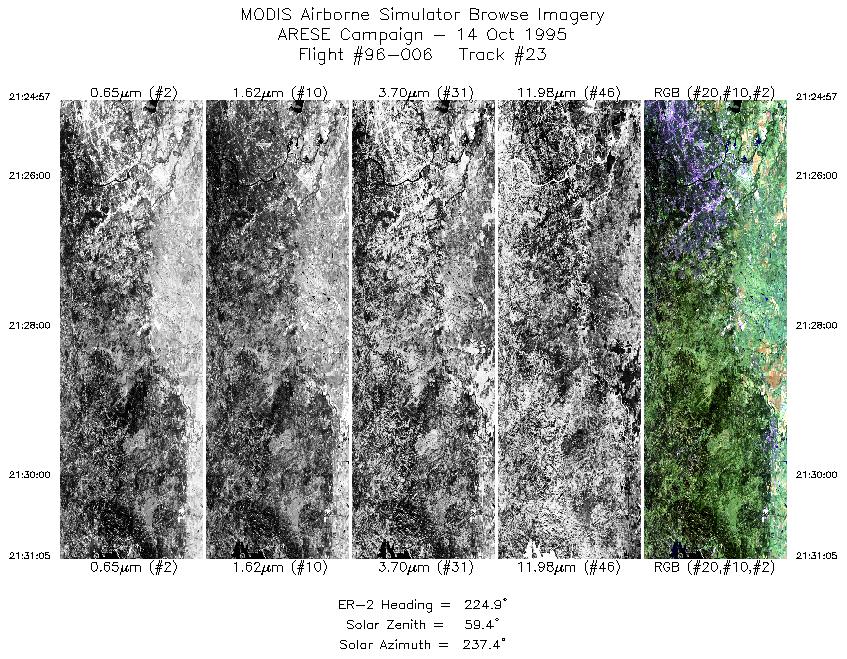
| 23 |
21:24-21:31 |
225 |
30.32-29.83 |
97.61-98.17 |
2299 |
~20000 |
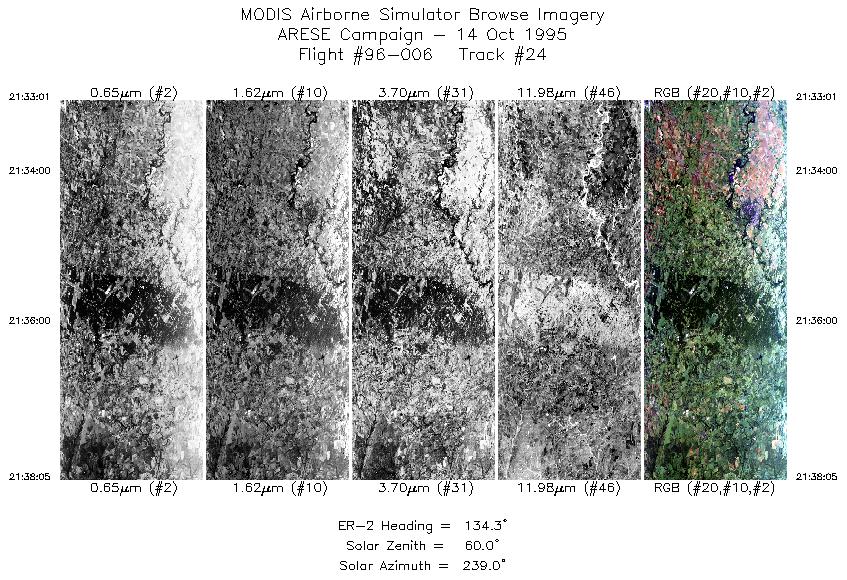
| 24 |
21:33-21:38 |
134 |
29.65-29.25 |
98.15-97.69 |
1900 |
~20000 |
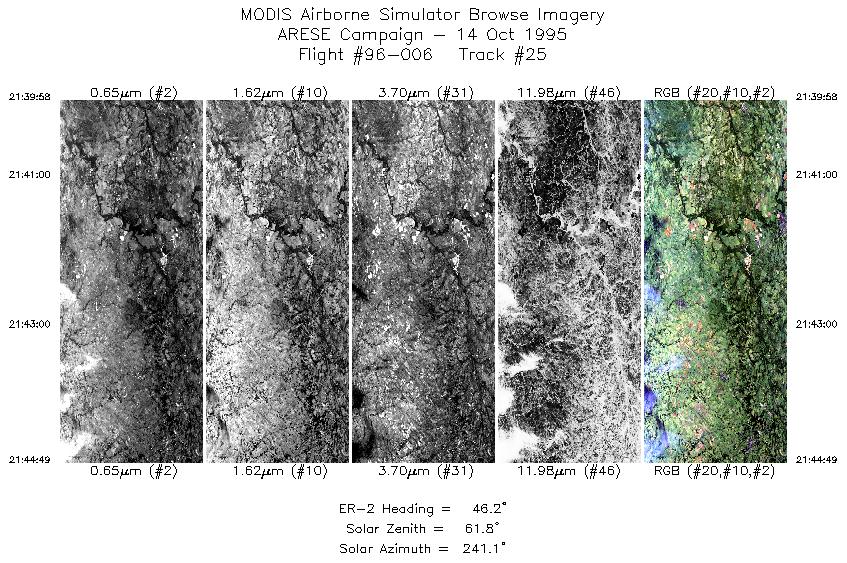
| 25 |
21:39-21:44 |
46 |
29.27-29.66 |
97.49-97.04 |
1818 |
~20000 |
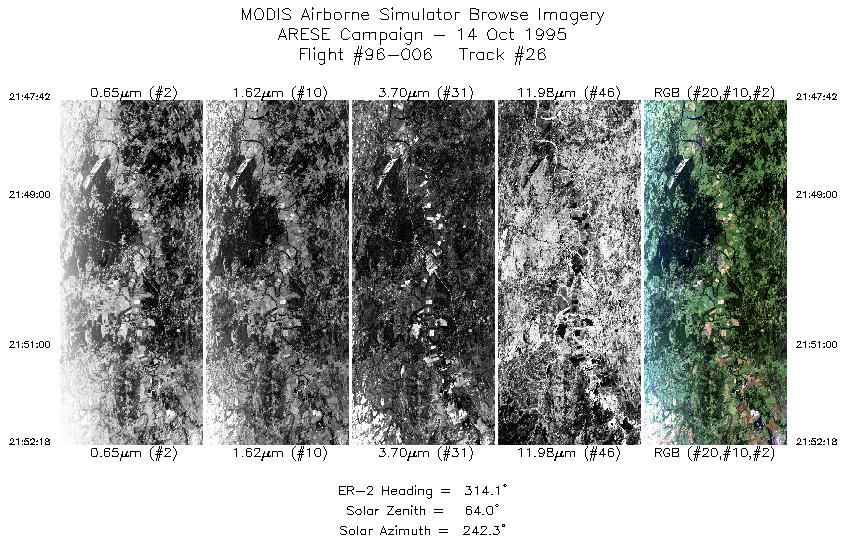
| 26 |
21:47-21:52 |
314 |
29.94-30.30 |
97.13-97.57 |
1725 |
~20000 |
|
Images 01 through 26 in sequence |
Level-1B Data Distribution
NASA LaRC Atmospheric Sciences Data Center
|
|