
|
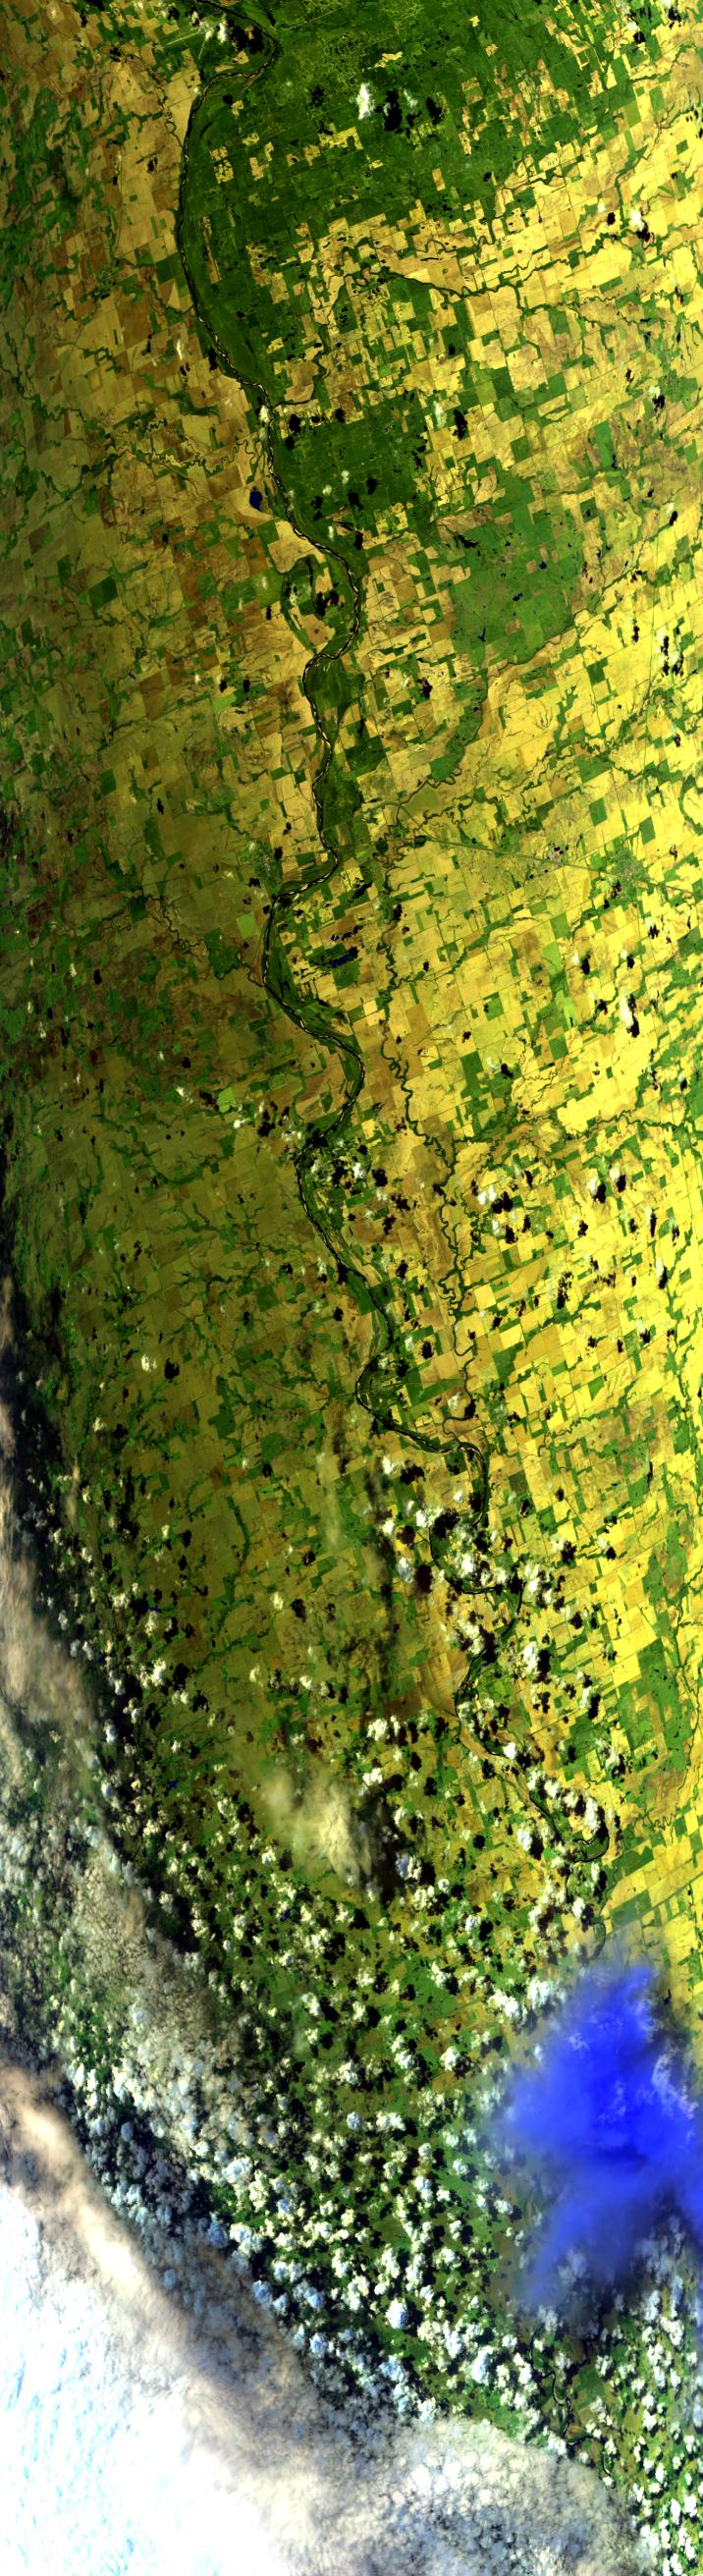
Sample Image

25 Sept 1995
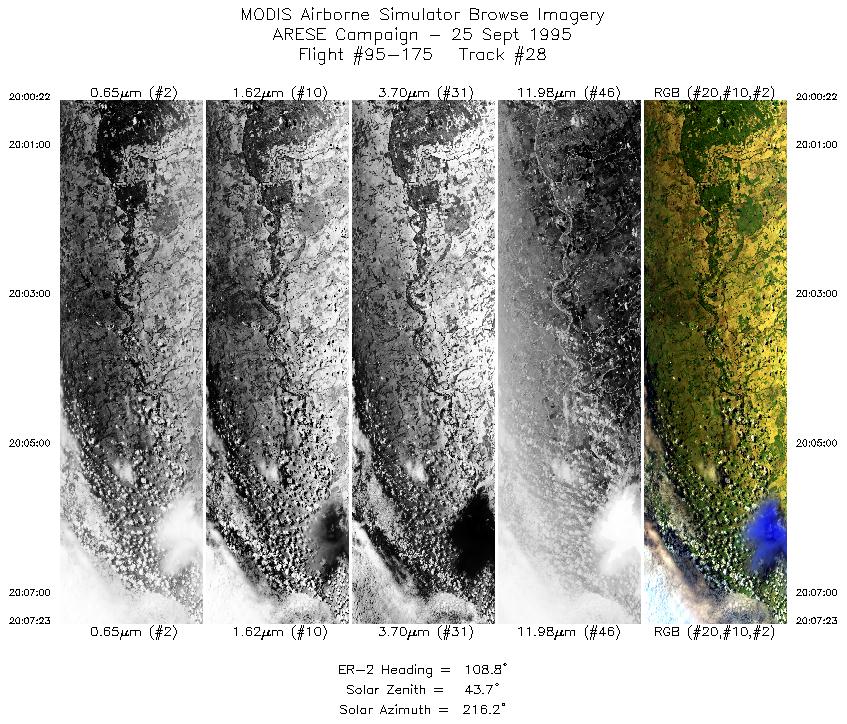
Track #28
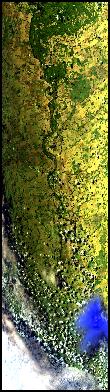

Flightline begins over Kegelman AFB, east of the Salt Plains National Wildlife Refuge. Proceeds east, following the Salt Fork Arkansas River.
R: 2.14 microns
G: 1.62 microns
B: 0.55 microns
|
|
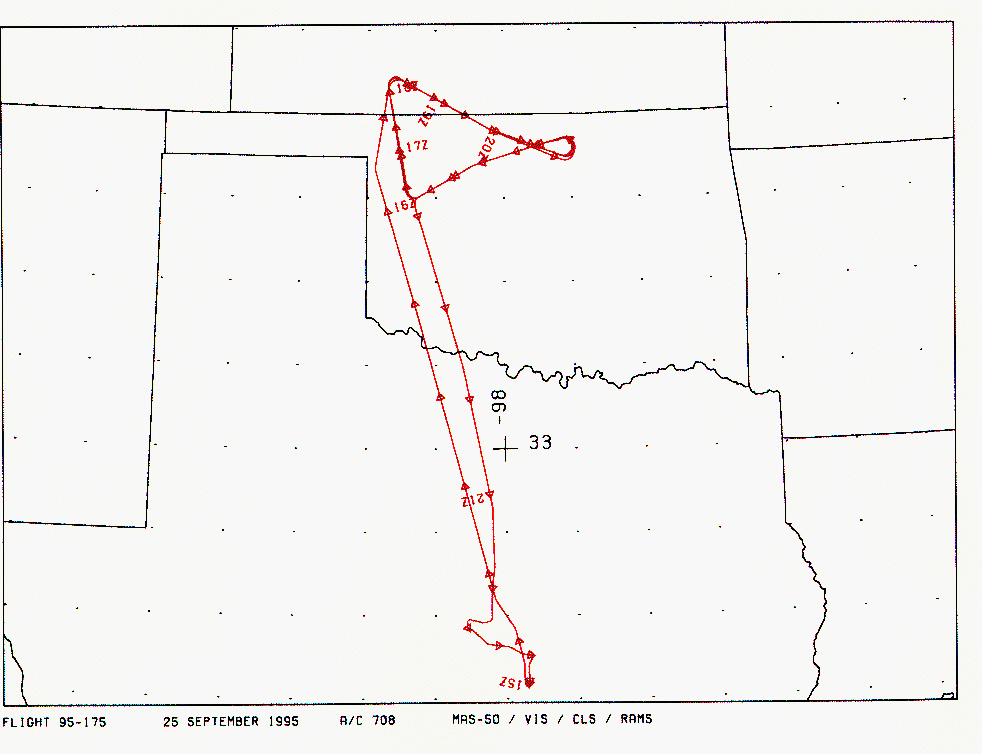
Mission Summary
Date: September 25, 1995
ER-2 Flight Number: 95-175
Flight Location: Oklahoma
Principal Investigator: Dr. Francisco Valero (Scripps)
Additional Sensors: RAMS, CLS, VIS
Objective: Investigate the absorption of solar radiation by clouds, aerosols, and atmospheric gases.
Level-1B Processing Information
Level-1B Data processed by: Ames Research Center
Level-1B Data Version: #09
Level-1B Configuration: (sample file)
Calibration Type: Final
Calibration Version: ARESE 1.0
Temperature Adjustment: 35C
Status: Completed with final calibration
|
|
Flight Track Map
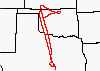

|
Level-1B Browse Imagery
Straight Line Flight Tracks: 34
Scanlines Processed: 109141
Solar Azimuth and Zenith Angles
|
Browse Images
|
Click on the Flight Track number to load images.
Lat/Lon ranges are for the BEG-END scanline nadir pixels.
|
Flight
Track |
Time_Span
(GMT) |
Heading
(Deg) |
Lat_Range
(Deg_N) |
Lon_Range
(Deg_W) |
Length
(Scanlines) |
Altitude
(Meters) |
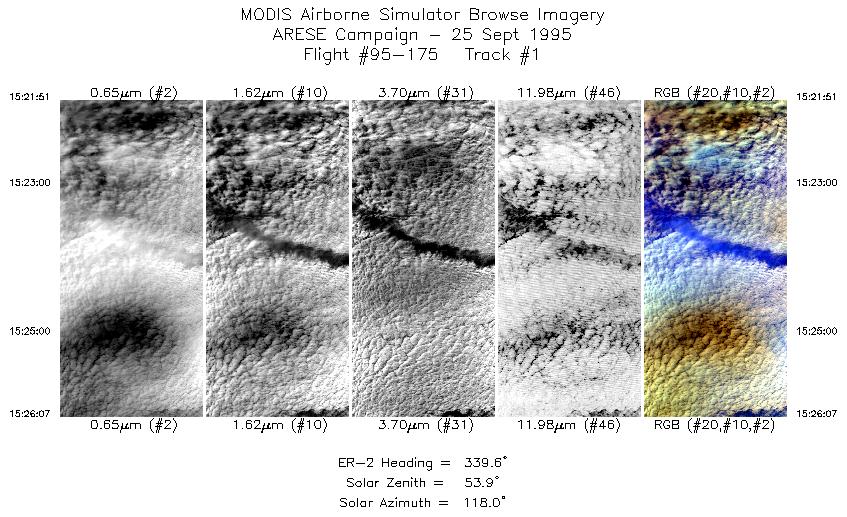
| 1 |
15:21-15:26 |
340 |
31.67-32.12 |
98.29-98.44 |
1585 |
~20000 |
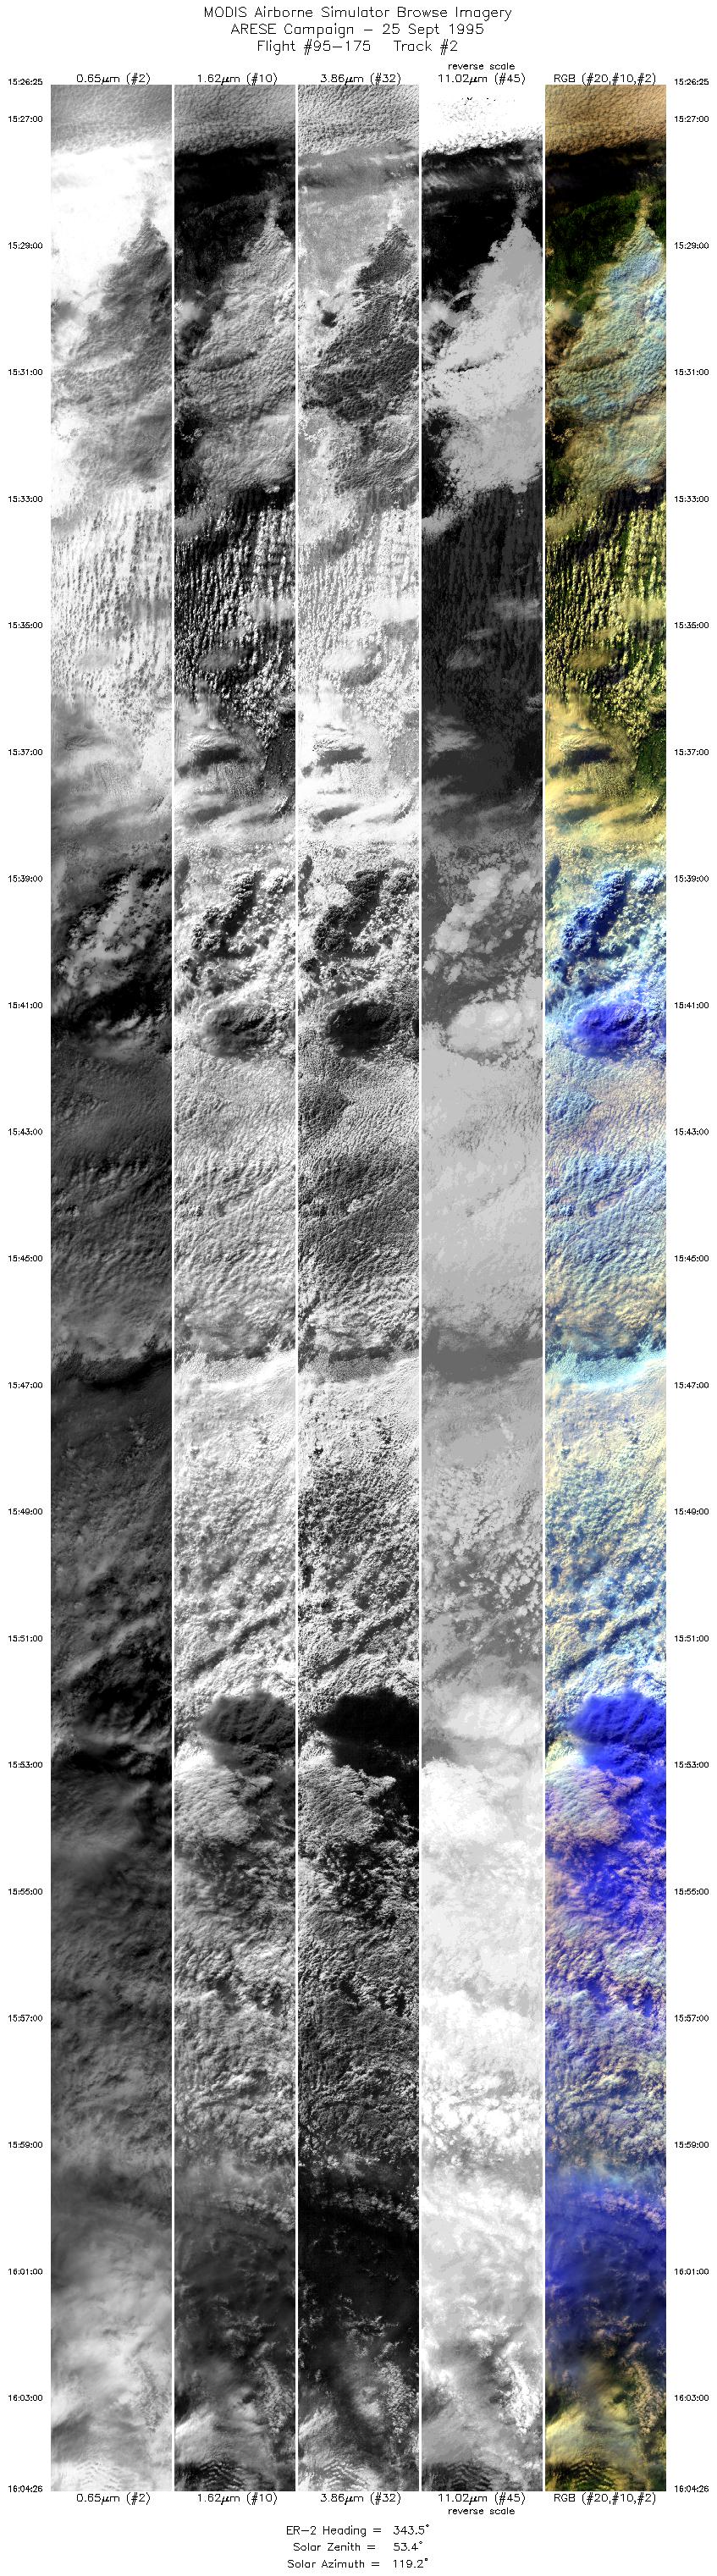
| 2 |
15:26-16:04 |
343 |
32.12-36.30 |
98.42-99.84 |
14218 |
~20000 |
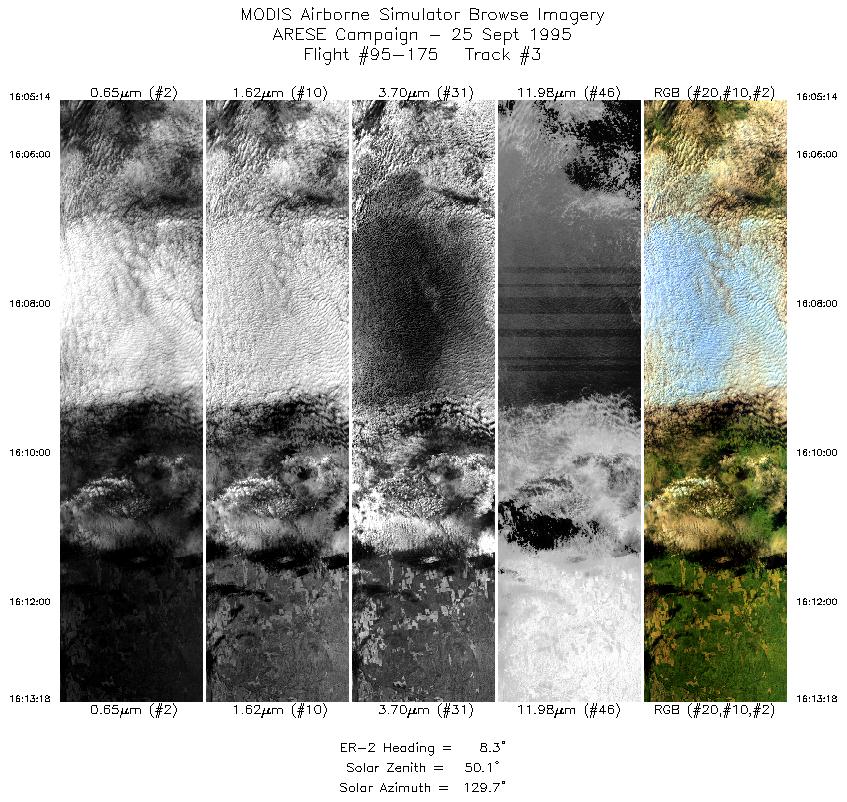
| 3 |
16:05-16:13 |
8 |
36.40-37.31 |
99.87-99.68 |
3014 |
~20000 |
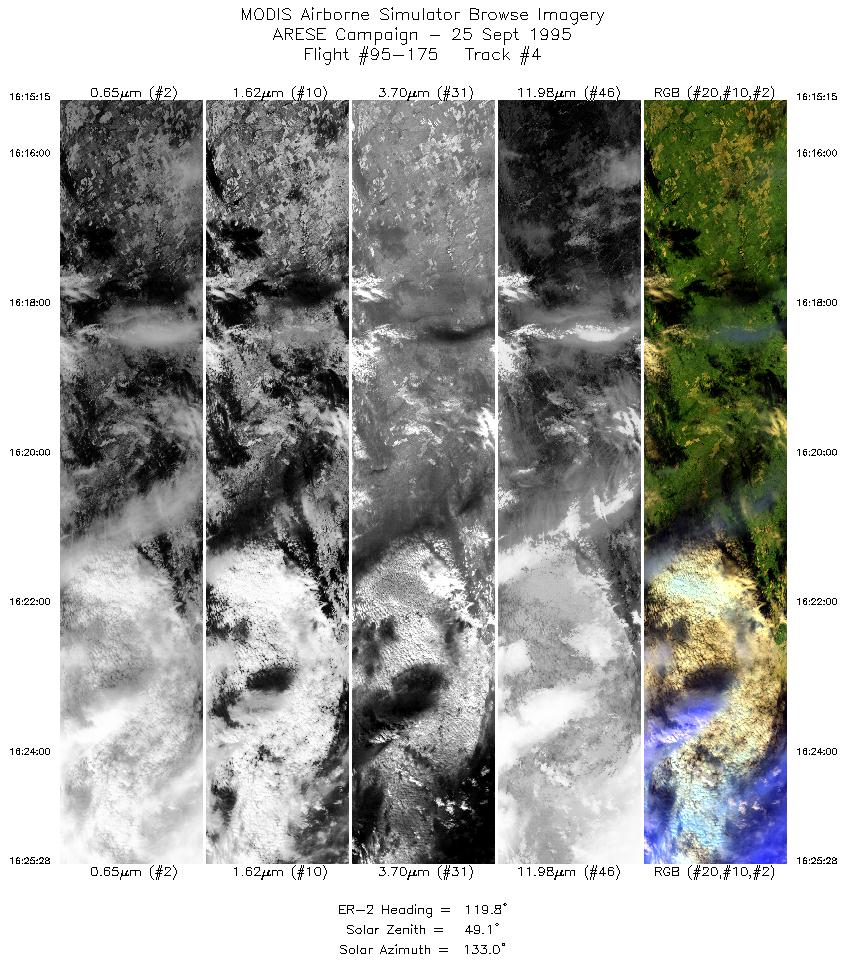
| 4 |
16:15-16:25 |
120 |
37.40-36.83 |
99.46-98.20 |
3820 |
~20000 |
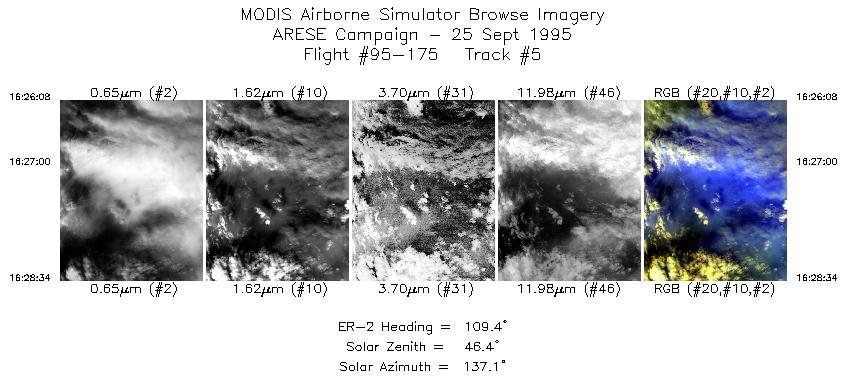
| 5 |
16:26-16:28 |
109 |
36.80-36.71 |
98.12-97.79 |
907 |
~20000 |
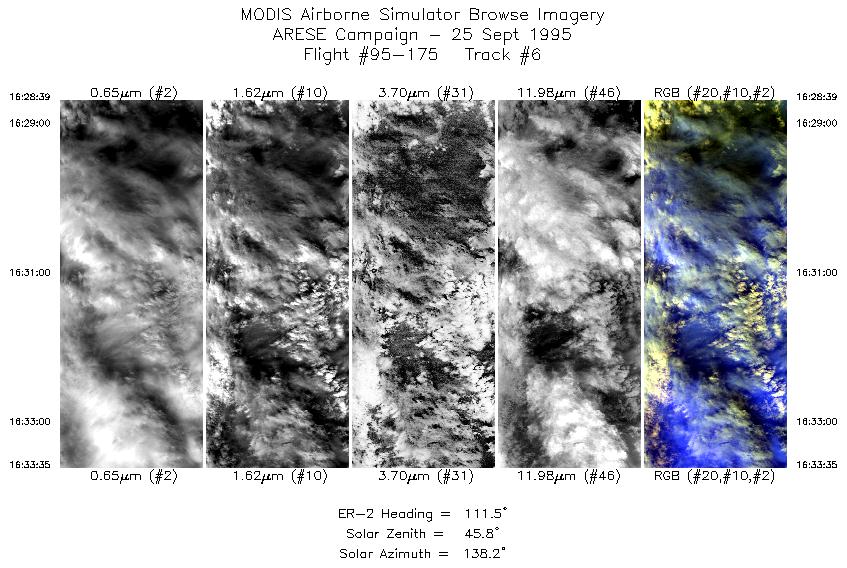
| 6 |
16:28-16:33 |
111 |
36.70-36.50 |
97.77-97.11 |
1841 |
~20000 |
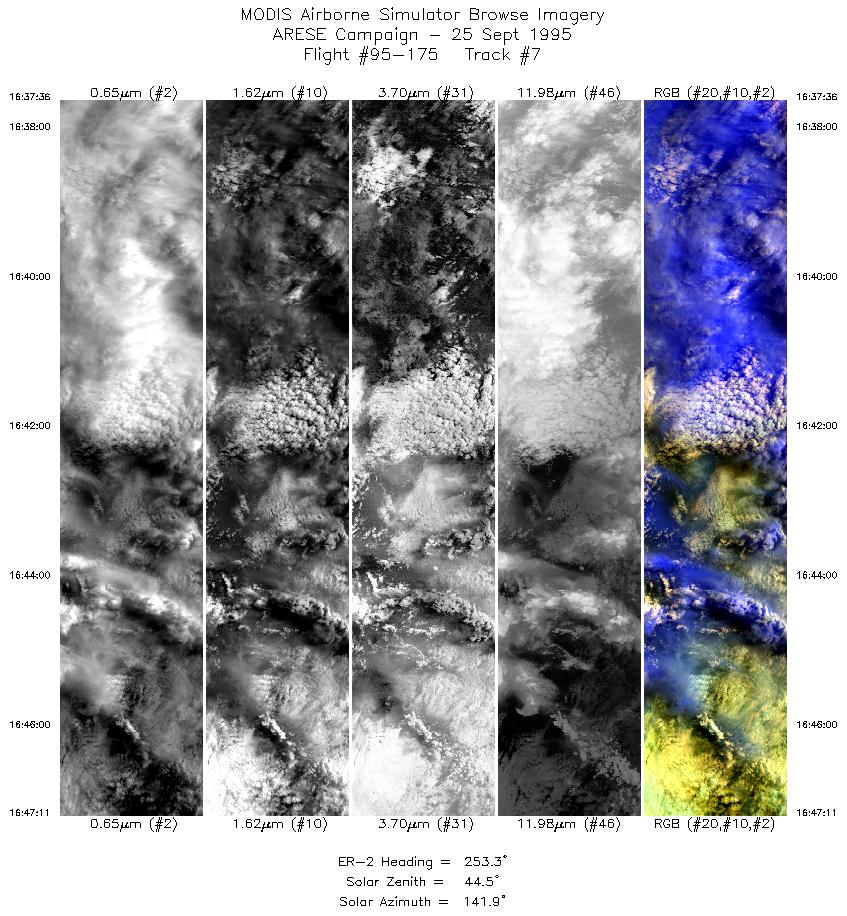
| 7 |
16:37-16:47 |
253 |
36.71-36.40 |
97.14-98.39 |
3583 |
~20000 |
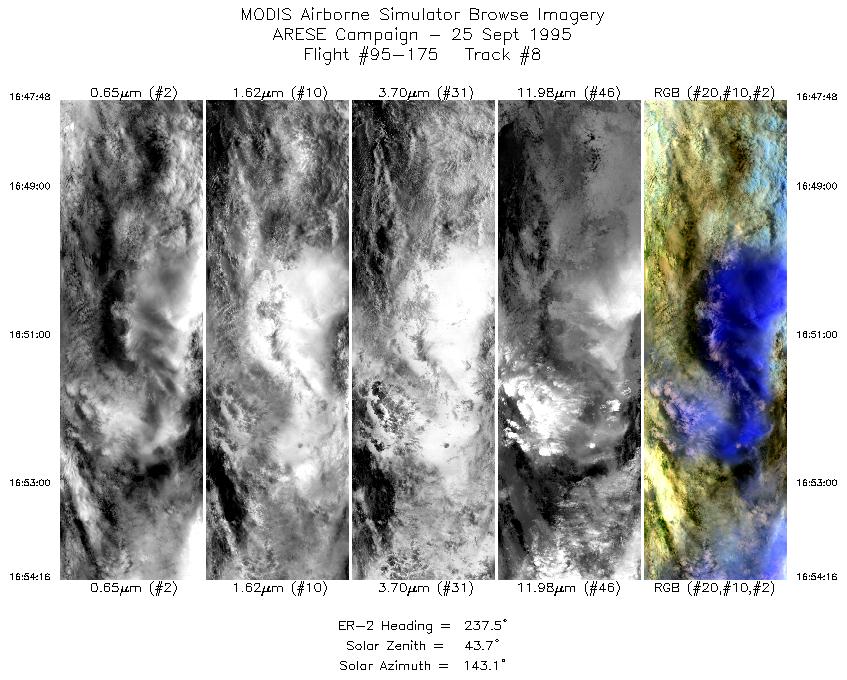
| 8 |
16:47-16:54 |
238 |
36.37-36.02 |
98.47-99.23 |
2404 |
~20000 |
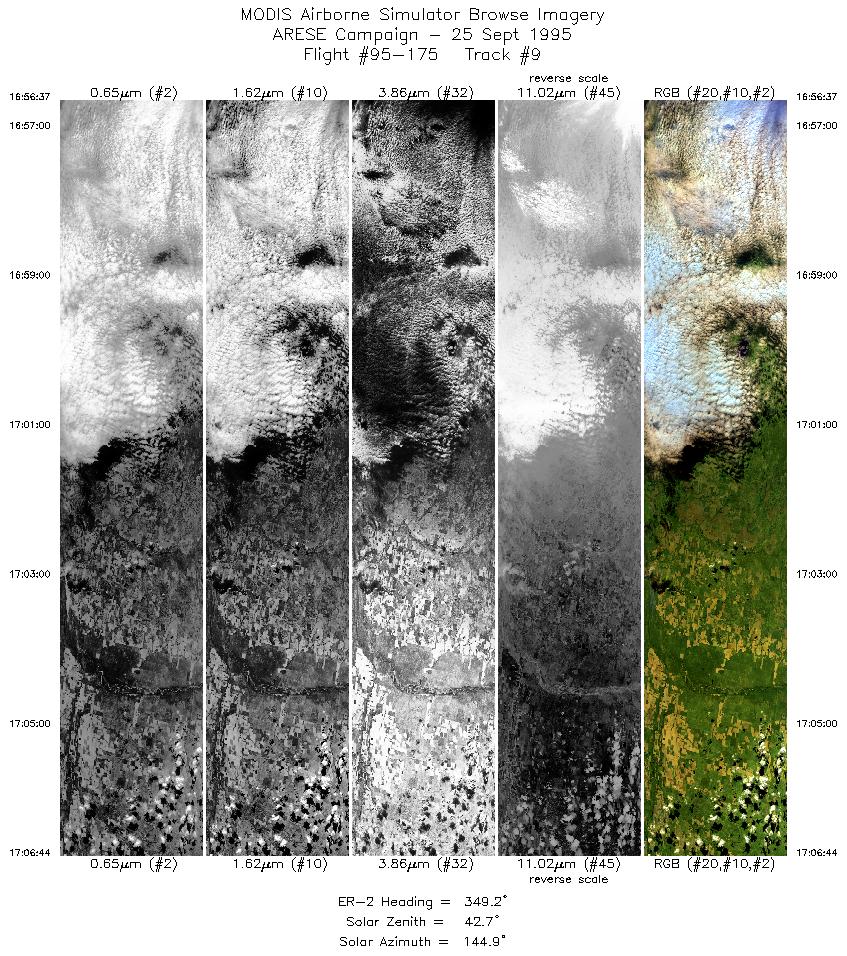
| 9 |
16:56-17:06 |
349 |
36.16-37.32 |
99.44-99.68 |
3783 |
~20000 |
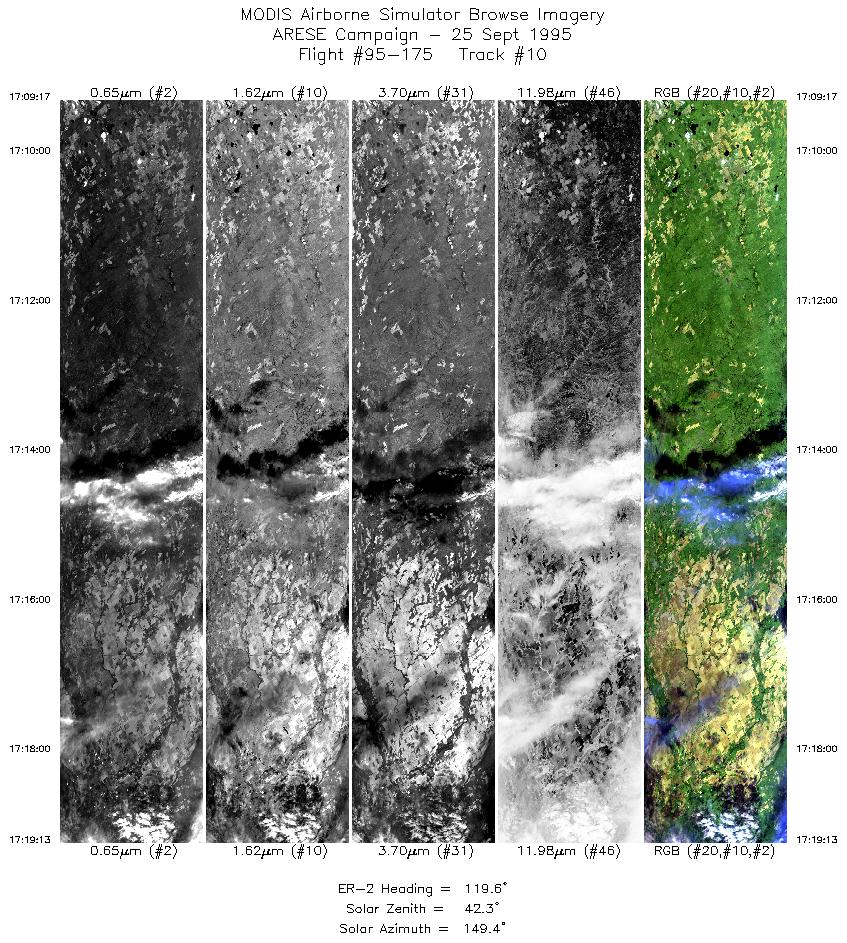
| 10 |
17:09-17:19 |
120 |
37.39-36.84 |
99.44-98.21 |
3715 |
~20000 |
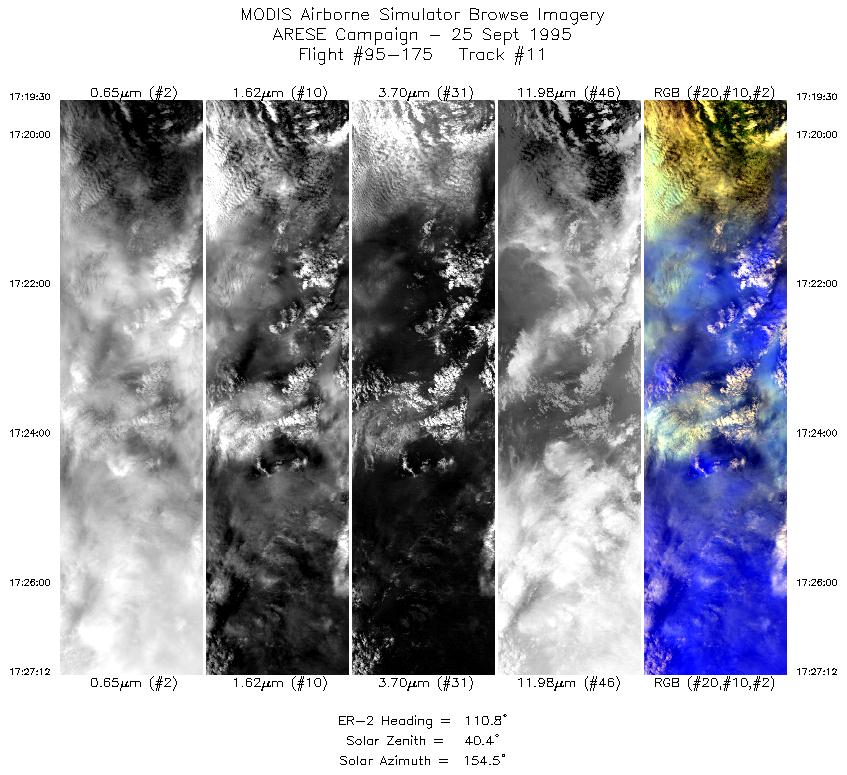
| 11 |
17:19-17:27 |
111 |
36.82-36.50 |
98.17-97.11 |
2877 |
~20000 |
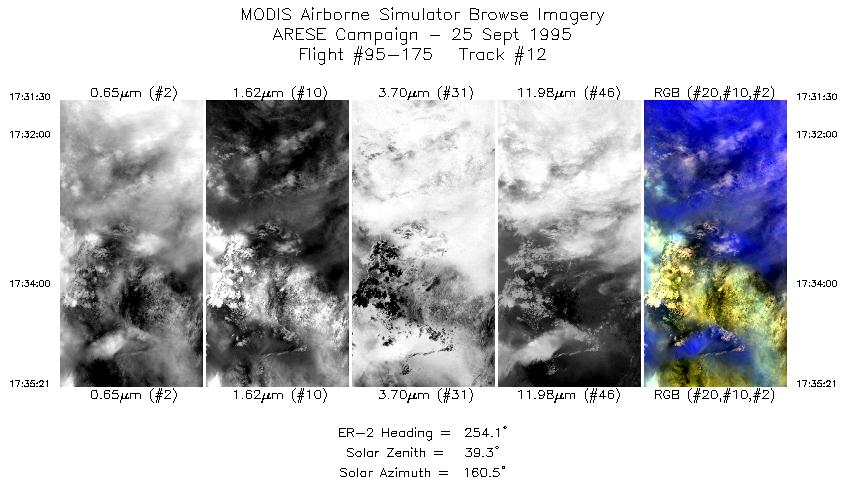
| 12 |
17:31-17:35 |
254 |
36.70-36.58 |
97.17-97.67 |
1437 |
~20000 |
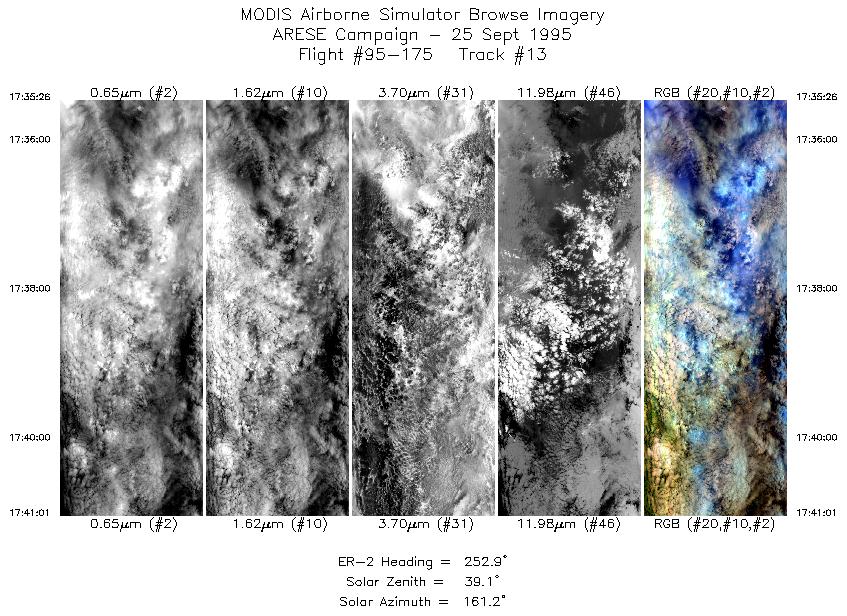
| 13 |
17:35-17:40 |
253 |
36.58-36.40 |
97.69-98.40 |
2084 |
~20000 |
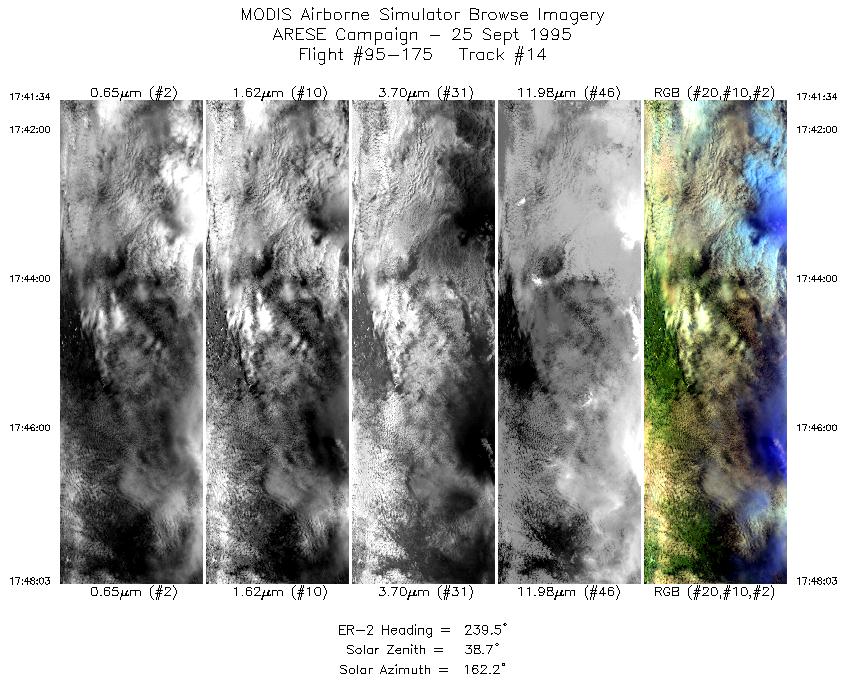
| 14 |
17:41-17:48 |
240 |
36.37-36.02 |
98.47-99.23 |
2423 |
~20000 |
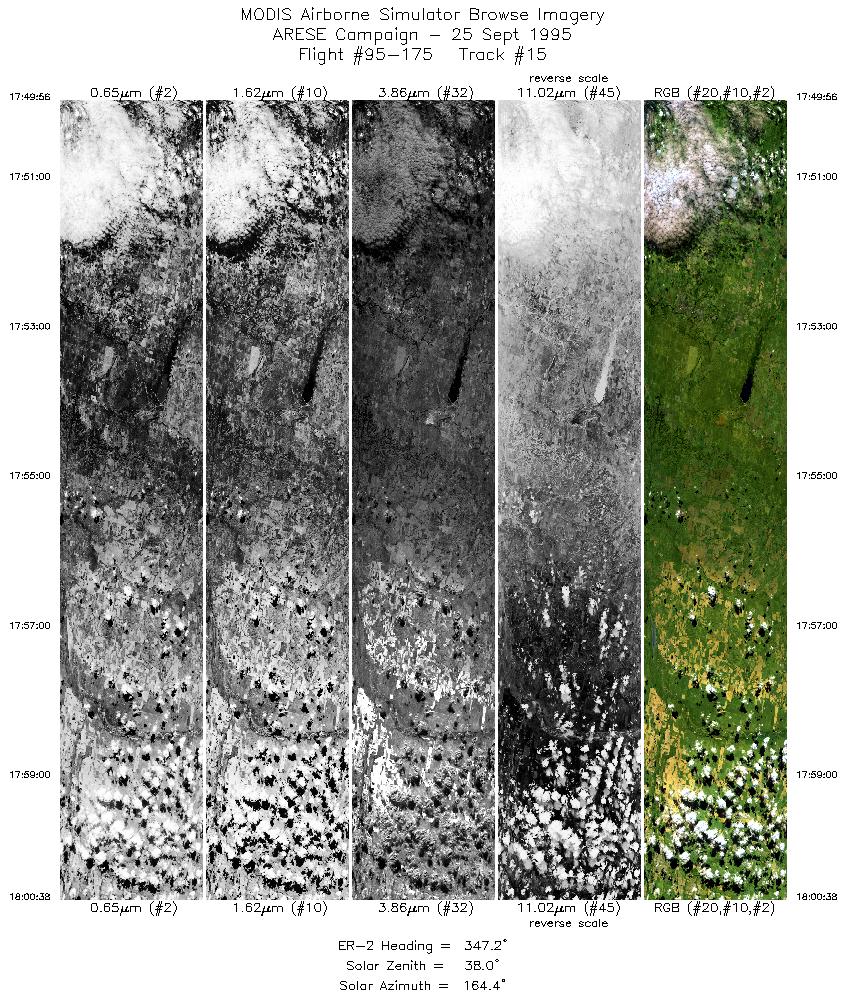
| 15 |
17:49-18:00 |
347 |
36.11-37.32 |
99.41-99.68 |
4001 |
~20000 |
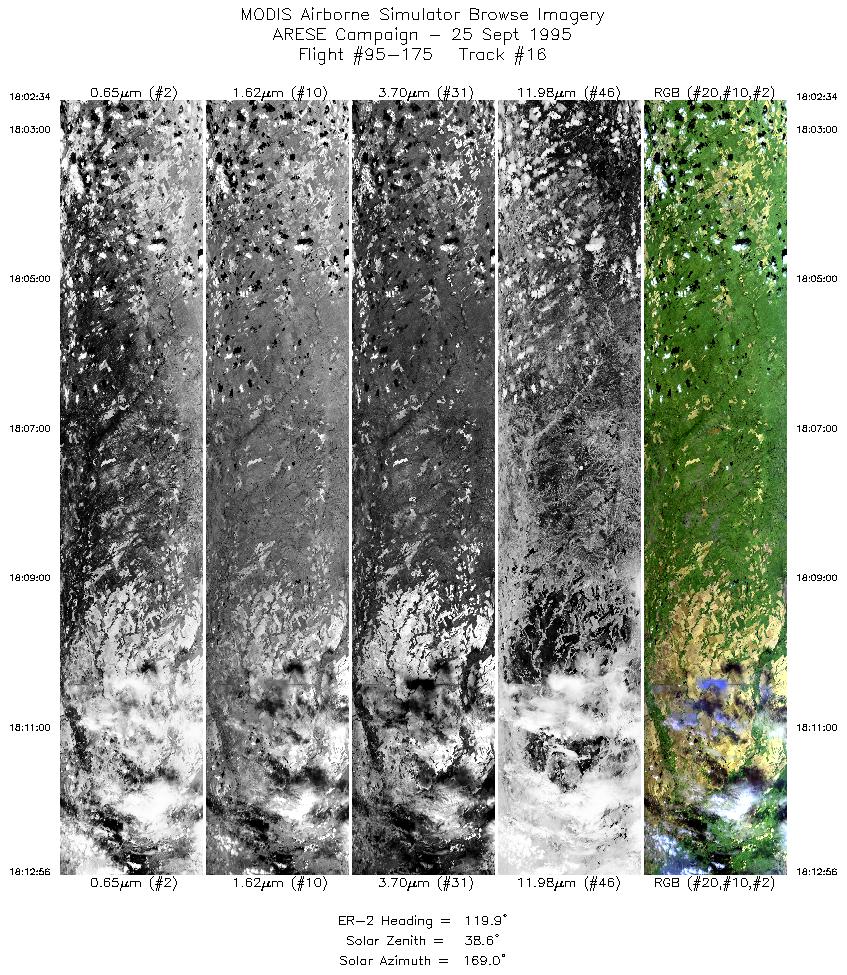
| 16 |
18:02-18:12 |
120 |
37.42-36.83 |
99.51-98.20 |
3877 |
~20000 |
| 17 |
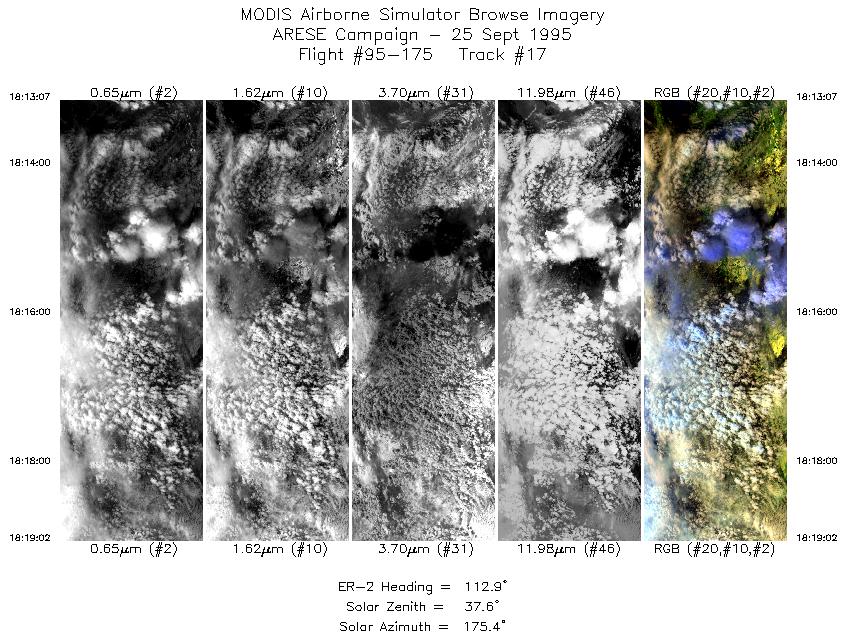
18:13-18:19 |
113 |
36.82-36.54 |
98.17-97.38 |
2209 |
~20000 |
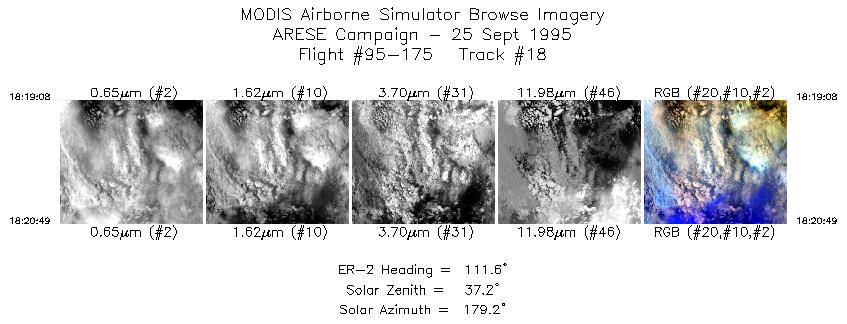
| 18 |
18:19-18:20 |
112 |
36.53-36.46 |
97.36-97.14 |
624 |
~20000 |
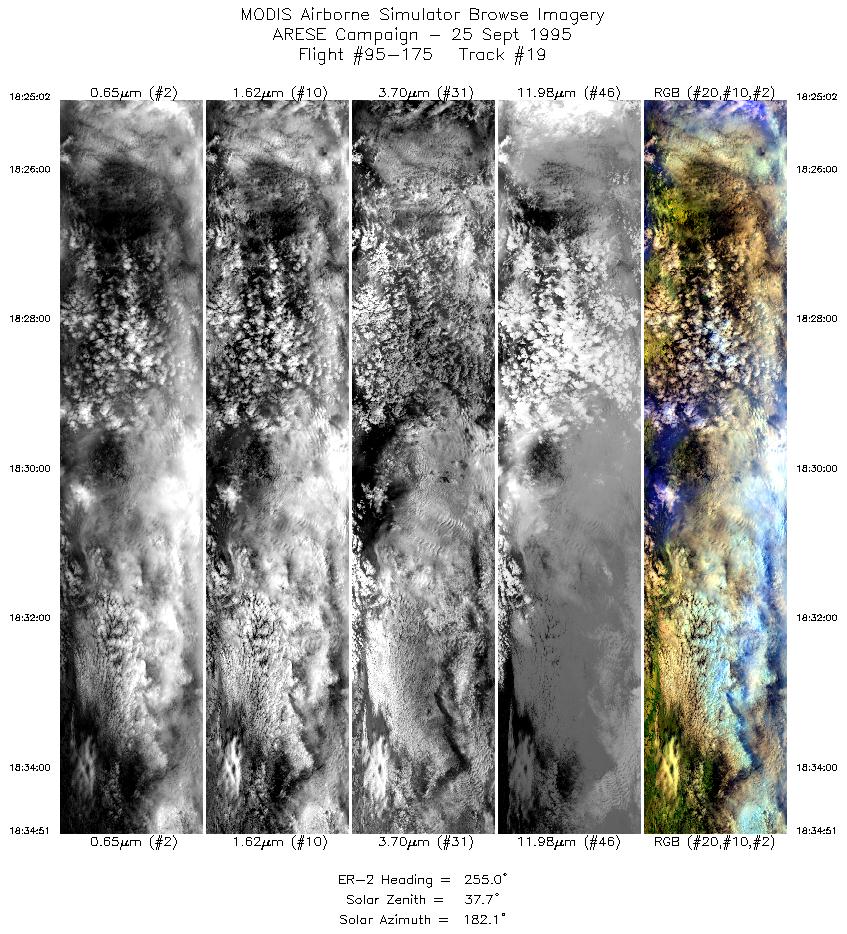
| 19 |
18:25-18:34 |
255 |
36.72-36.40 |
97.10-98.40 |
3671 |
~20000 |
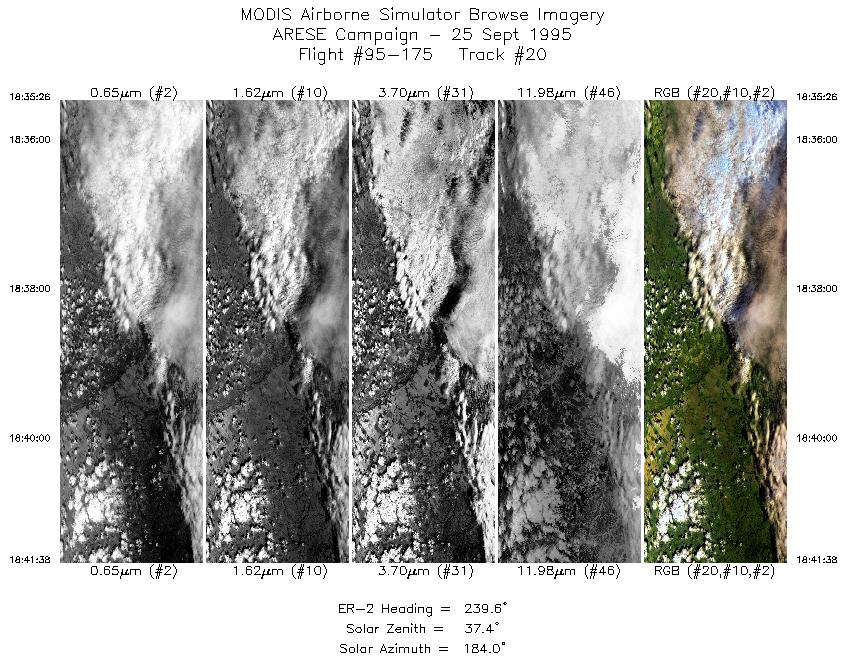
| 20 |
18:35-18:41 |
240 |
36.37-36.02 |
98.48-99.23 |
2316 |
~20000 |
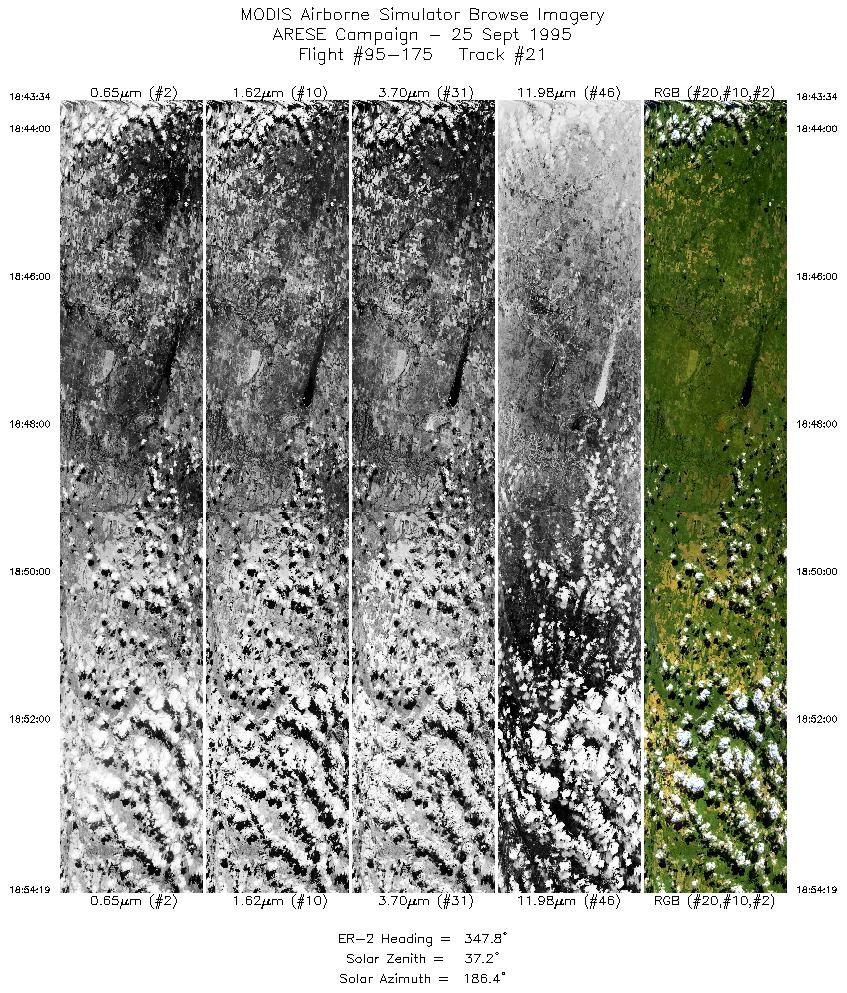
| 21 |
18:43-18:54 |
348 |
36.11-37.31 |
99.41-99.68 |
3967 |
~20000 |
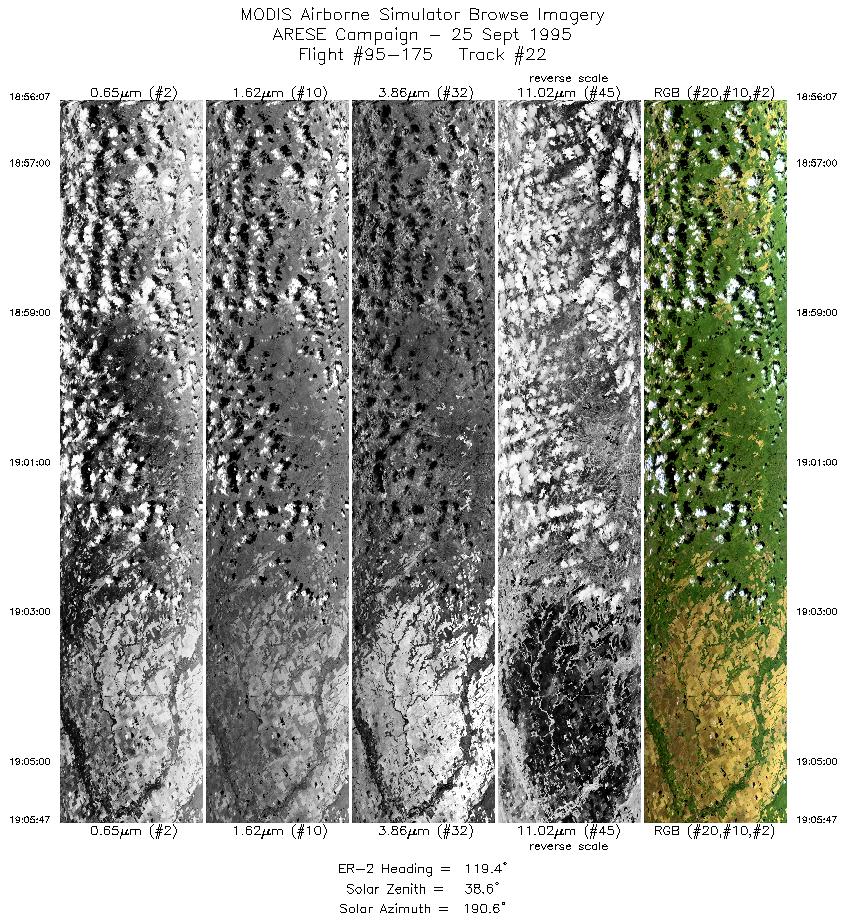
| 22 |
18:56-19:05 |
119 |
37.43-36.88 |
99.52-98.30 |
3615 |
~20000 |
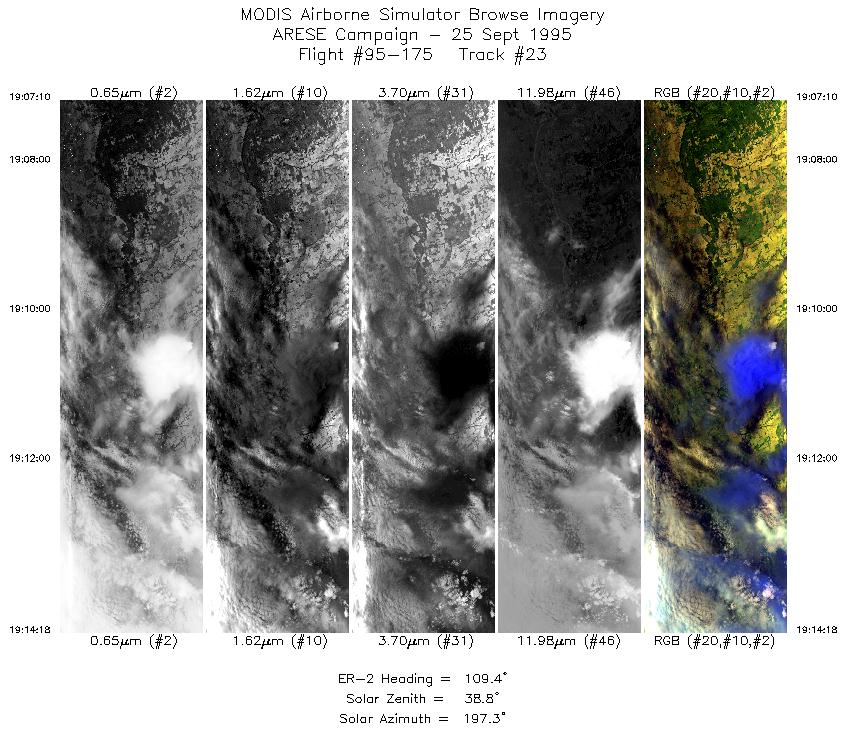
| 23 |
19:07-19:14 |
109 |
36.81-36.51 |
98.12-97.15 |
2665 |
~20000 |
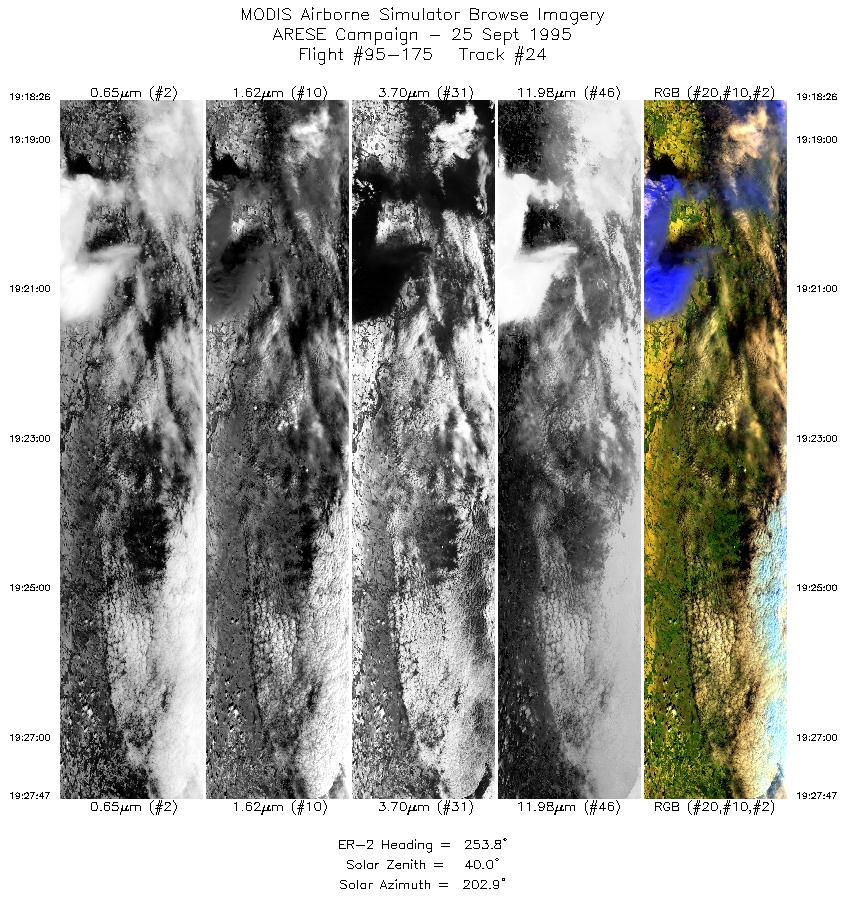
| 24 |
19:18-19:27 |
254 |
36.69-36.40 |
97.20-98.40 |
3496 |
~20000 |
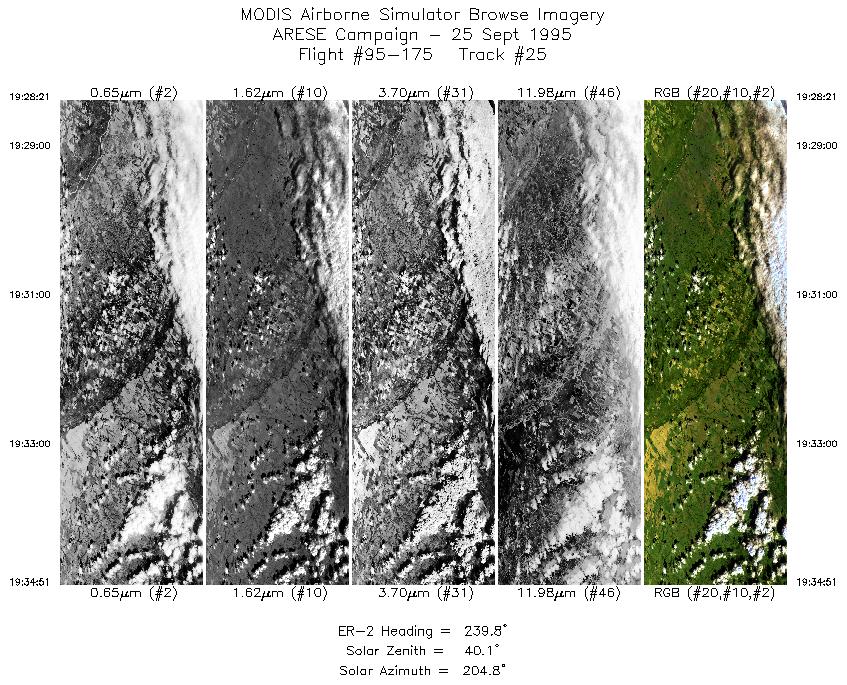
| 25 |
19:28-19:34 |
240 |
36.37-36.02 |
98.47-99.23 |
2429 |
~20000 |
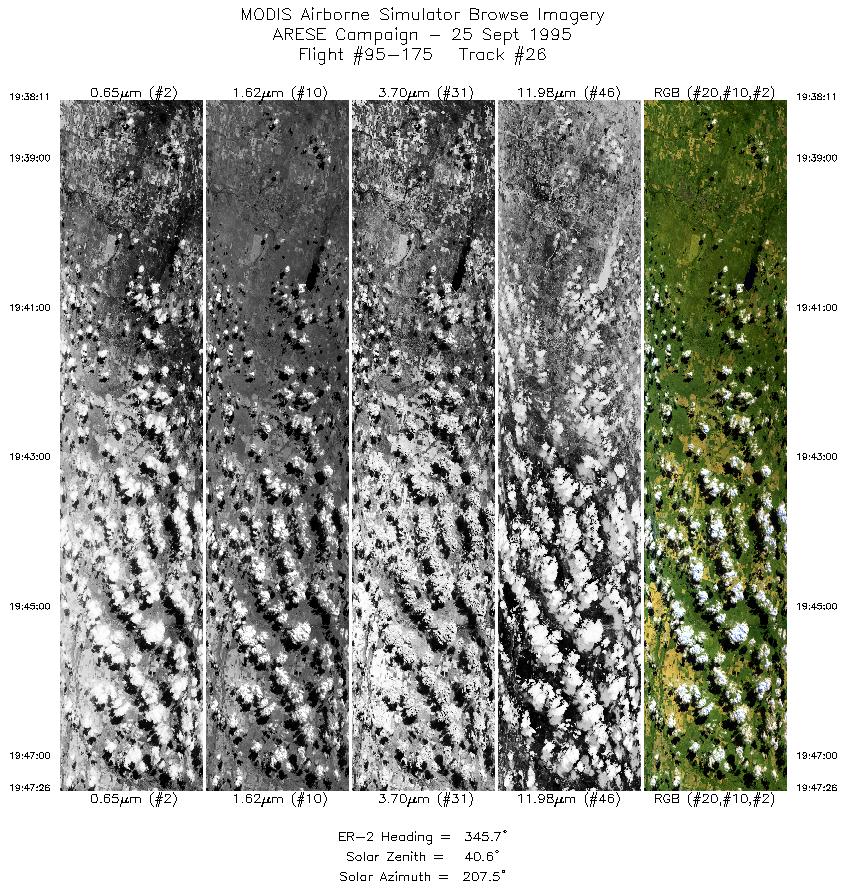
| 26 |
19:38-19:47 |
346 |
36.28-37.31 |
99.44-99.68 |
3459 |
~20000 |
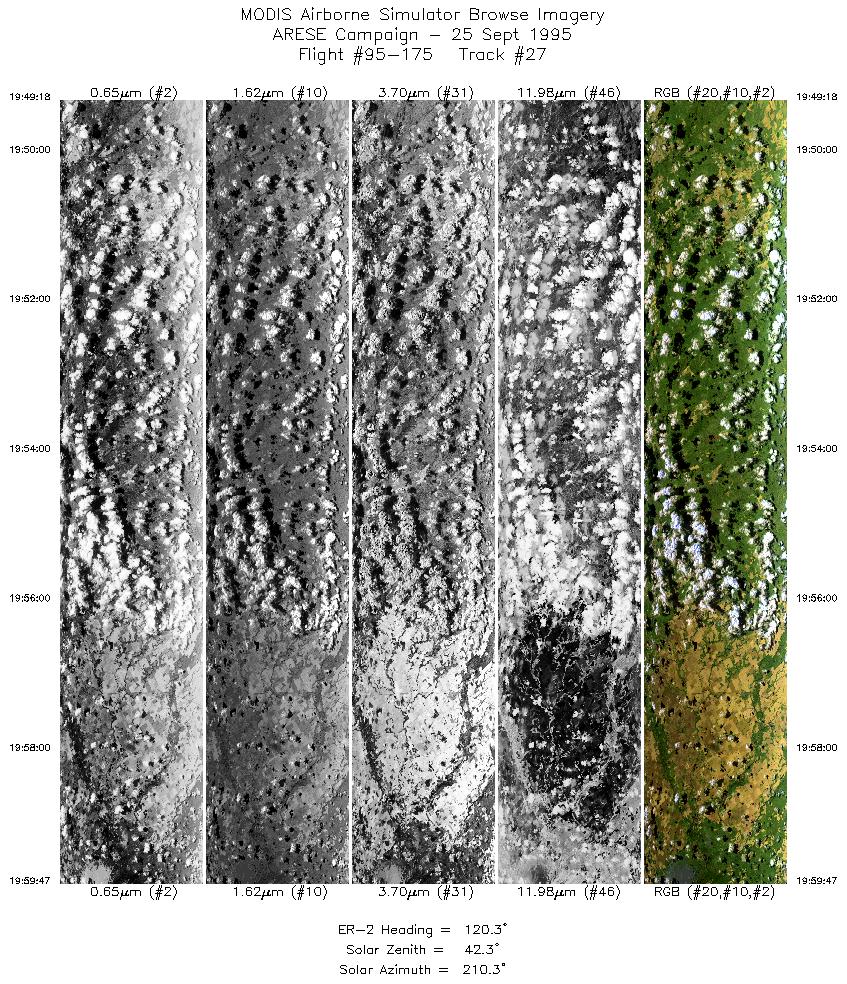
| 27 |
19:49-19:59 |
120 |
37.43-36.83 |
99.52-98.19 |
3920 |
~20000 |
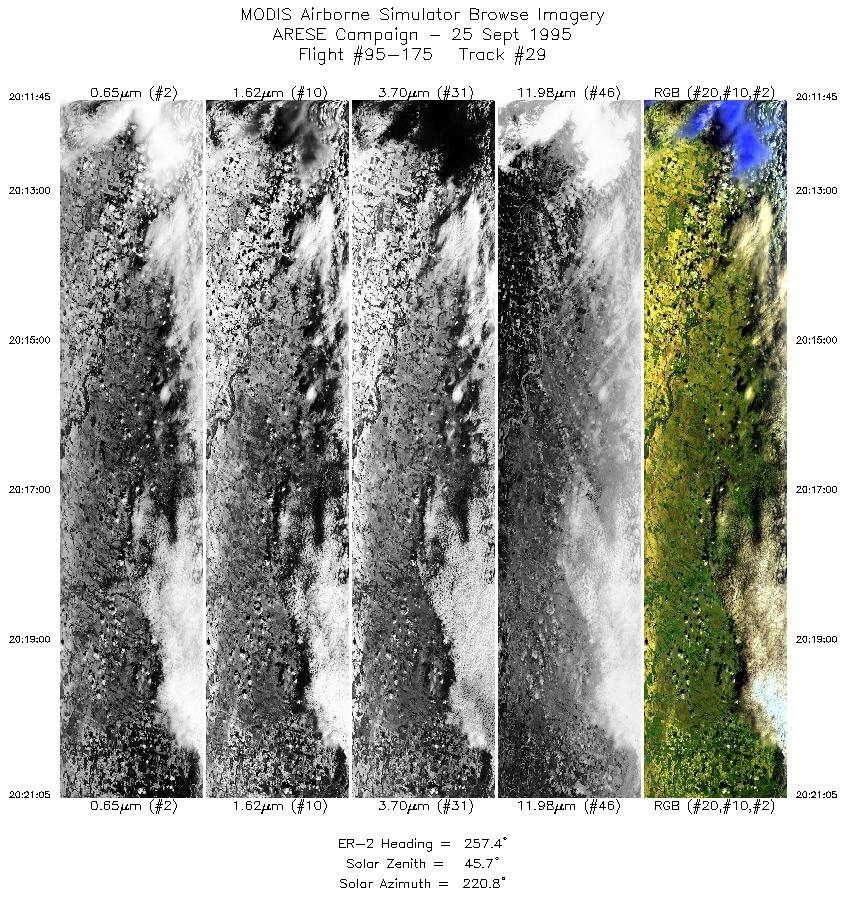
| 28 |
20:00-20:07 |
109 |
36.80-36.51 |
98.11-97.15 |
2623 |
~20000 |
| 29 |
20:11-20:21 |
257 |
36.69-36.40 |
97.19-98.40 |
3490 |
~20000 |
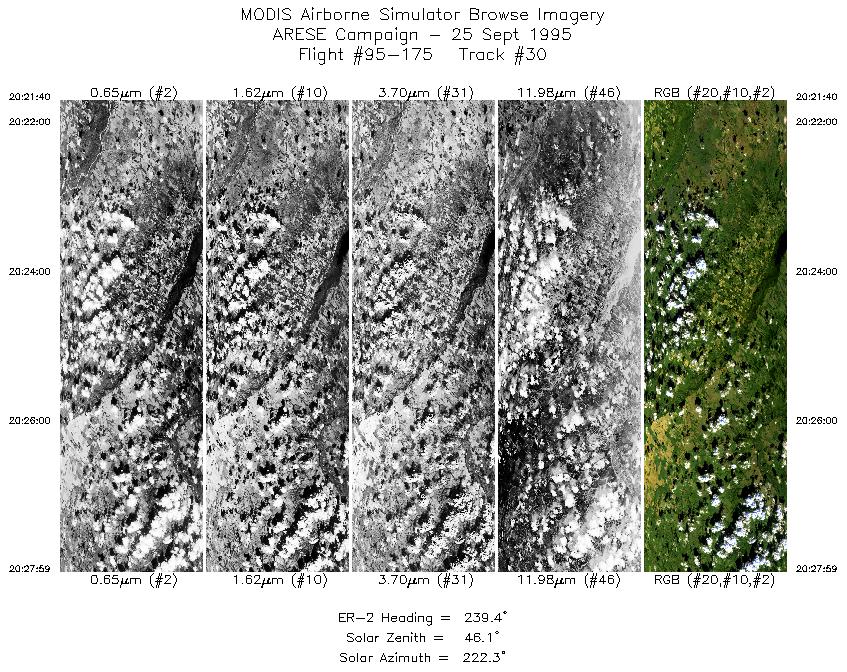
| 30 |
20:21-20:27 |
239 |
36.37-36.02 |
98.48-99.23 |
2360 |
~20000 |
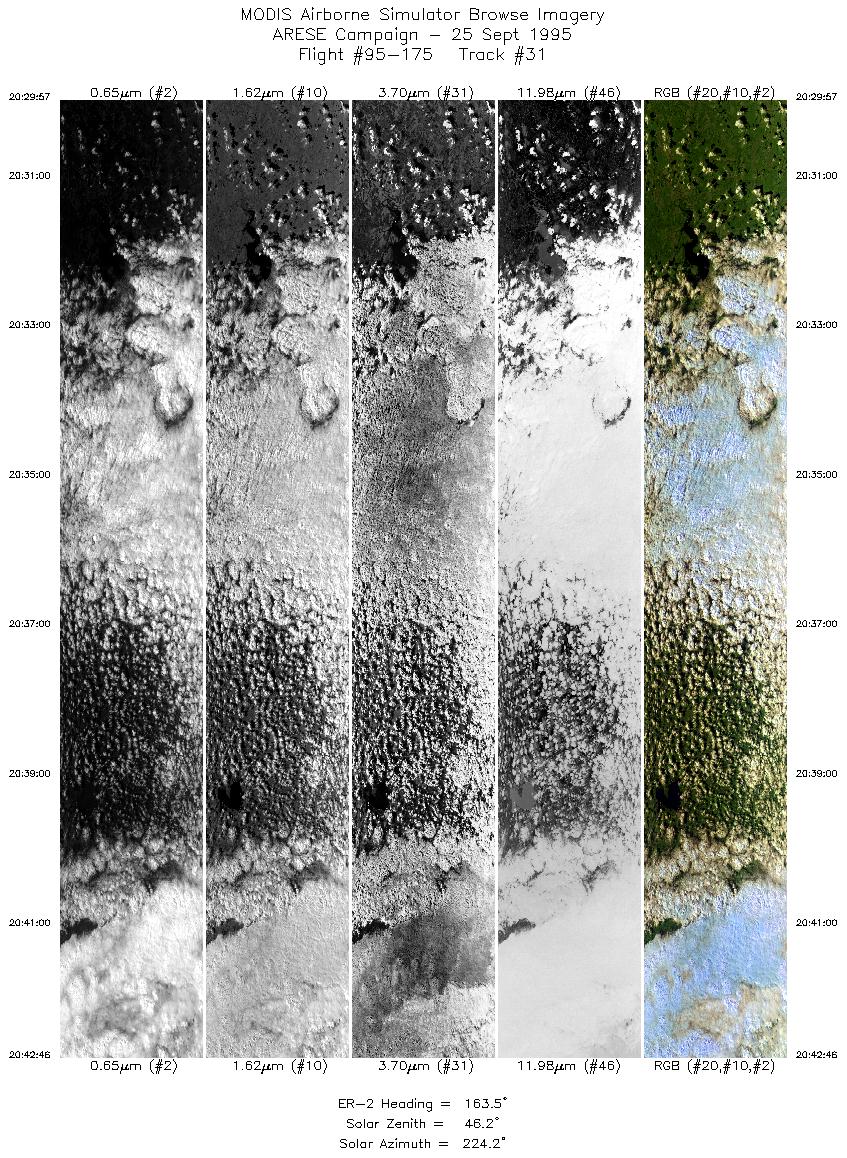
| 31 |
20:29-20:42 |
163 |
35.81-34.41 |
99.25-98.74 |
4794 |
~20000 |
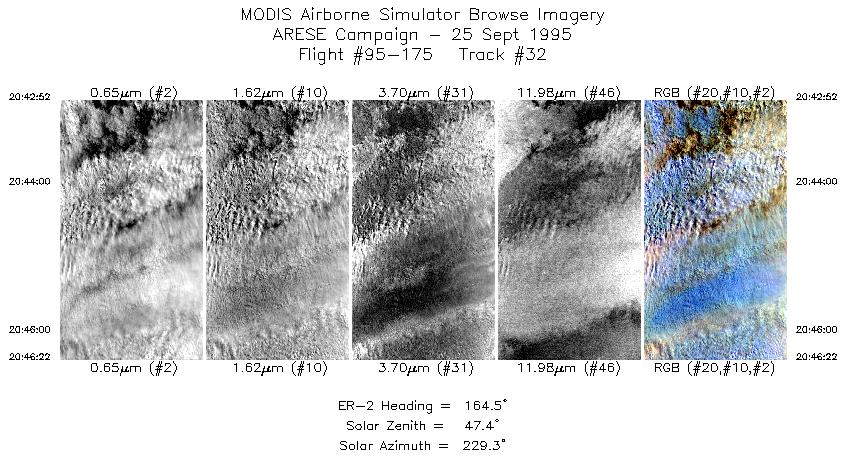
| 32 |
20:42-20:46 |
164 |
34.40-34.02 |
98.74-98.61 |
1304 |
~20000 |
| 33 |
20:46-21:01 |
170 |
34.01-32.32 |
98.60-98.18 |
5563 |
~20000 |
| 34 |
21:01-21:04 |
181 |
32.26-31.93 |
98.18-98.17 |
1067 |
~20000 |
|
Images 01 through 34 in sequence |
Level-1B Data Distribution
NASA LaRC Atmospheric Sciences Data Center
|
|