
|
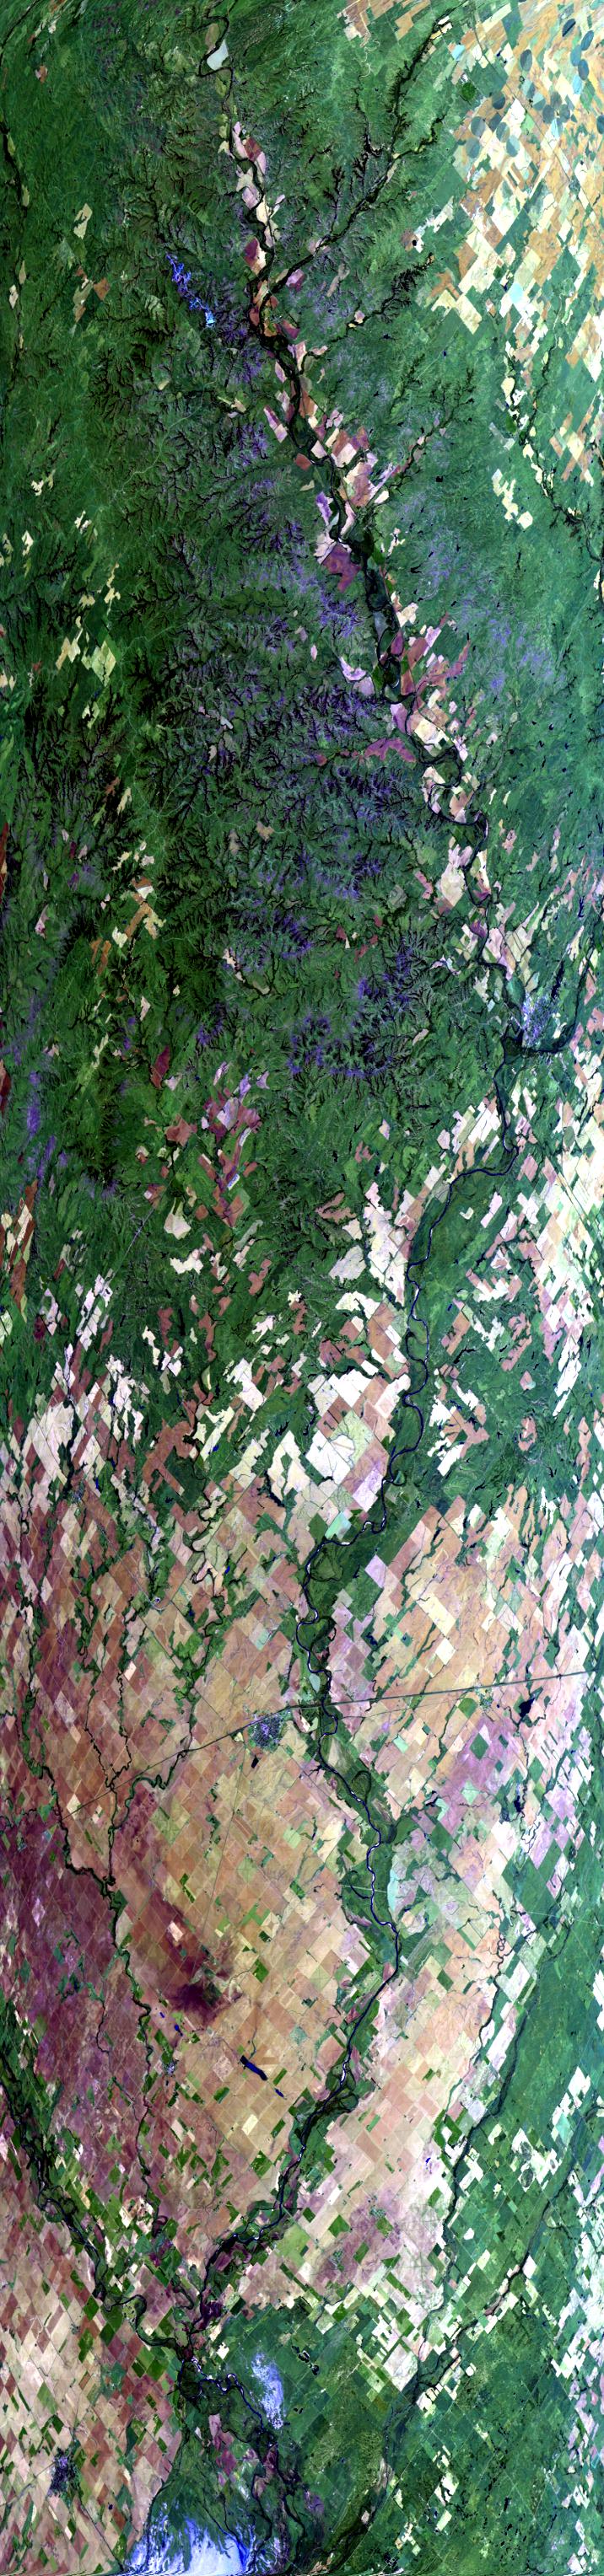
Sample Image

11 Oct 1995
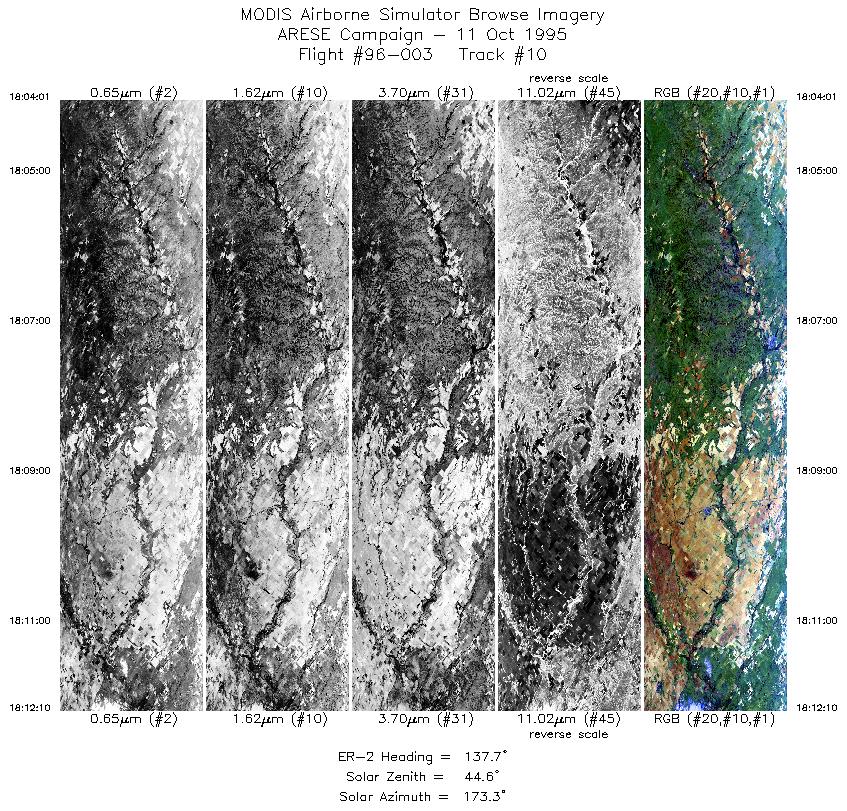
Track #10

Flightline begins southwest of Pratt, Kansas, in the headwaters of the Salt Fork Arkansas River. Follows the Salt Fork south into Oklahoma, near Alva.
R: 2.14 microns
G: 1.62 microns
B: 0.55 microns
|
|
Mission Summary
Date: October 11, 1995
ER-2 Flight Number: 96-003
Flight Location: Oklahoma
Principal Investigator: Dr. Francisco Valero (Scripps)
Additional Sensors: RAMS, CLS, VIS
Objective: Investigate the absorption of solar radiation by clouds, aerosols, and atmospheric gases.
Level-1B Processing Information
Level-1B Data processed by: Ames Research Center
Level-1B Data Version: #09
Level-1B Configuration: (sample file)
Calibration Type: Final
Calibration Version: ARESE 1.0
Temperature Adjustment: 35C
Status: Completed with final calibration
|
|
Flight Track Map

|
Level-1B Browse Imagery
Straight Line Flight Tracks: 23
Scanlines Processed: 65682
Solar Azimuth and Zenith Angles
|
Browse Images
|
Click on the Flight Track number to load images.
Lat/Lon ranges are for the BEG-END scanline nadir pixels.
|
Flight
Track |
Time_Span
(GMT) |
Heading
(Deg) |
Lat_Range
(Deg_N) |
Lon_Range
(Deg_W) |
Length
(Scanlines) |
Altitude
(Meters) |
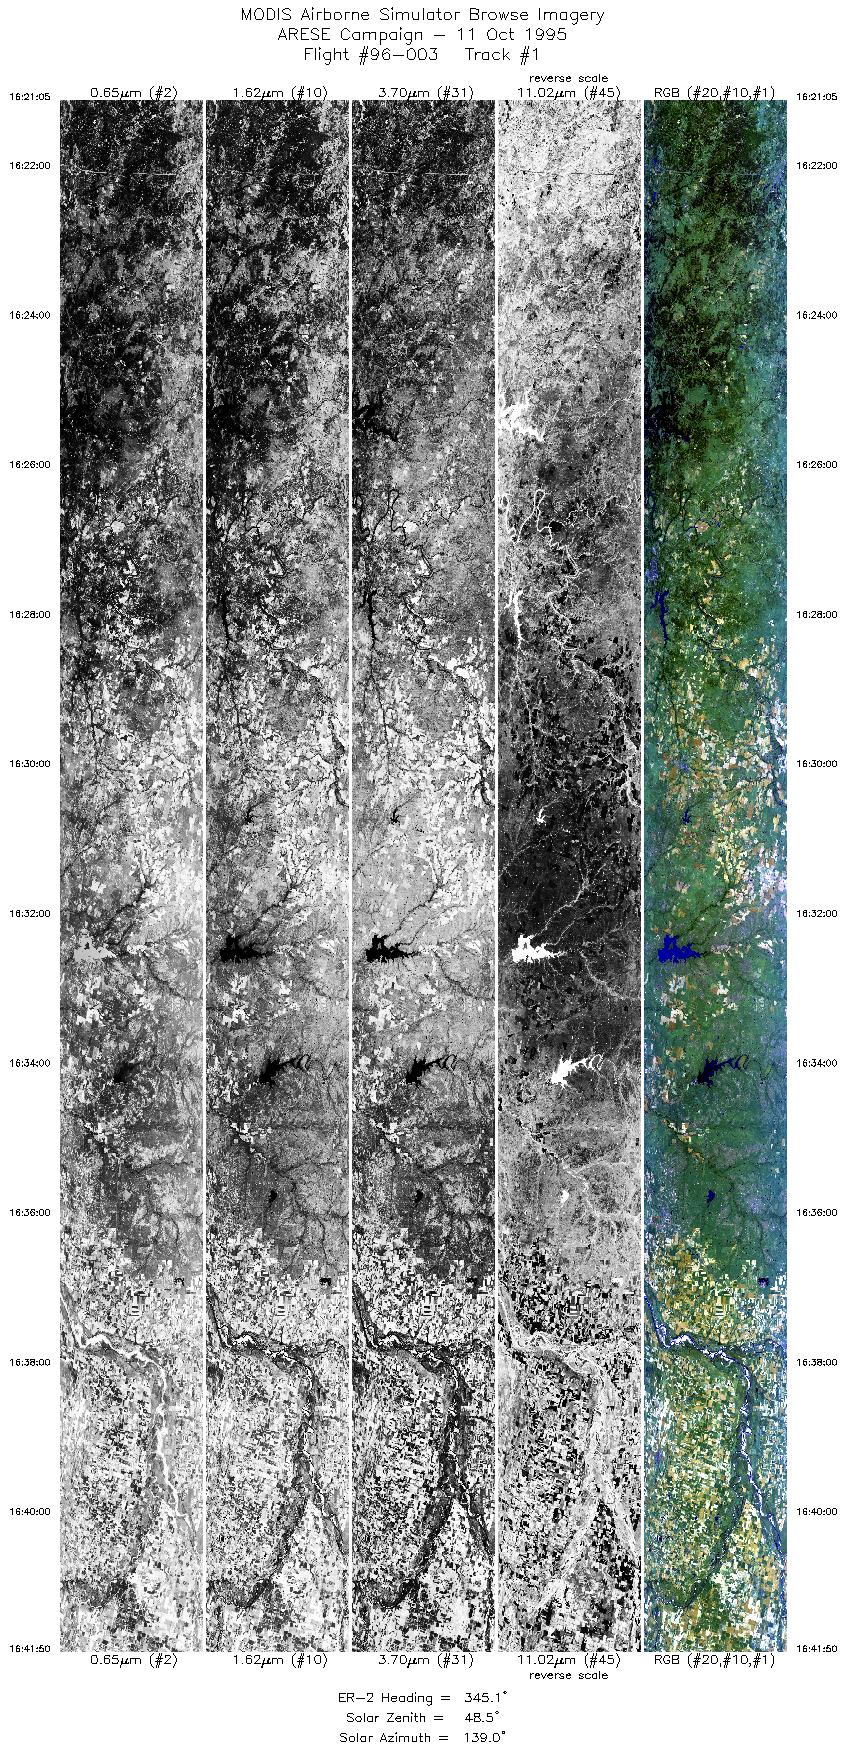
| 1 |
16:21-16:41 |
345 |
32.38-34.63 |
98.51-99.26 |
7763 |
~20000 |
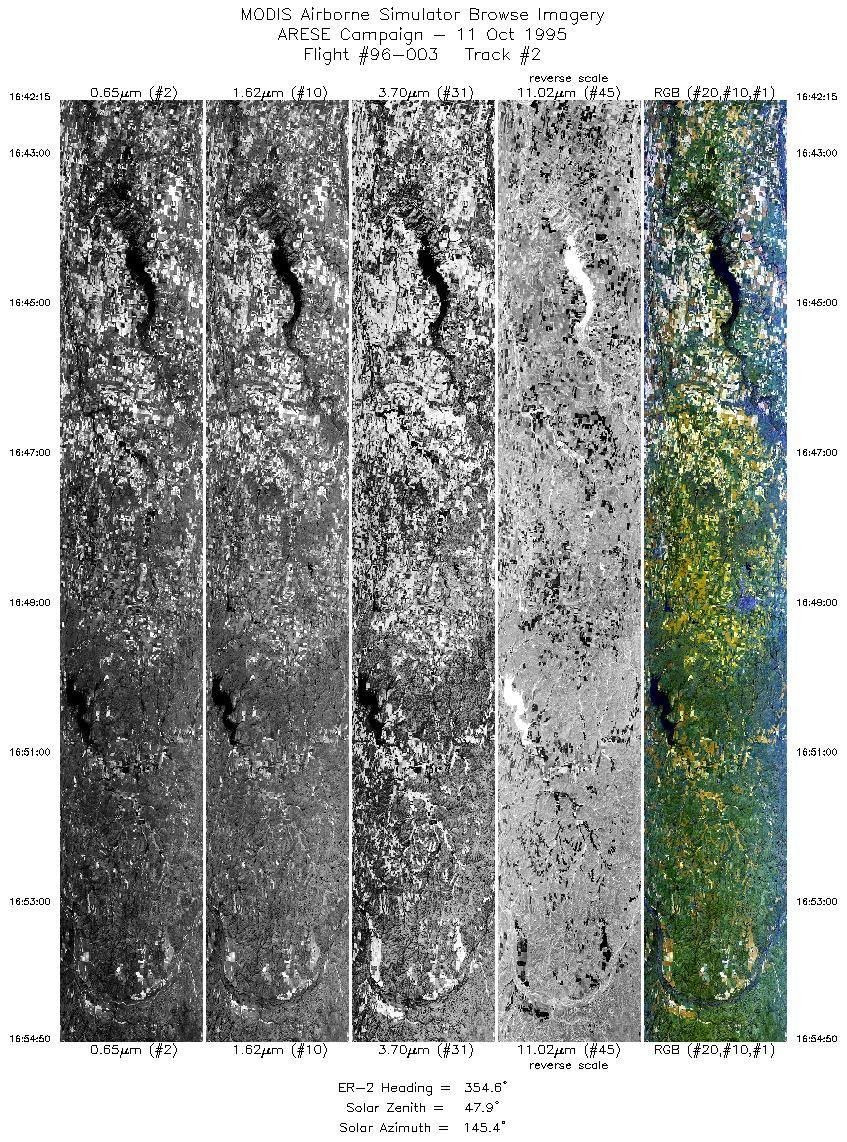
| 2 |
16:42-16:54 |
355 |
34.67-36.06 |
99.27-99.43 |
4713 |
~20000 |
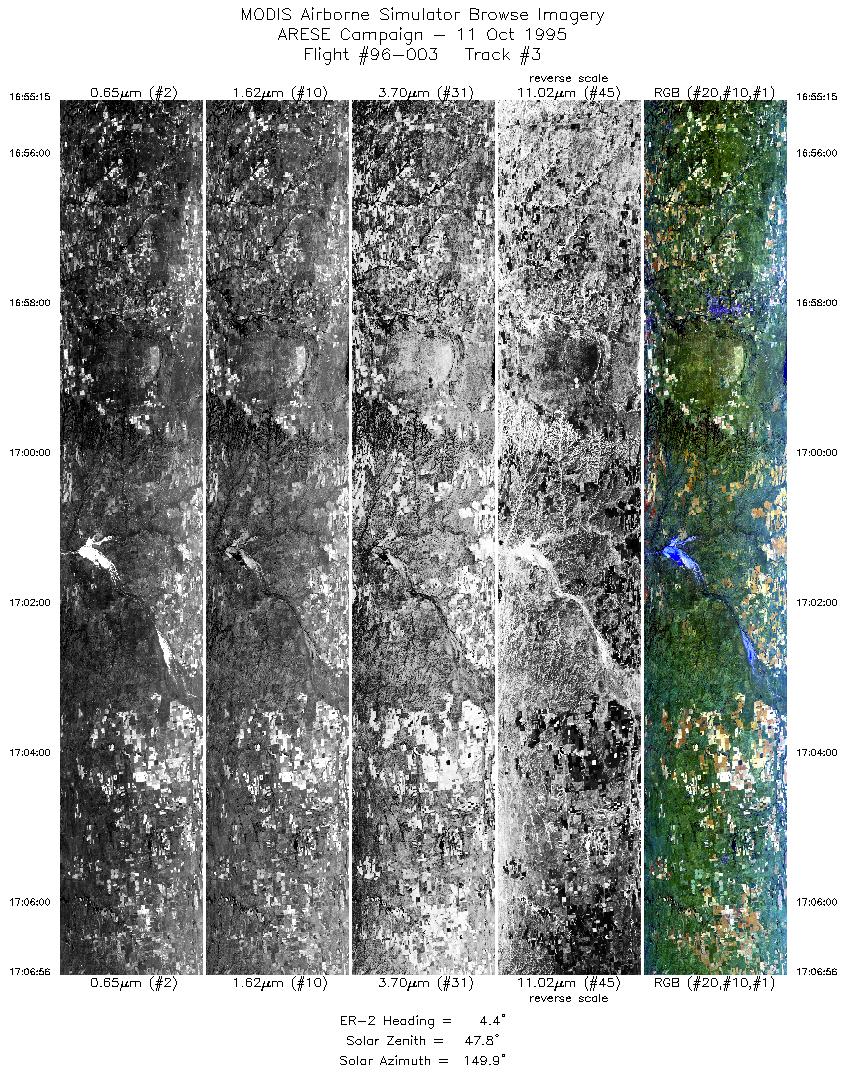
| 3 |
16:55-17:06 |
4 |
36.11-37.44 |
99.43-99.30 |
4379 |
~20000 |
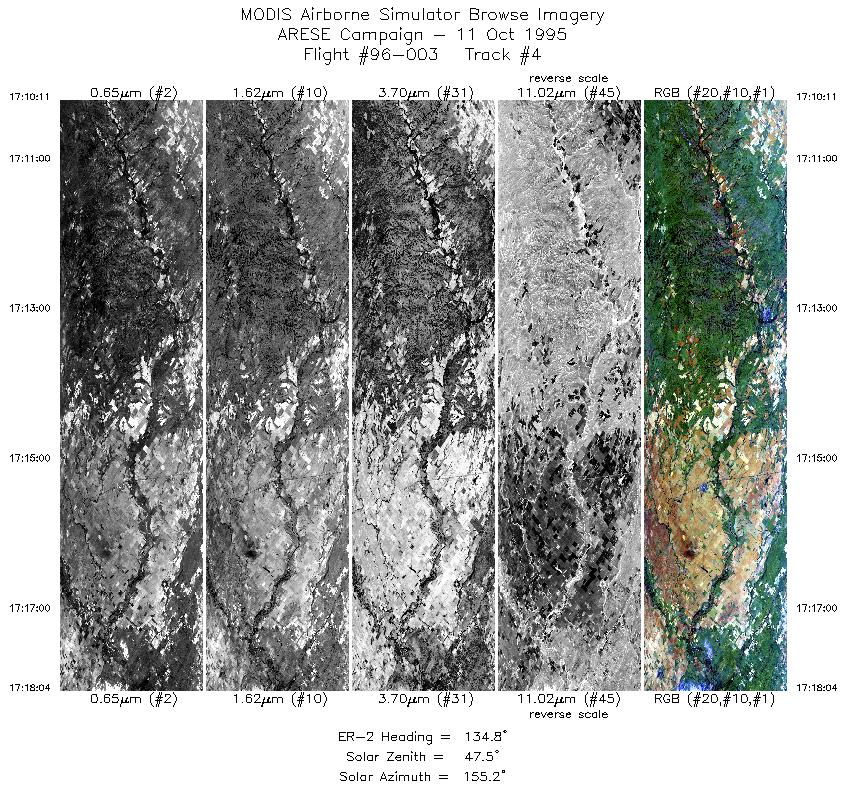
| 4 |
17:10-17:18 |
135 |
37.46-36.82 |
98.94-98.21 |
2956 |
~20000 |
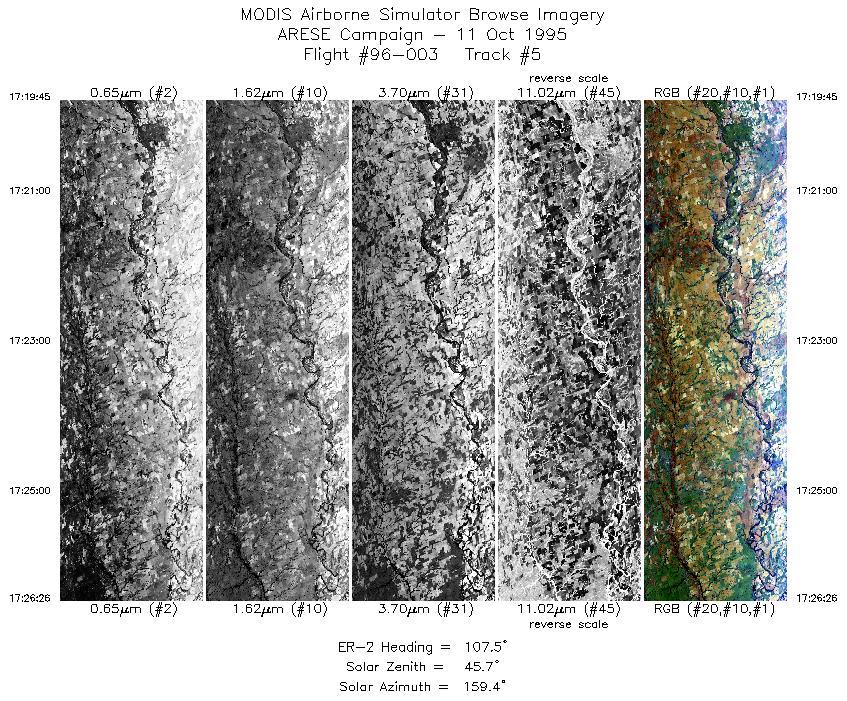
| 5 |
17:19-17:26 |
108 |
36.73-36.51 |
98.01-97.11 |
2505 |
~20000 |
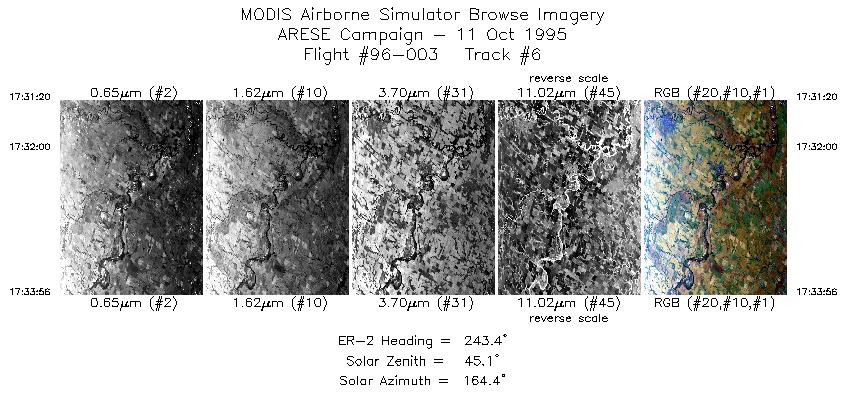
| 6 |
17:31-17:33 |
243 |
36.72-36.60 |
97.19-97.50 |
975 |
~20000 |
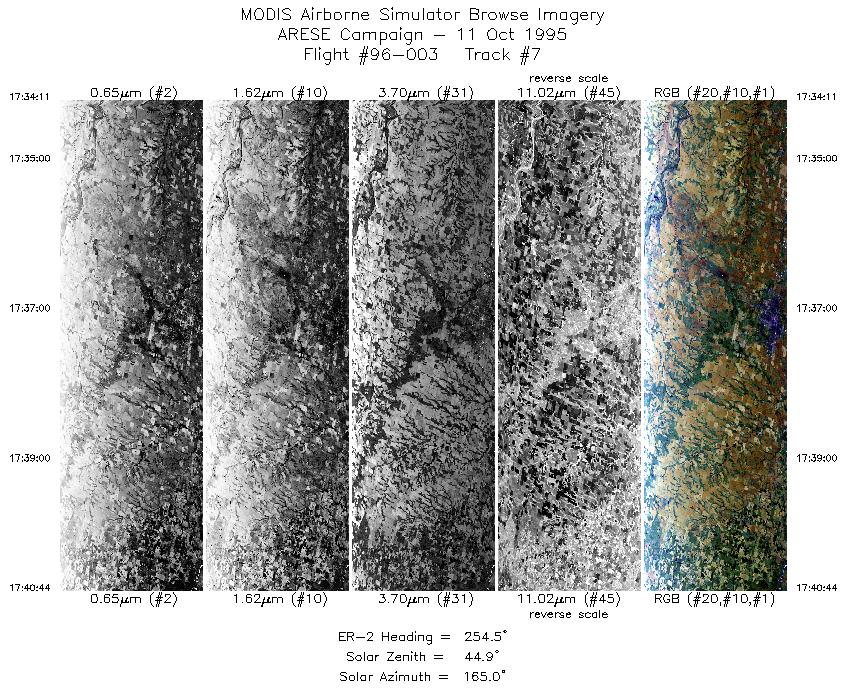
| 7 |
17:34-17:40 |
254 |
36.59-36.40 |
97.54-98.38 |
2457 |
~20000 |
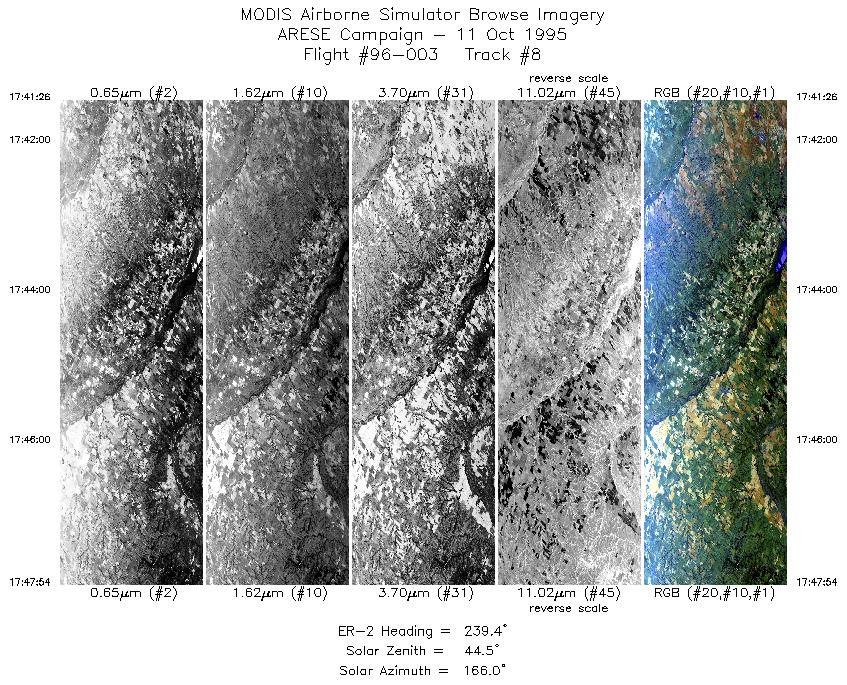
| 8 |
17:41-17:47 |
239 |
36.37-36.02 |
98.47-99.23 |
2426 |
~20000 |
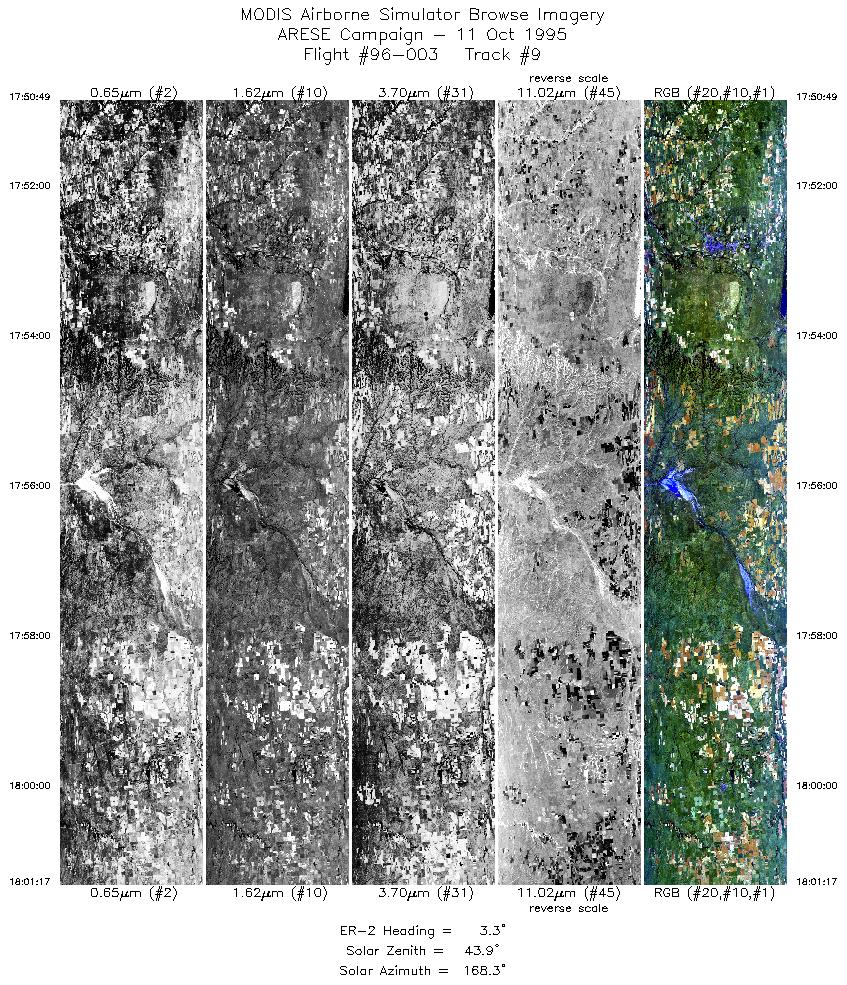
| 9 |
17:50-18:01 |
3 |
36.21-37.42 |
99.43-99.30 |
3925 |
~20000 |
| 10 |
18:04-18:12 |
138 |
37.48-36.82 |
99.00-98.21 |
3056 |
~20000 |
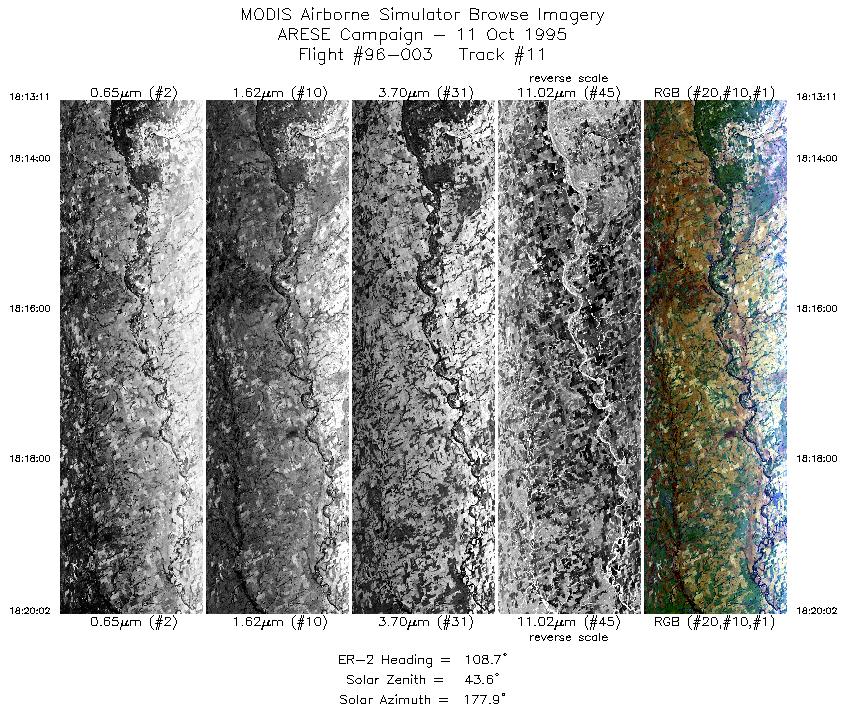
| 11 |
18:13-18:20 |
109 |
36.76-36.51 |
98.08-97.15 |
2570 |
~20000 |
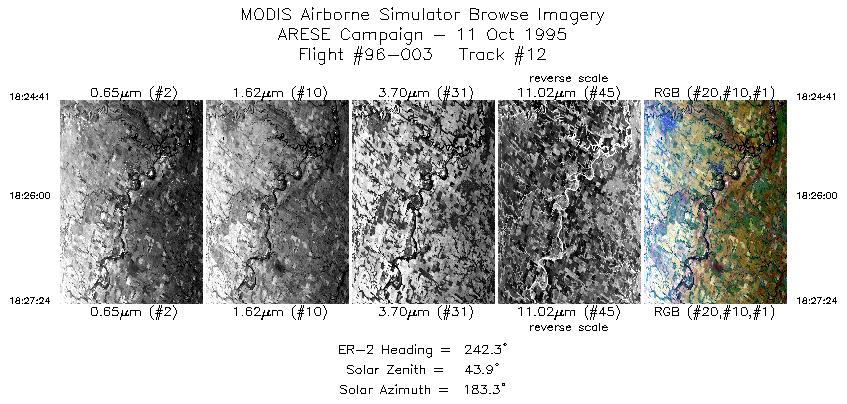
| 12 |
18:24-18:27 |
242 |
36.72-36.59 |
97.19-97.52 |
1020 |
~20000 |
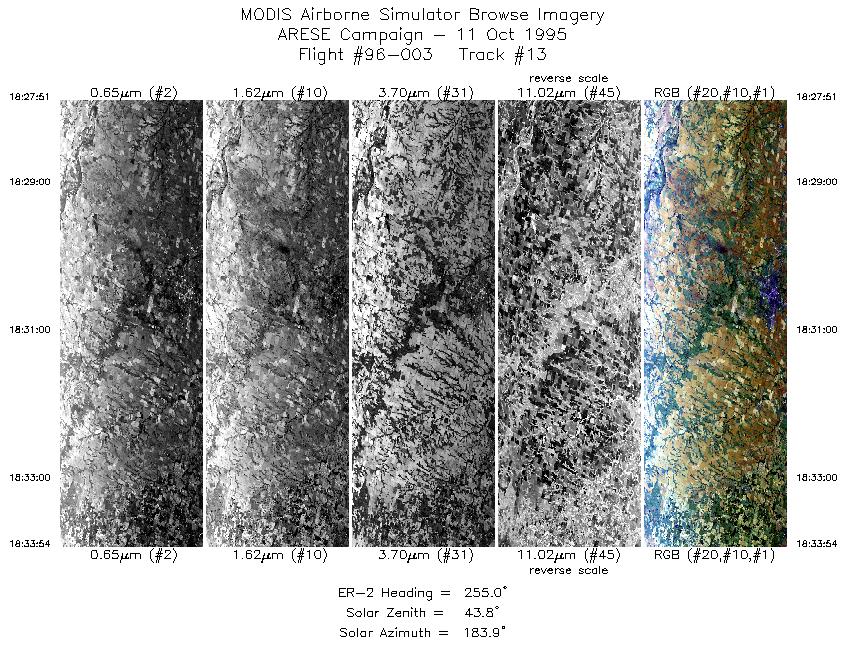
| 13 |
18:27-18:33 |
255 |
36.58-36.41 |
97.57-98.36 |
2235 |
~20000 |
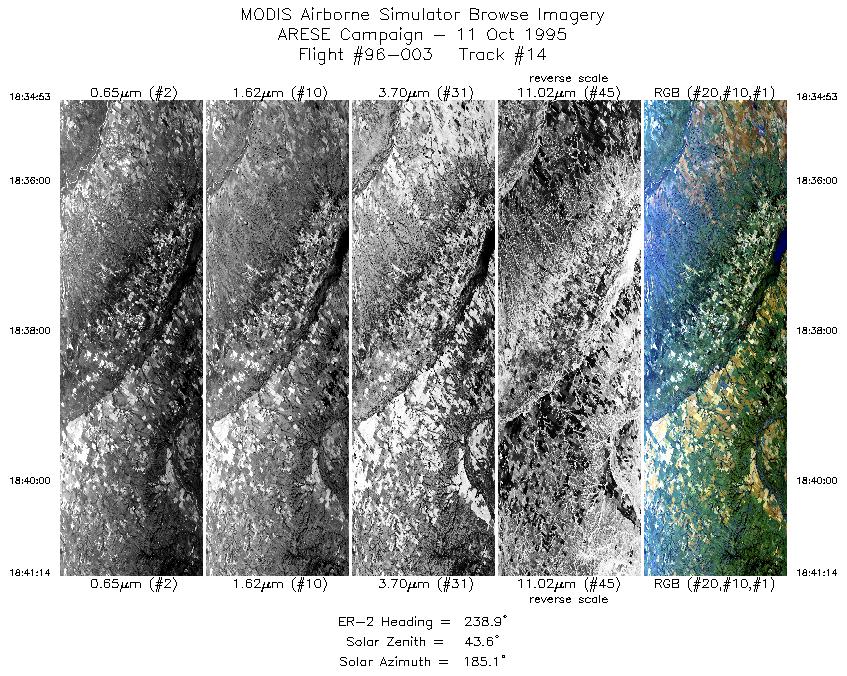
| 14 |
18:34-18:41 |
239 |
36.36-36.02 |
98.48-99.22 |
2382 |
~20000 |
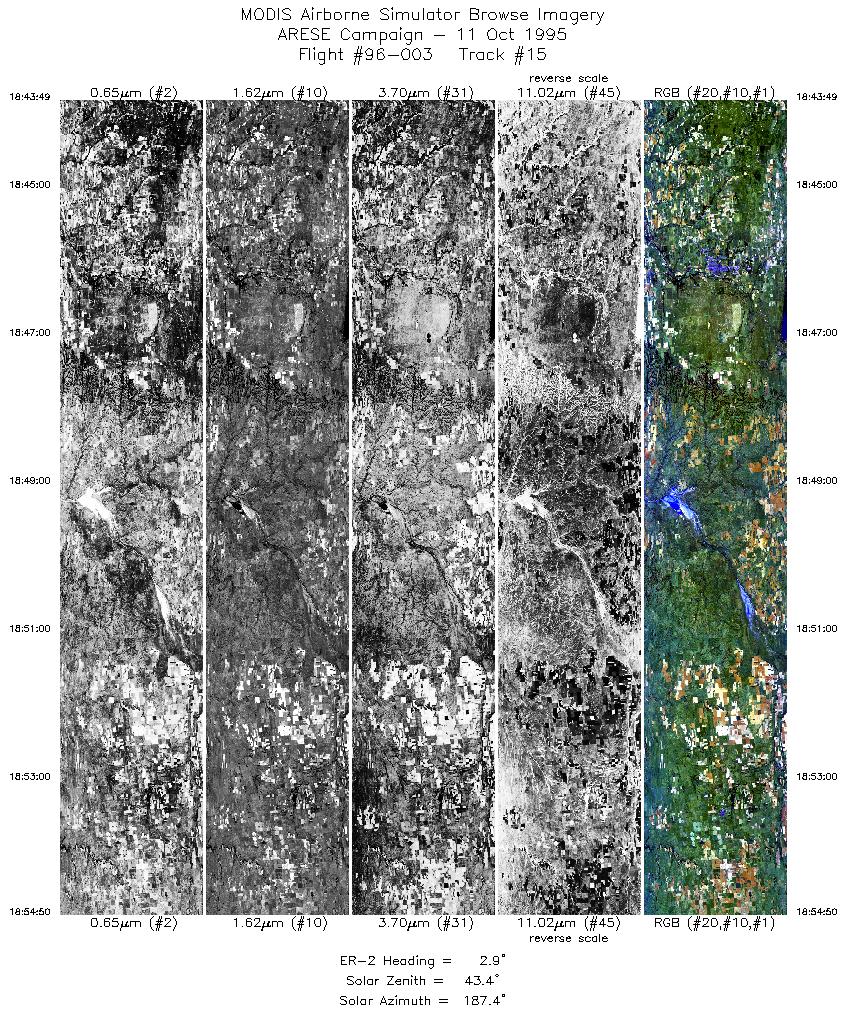
| 15 |
18:43-18:54 |
3 |
36.17-37.42 |
99.43-99.30 |
4077 |
~20000 |
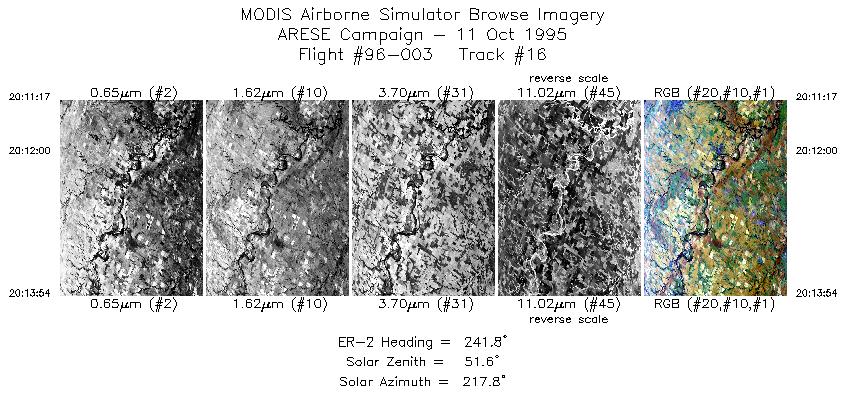
| 16 |
20:11-20:13 |
242 |
36.72-36.58 |
97.22-97.55 |
982 |
~20000 |
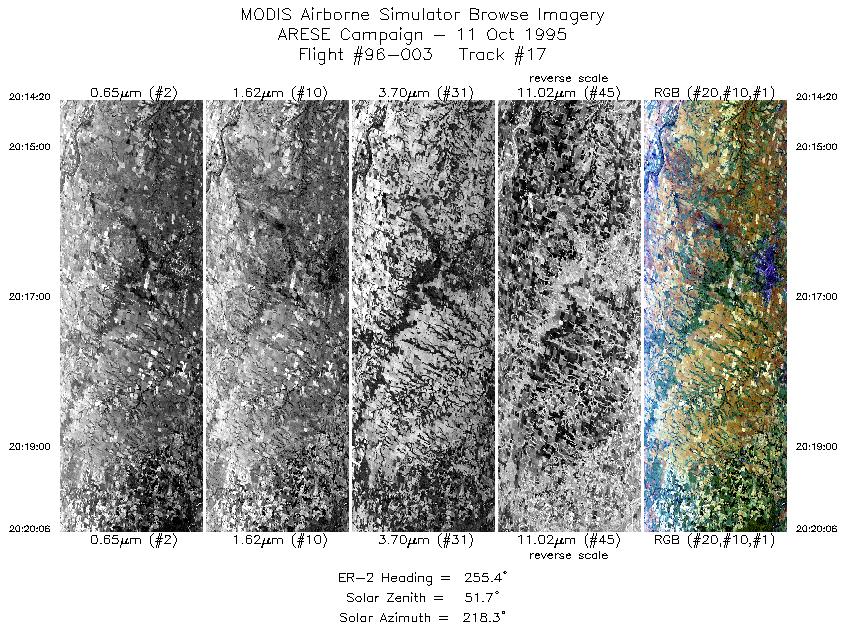
| 17 |
20:14-20:20 |
255 |
36.56-36.40 |
97.61-98.39 |
2163 |
~20000 |
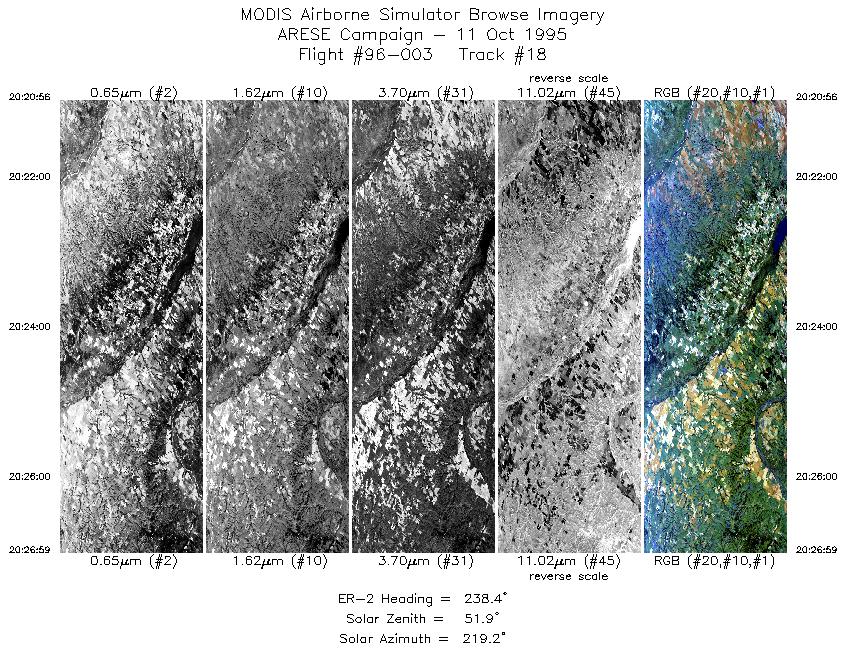
| 18 |
20:20-20:26 |
238 |
36.36-36.02 |
98.49-99.22 |
2269 |
~20000 |
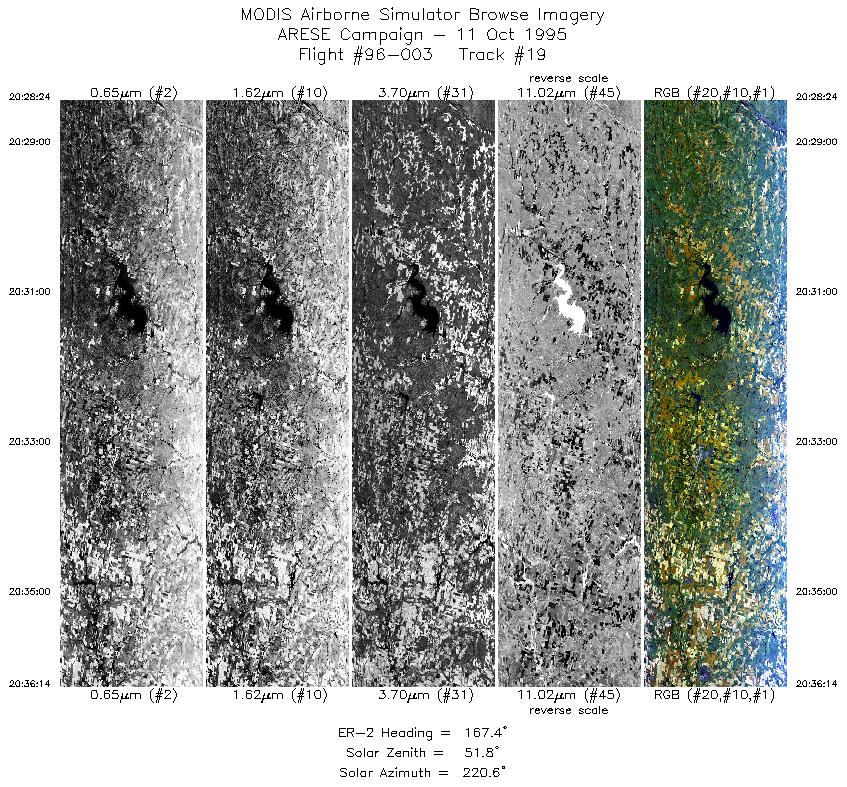
| 19 |
20:28-20:36 |
167 |
35.88-35.02 |
99.30-99.06 |
2936 |
~20000 |
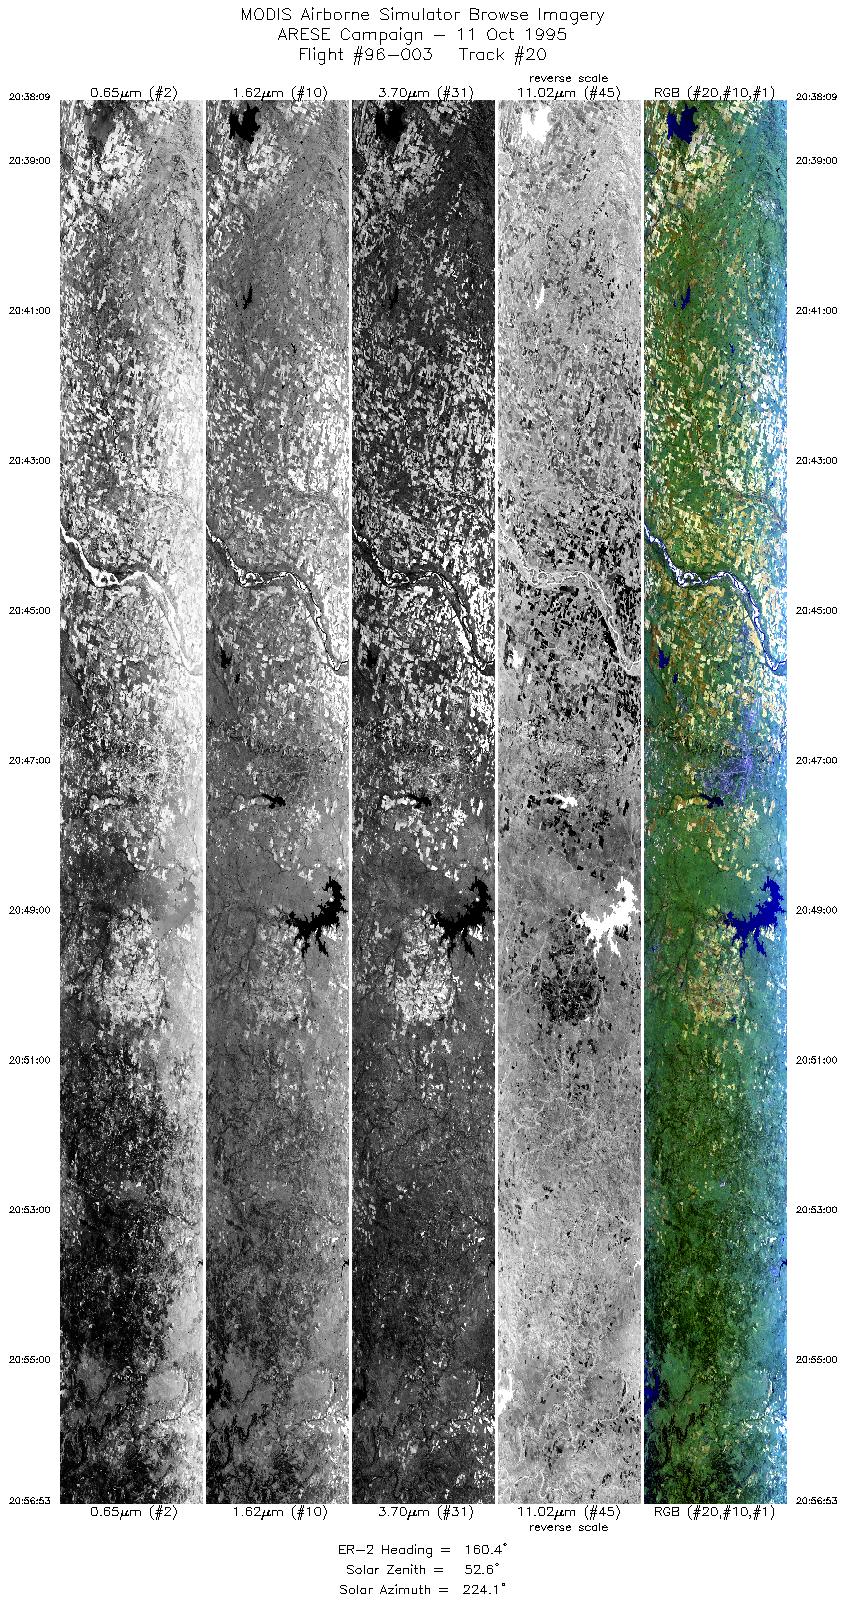
| 20 |
20:38-20:56 |
160 |
34.83-32.86 |
98.91-98.18 |
7023 |
~20000 |
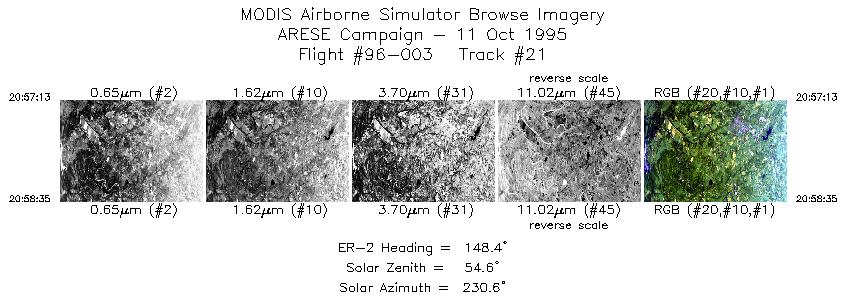
| 21 |
20:57-20:58 |
148 |
32.82-32.69 |
98.17-98.08 |
513 |
~20000 |
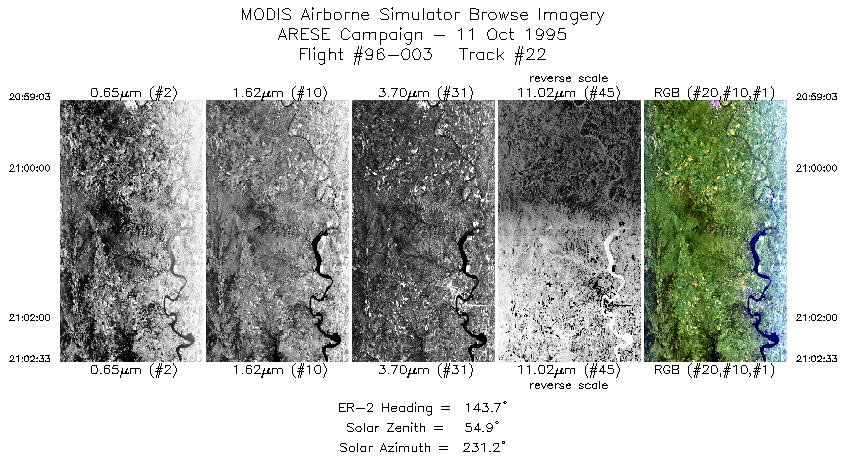
| 22 |
20:59-21:02 |
144 |
32.65-32.32 |
98.05-97.79 |
1313 |
~20000 |
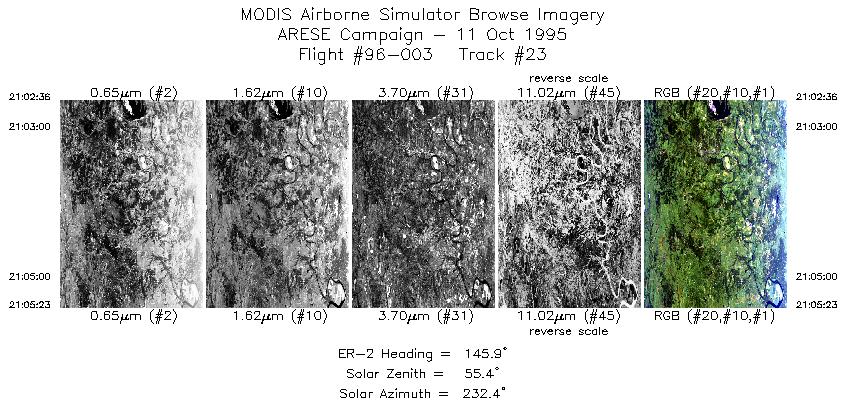
| 23 |
21:02-21:05 |
146 |
32.32-32.06 |
97.78-97.58 |
1044 |
~20000 |
|
Images 01 through 23 in sequence |
Level-1B Data Distribution
NASA LaRC Atmospheric Sciences Data Center
|
|