


MODIS Airborne Simulator (MAS)
CAMPAIGN SUMMARY INFORMATION
|
Winter Experiment Dates: 15 March - 04 April 1999 Location: Northern Midwest, Great Lakes, & Canada Principal Investigators: Dr. Chris Moeller (UWisc) Additional Sensors: Camera (RC-10), NAST-I, NAST-M, & S-HIS Objective: Objective: There are two major objectives in this campaign. First, to validate atmospheric soundings observed across polar frontal systems. Second, WINTEX will test the ability of the imaging and sounding sensors to detect the geometrical and optical properties of clouds, which are particularly difficult to detect over snow and ice surfaces. |
||||||||||||||||||||||||||||
|
Processing Information Flights Processed: 10 of 10 Total Flight Tracks: Total Scanlines: Level-1B Version: #1 Calibration Type: Final Calibration Version: WINTEX Mar-99 0.1 Temperature Adjustment: None Status: Level-1B Data in HDF format is available. Noted Irregularities |
||||||||||||||||||||||||||||
|
Spectral Information Spectral Band Configuration Spectral Response Function Table |
||||||||||||||||||||||||||||
|
Level-1B Data Distribution Level 1 / Atmosphere Archive and Distribution System (LAADS) NASA Distributive Active Archive Centers (DAACs) |
||||||||||||||||||||||||||||
|
||||||||||||||||||||||||||||
|
Related Web Sites Official WINTEX Home Page NAST-I Home Page NAST-M Home Page S-HIS Home Page NASA Airborne Science Program |
||||||||||||||||||||||||||||
Noted Irregularities
|
||||||||||||||||||||||||||||
 Flight: 99-050
 Flight: 99-051
 Flight: 99-053
 Flight: 99-054
 Flight: 99-055
 Flight: 99-056
 Flight: 99-057
 Flight: 99-058
 Flight: 99-059
 Flight: 99-060
WINTEX


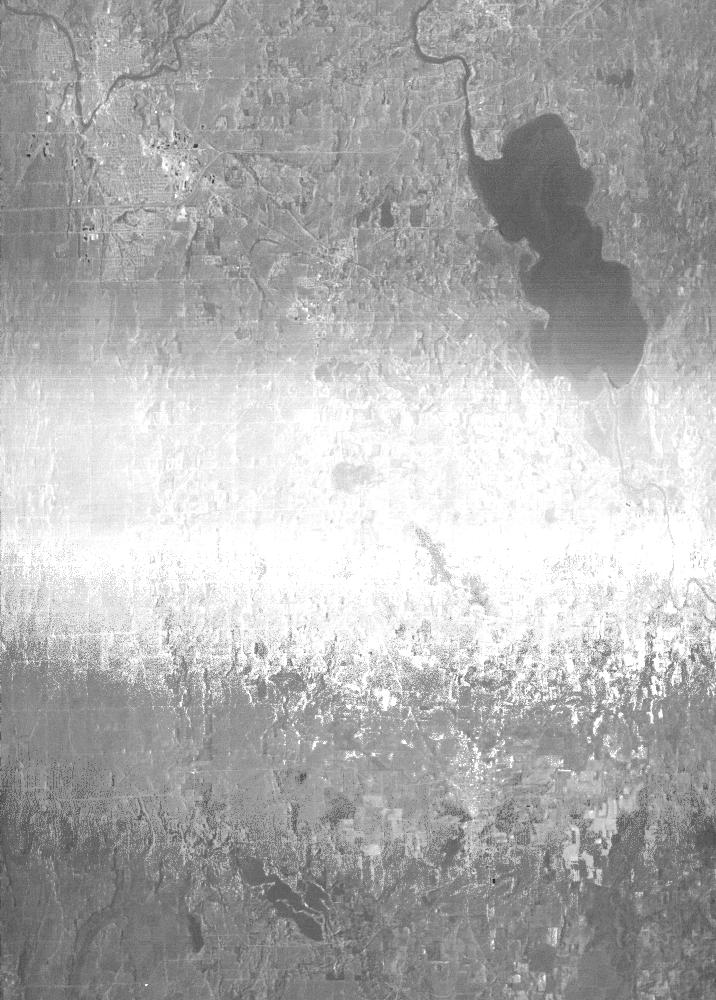
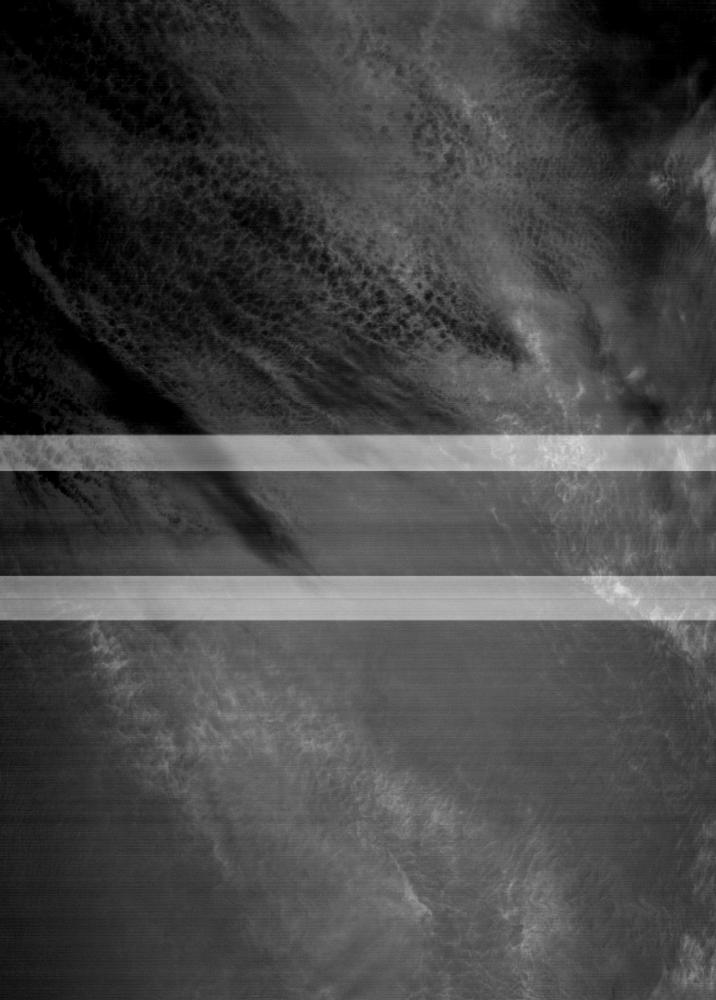
| Sample Imagery |
| Click image for full resolution |
|
Flight: 99-055, Track #10 Green Bay & Lake Michigan |


|
|
R: 10.10µm G: 8.30µm B: 4.95µm |
- NASA Official: Matt Fladeland
- Project Manager: James Jacobson
- Website Editor: Eric Fraim
- Last Updated: March 21, 2024


