
|
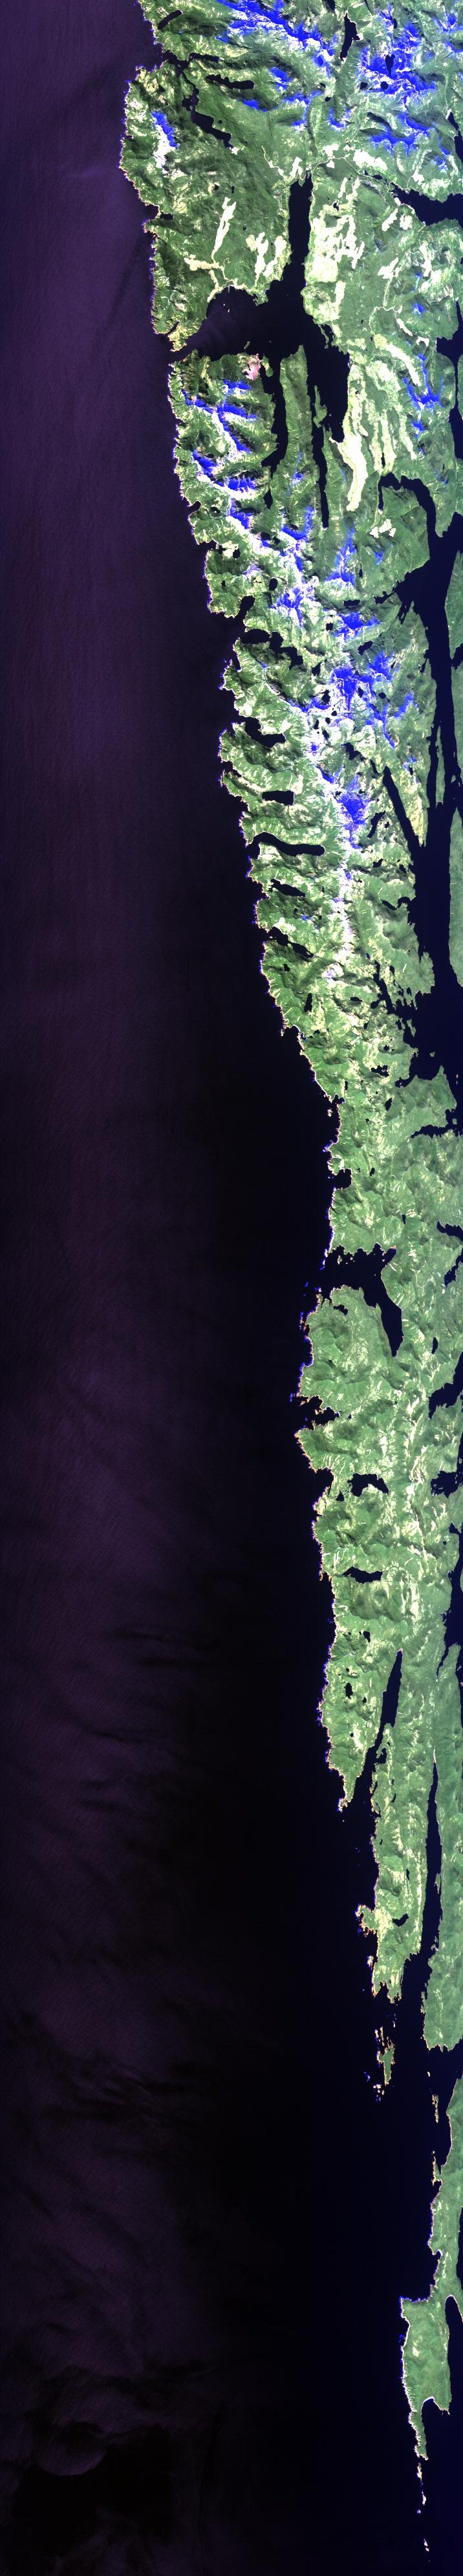
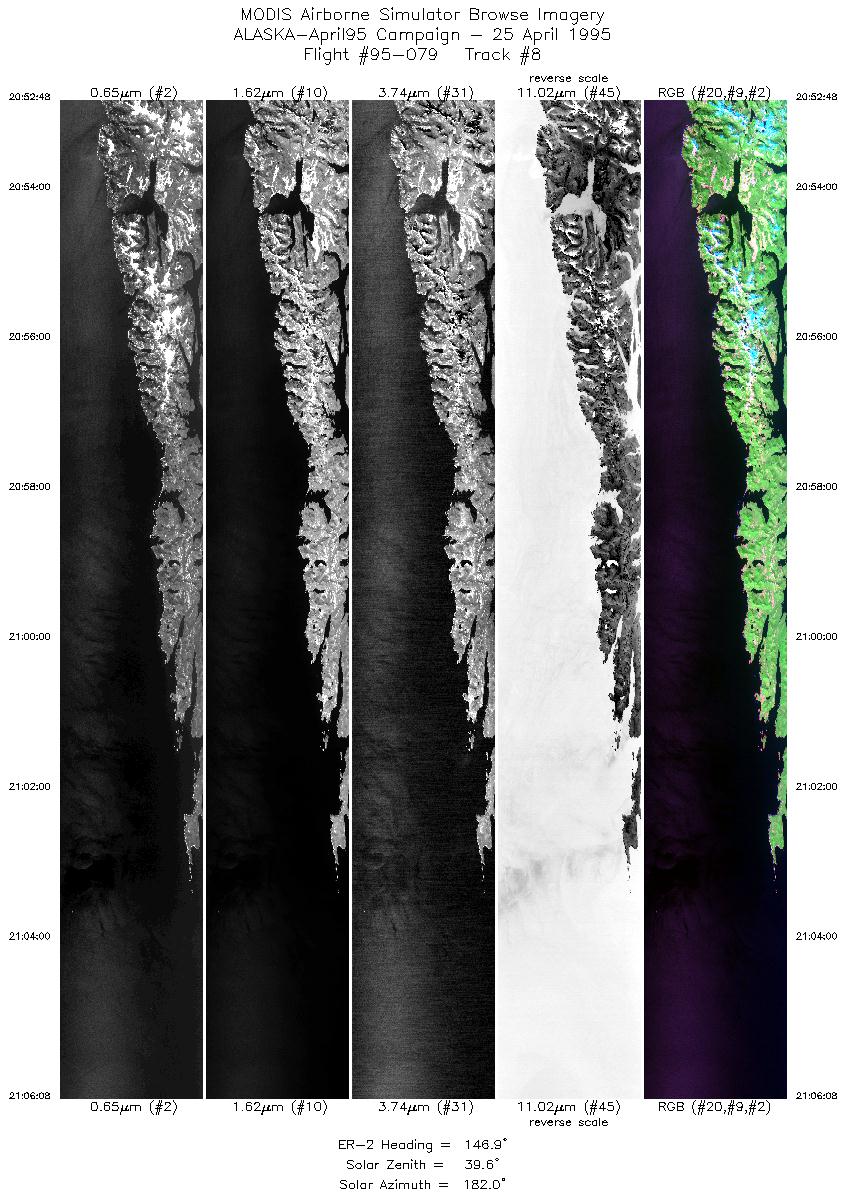
Sample Image

25 April 1995
Track #08


"Charlotte Mountains and Cape St. James
on Queen Charlotte Islands, Canada"
R: 2.14 microns
G: 0.95 microns
B: 0.65 microns
|
|
Summary Information
Date: April 25/26, 1995
ER-2 Flight Number: 95-079
Location: Alaska to California
Principle Investigator: Dr. Dorothy Hall (NASA GSFC)
Additional Sensors: MIR
Level-1B Processing Information
Level-1B Data Version: #09
Calibration Type: Final
Calibration Version: ALASKA_King 1.0
Temperature Adjustment: Yes (36C)
Status: Done!
|
|
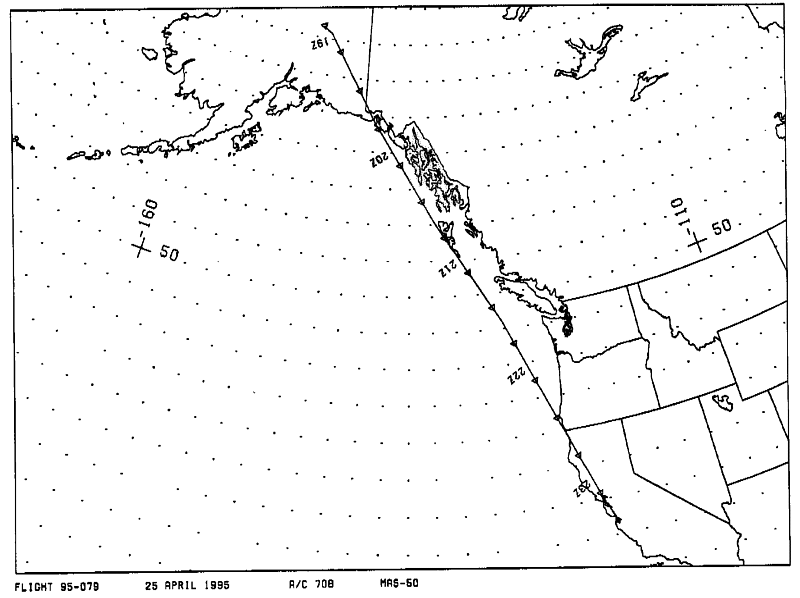
Flight Track Map

|
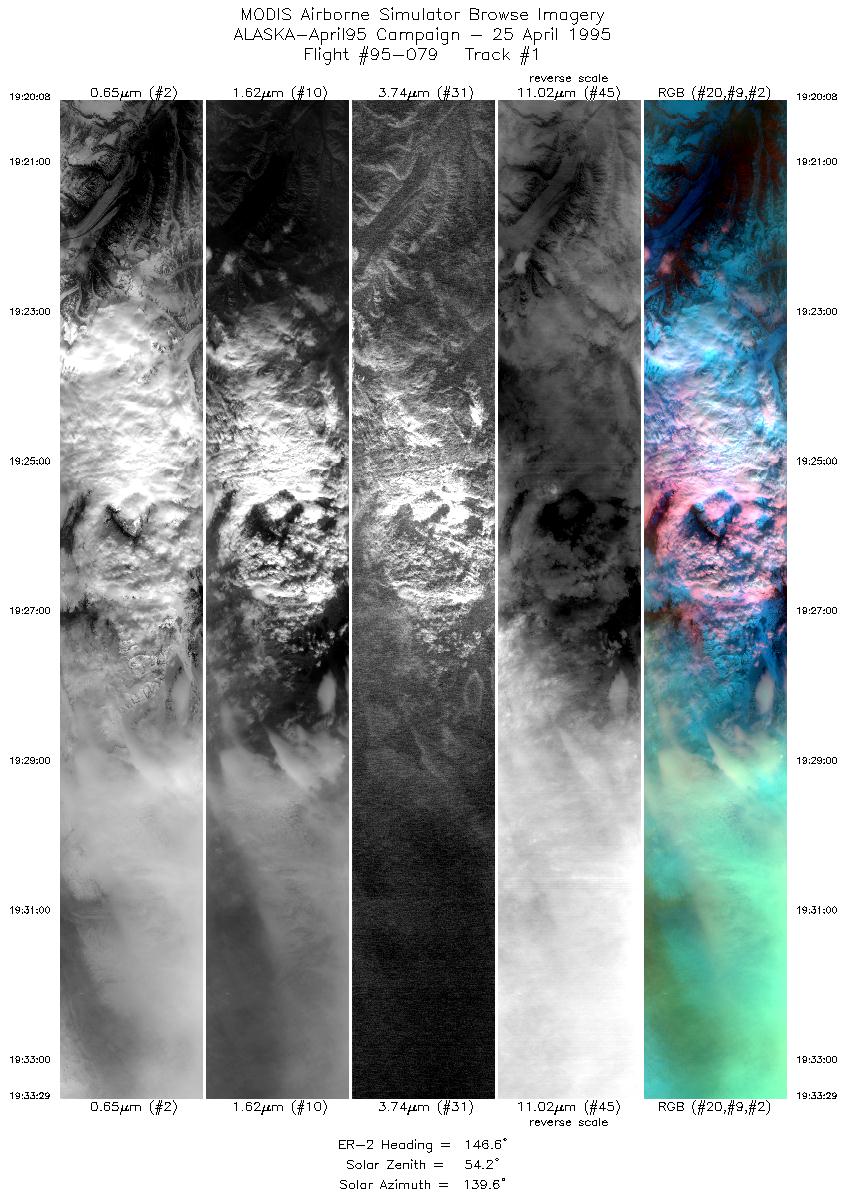
Level-1B Browse Imagery
Straight Line Flight Tracks: 18
Scanlines Processed: 85636
Solar Azimuth and Zenith Angles
|
Browse Images
|
Click on the Flight Track number to load images.
Lat/Lon ranges are for the BEG-END scanline nadir pixels.
|
Flight
Track |
Time_Span
(GMT) |
Heading
(Deg) |
Lat_Range
(Deg_N) |
Lon_Range
(Deg_W) |
Length
(Scanlines) |
Altitude
(Meters) |
| 1 |
19:20-19:33 |
147 |
62.26-60.91 |
142.99-141.27 |
4997 |
~20000 |
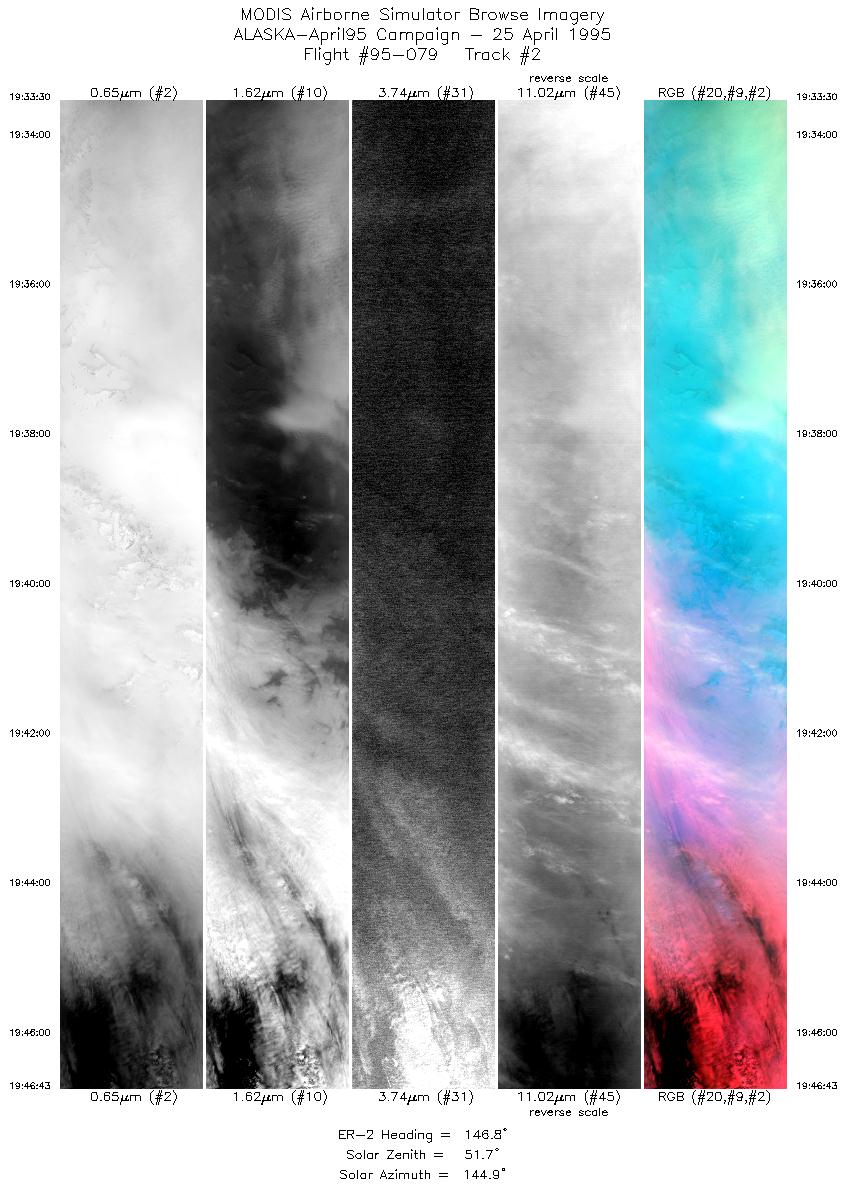
| 2 |
19:33-19:46 |
147 |
60.92-59.54 |
141.27-139.67 |
4949 |
~20000 |
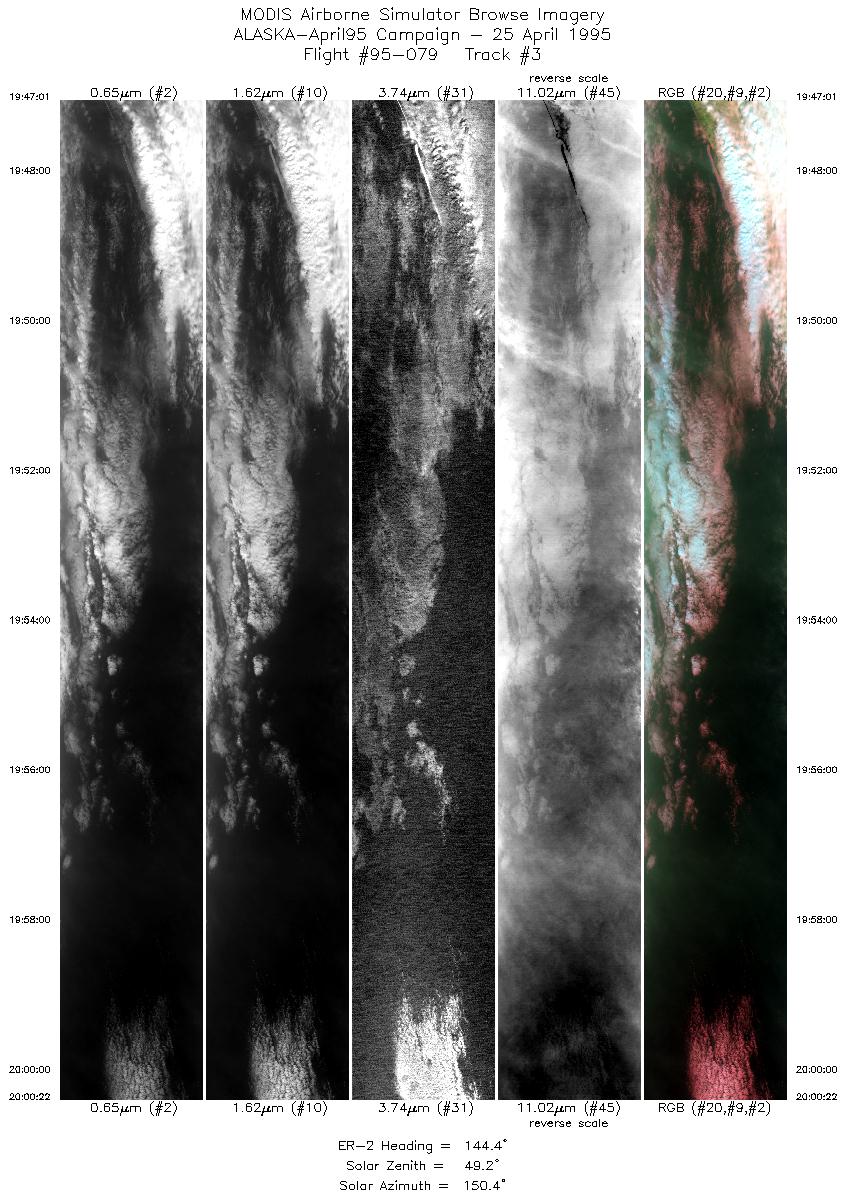
| 3 |
19:47-20:00 |
144 |
59.51-58.20 |
139.64-137.95 |
5000 |
~20000 |
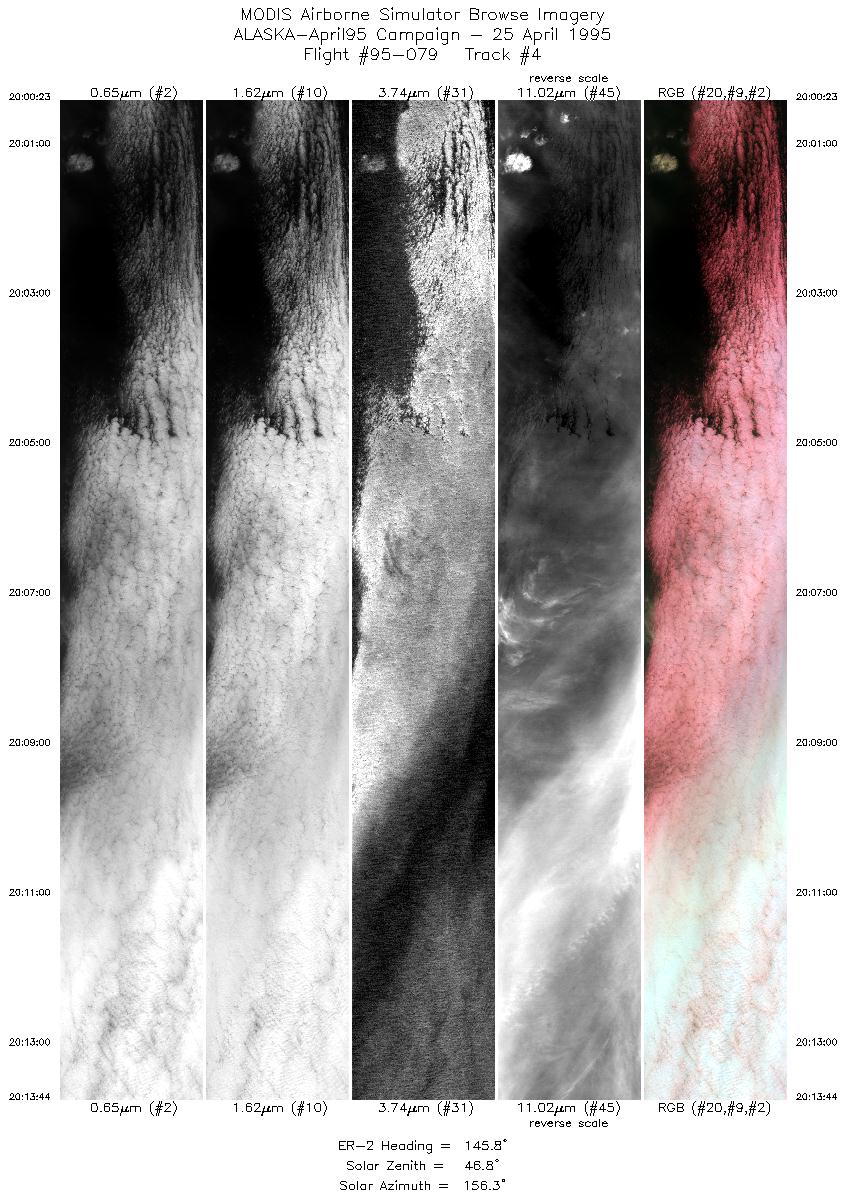
| 4 |
20:00-20:13 |
146 |
58.20-56.85 |
137.95-136.36 |
5000 |
~20000 |
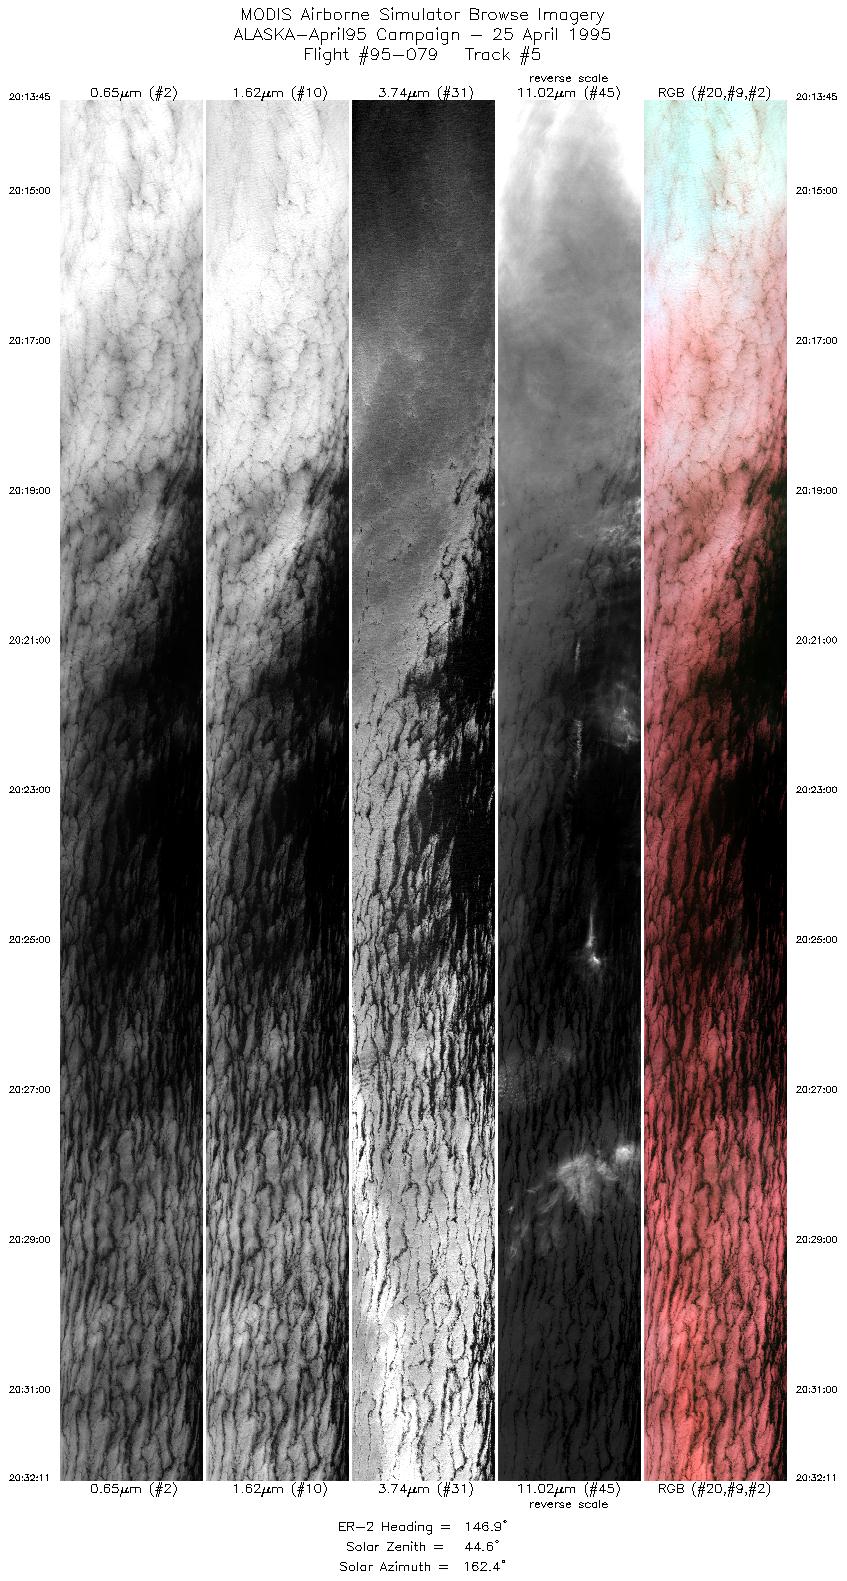
| 5 |
20:13-20:32 |
147 |
56.85-54.98 |
136.35-134.36 |
6905 |
~20000 |
| 6 |
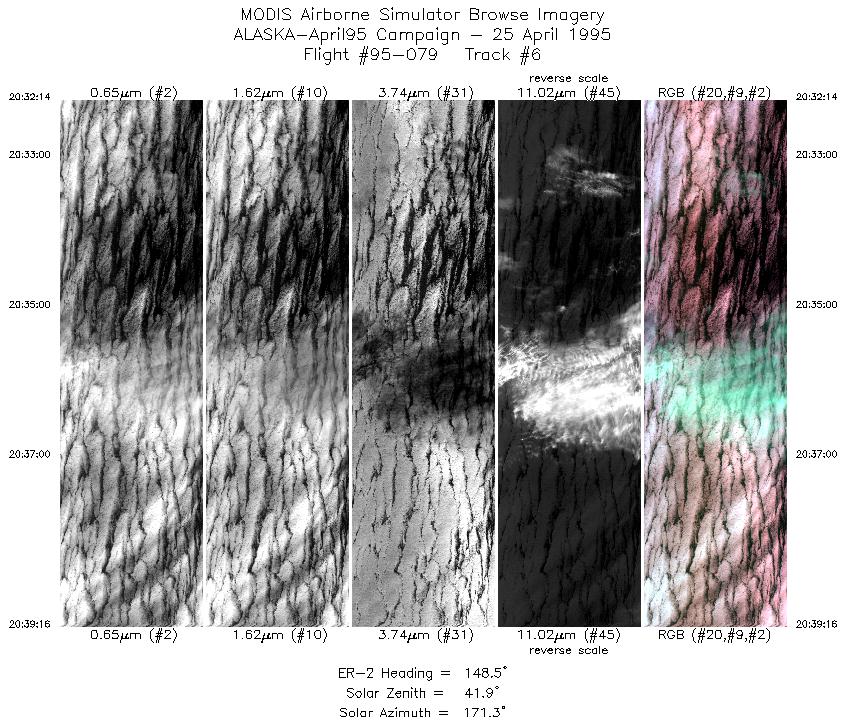
20:32-20:39 |
148 |
54.97-54.25 |
134.37-133.66 |
2636 |
~20000 |
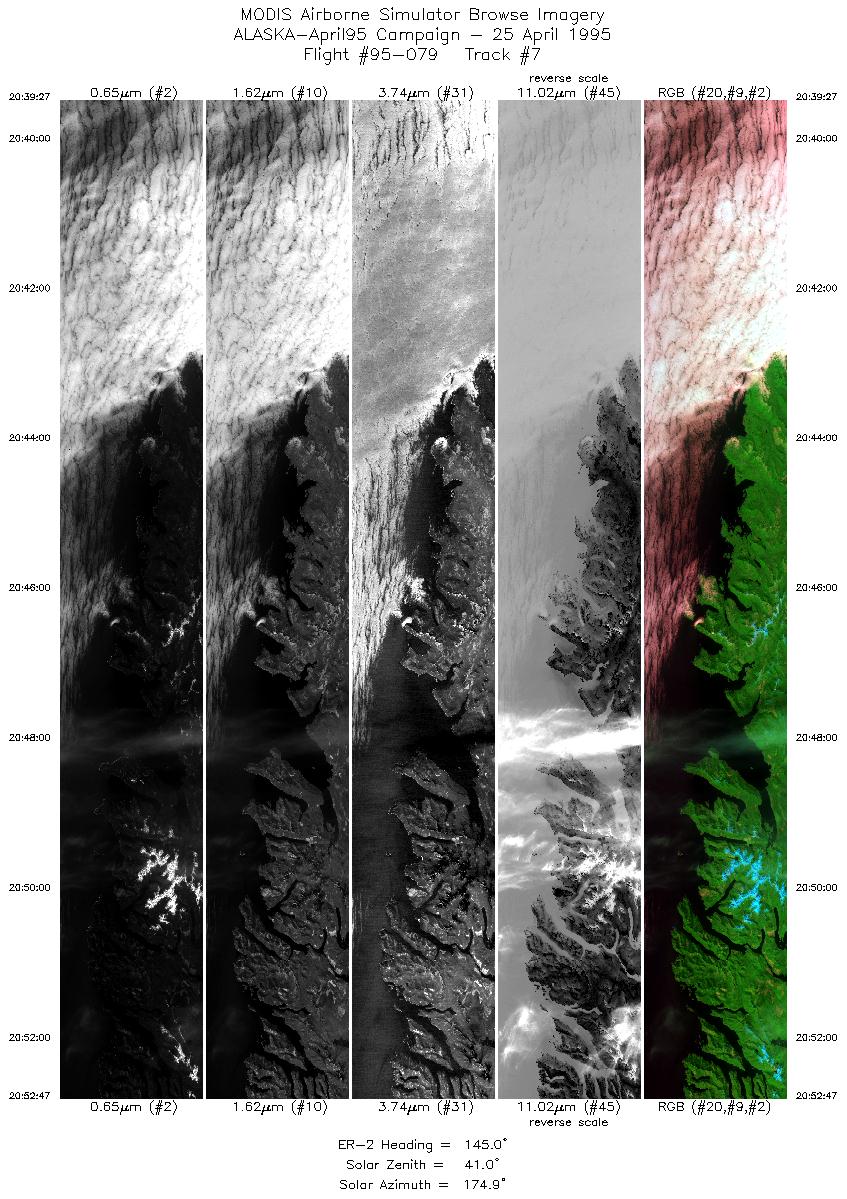
| 7 |
20:39-20:52 |
145 |
54.23-52.91 |
133.64-132.22 |
4996 |
~20000 |
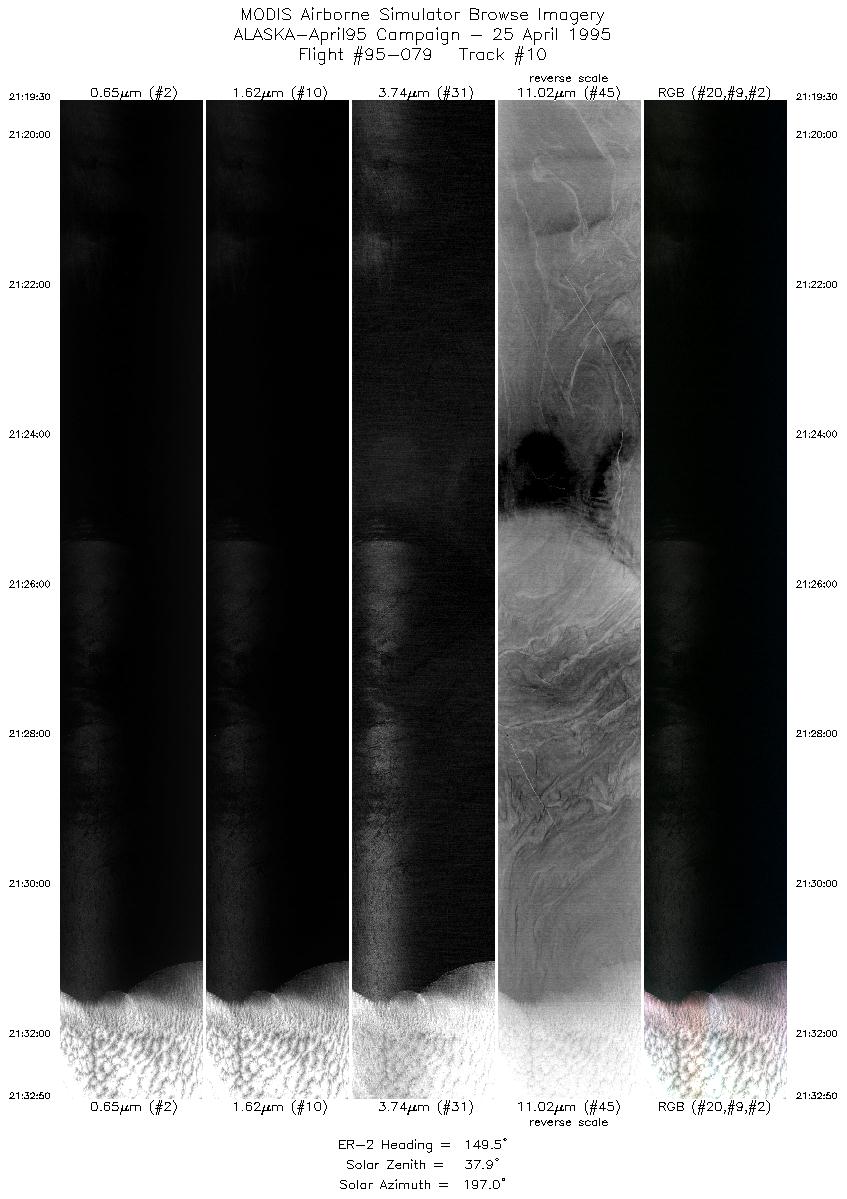
| 8 |
20:52-21:06 |
147 |
52.91-51.56 |
132.22-130.87 |
4997 |
~20000 |
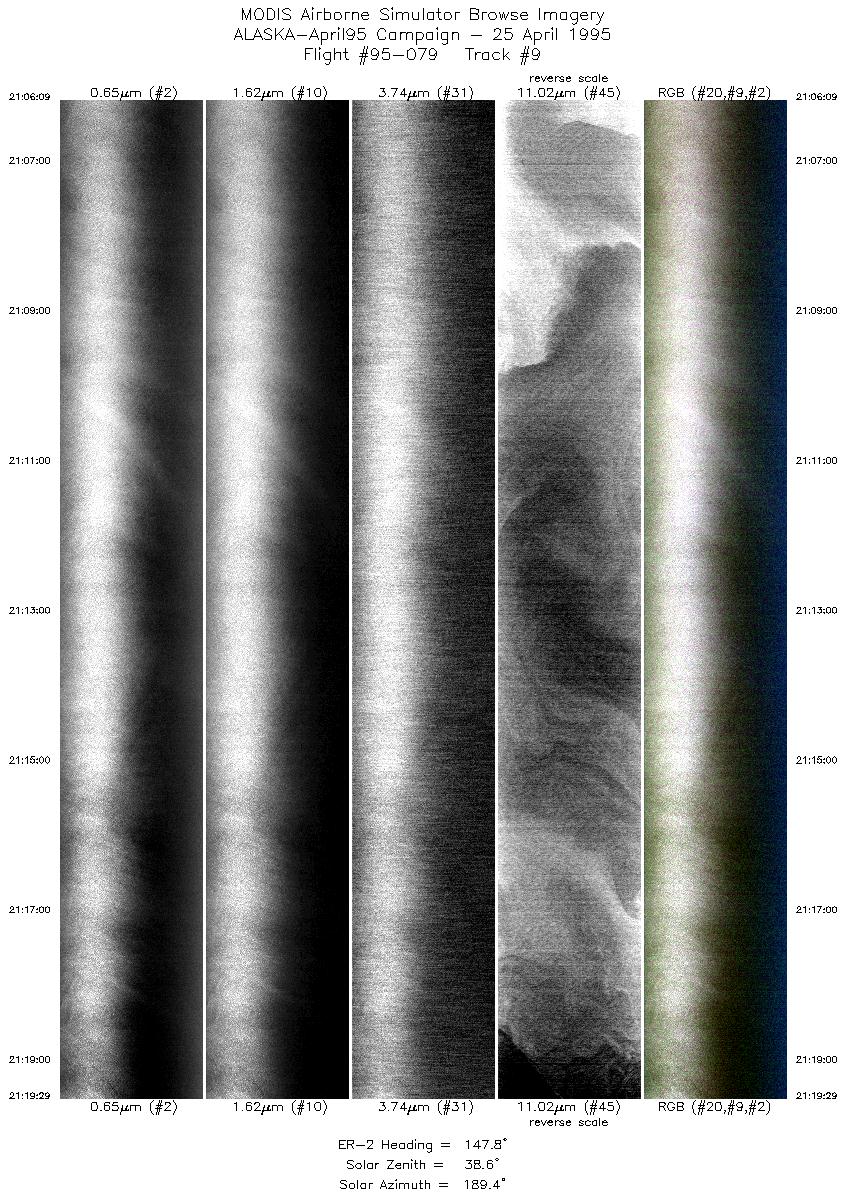
| 9 |
21:06-21:19 |
148 |
51.56-50.21 |
130.87-129.61 |
4997 |
~20000 |
| 10 |
21:19-21:32 |
149 |
50.20-48.82 |
129.61-128.40 |
4998 |
~20000 |
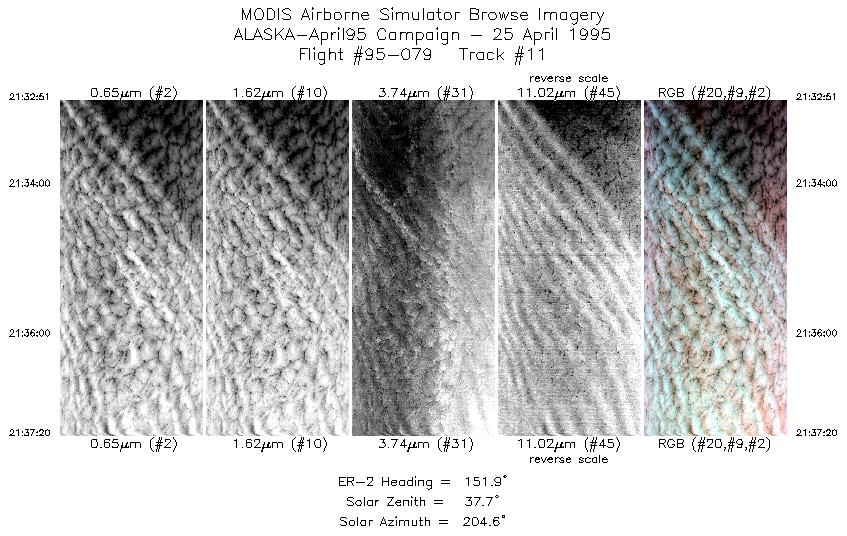
| 11 |
21:32-21:37 |
152 |
48.82-48.36 |
128.41-128.02 |
1681 |
~20000 |
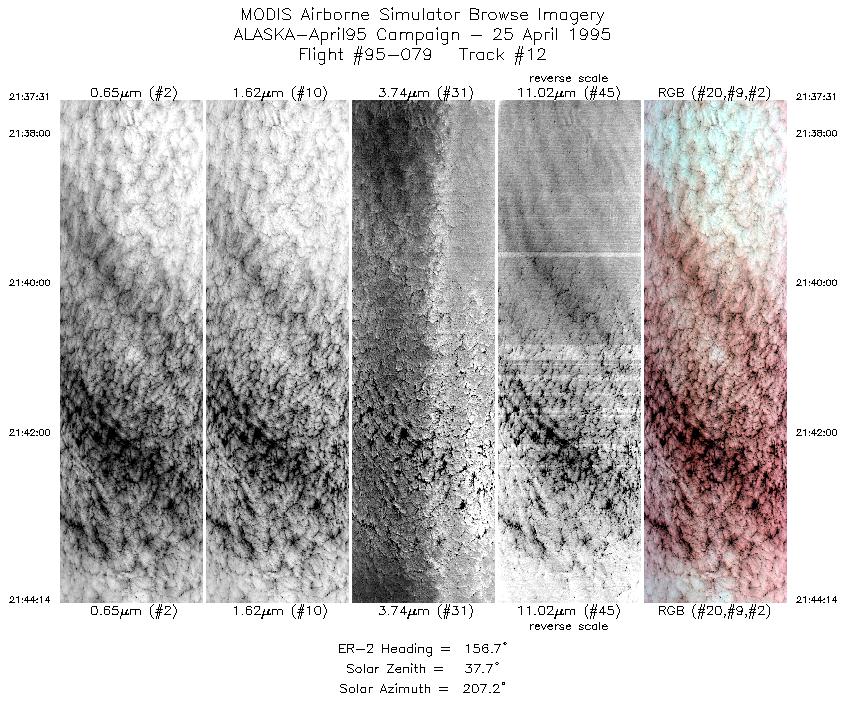
| 12 |
21:37-21:44 |
157 |
48.34-47.63 |
128.01-127.54 |
2518 |
~20000 |
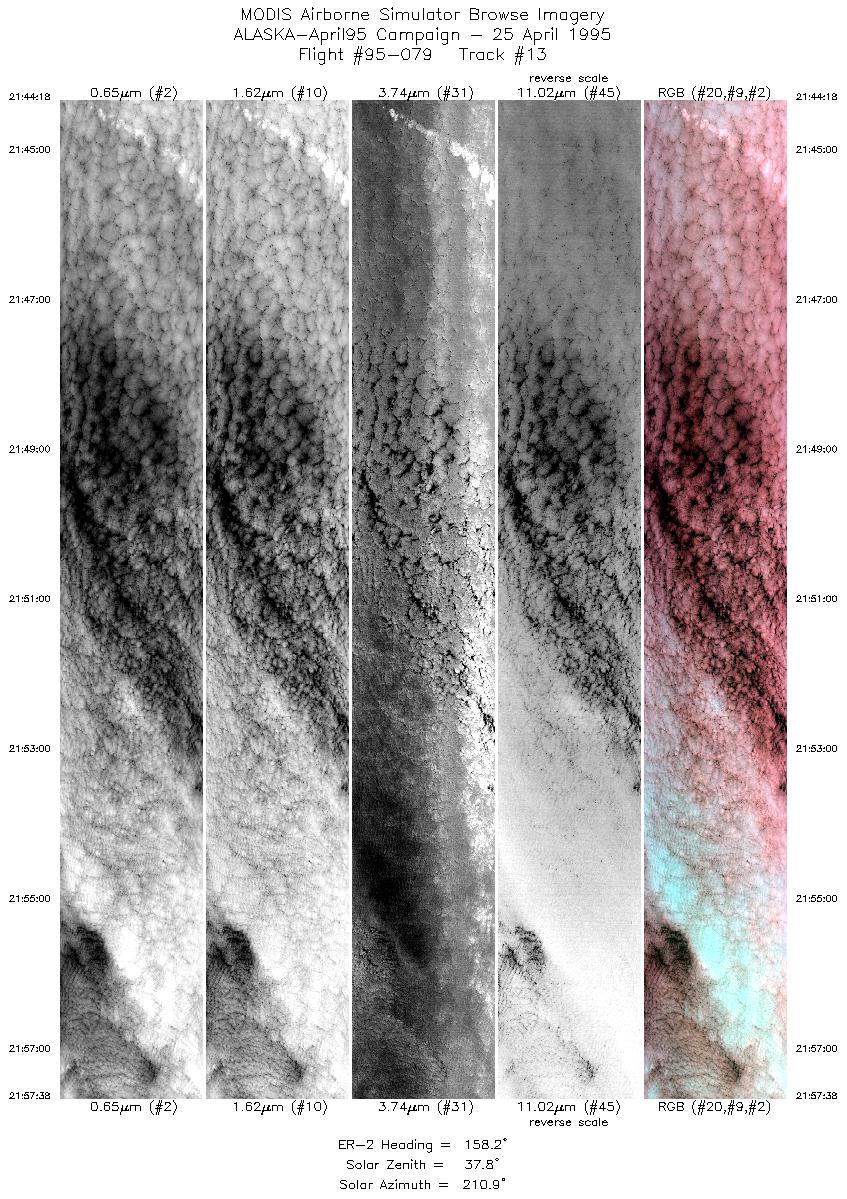
| 13 |
21:44-21:57 |
158 |
47.62-46.19 |
127.54-126.64 |
4998 |
~20000 |
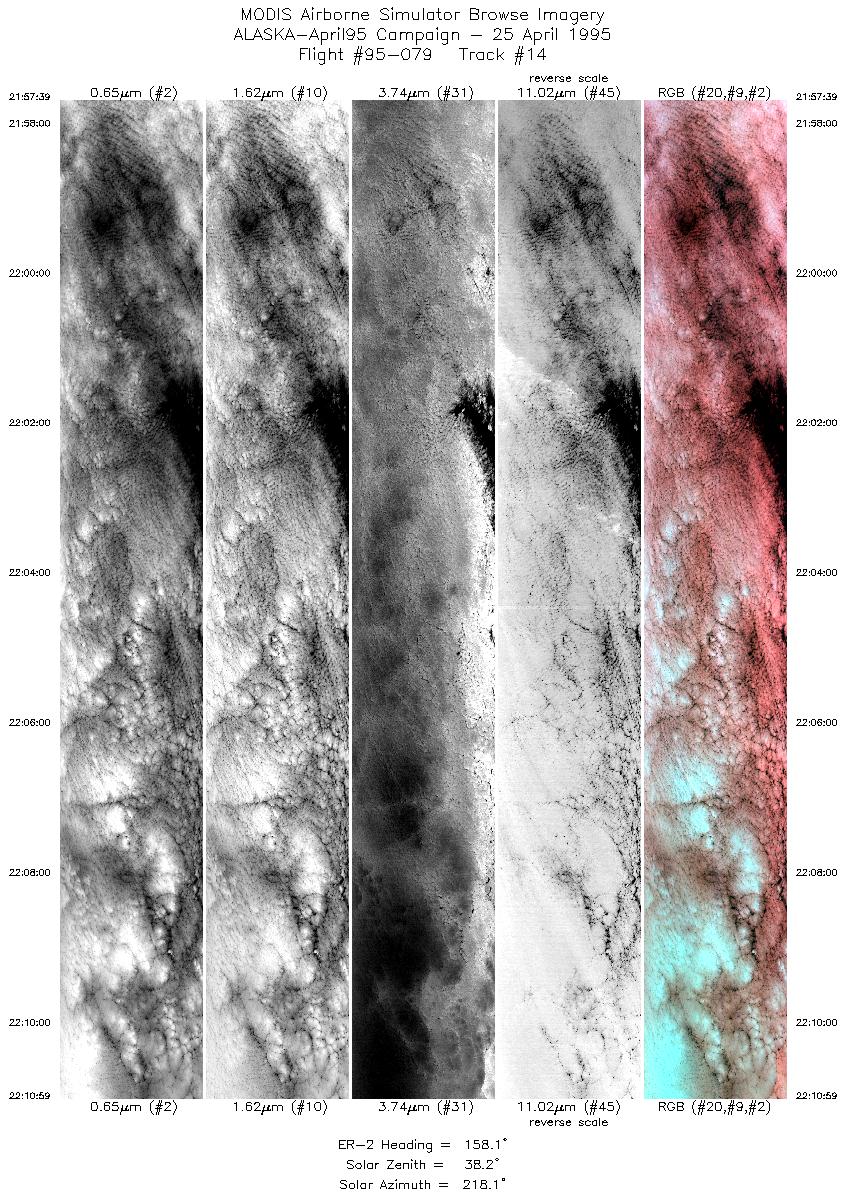
| 14 |
21:57-22:10 |
158 |
46.18-44.73 |
126.64-125.78 |
4997 |
~20000 |
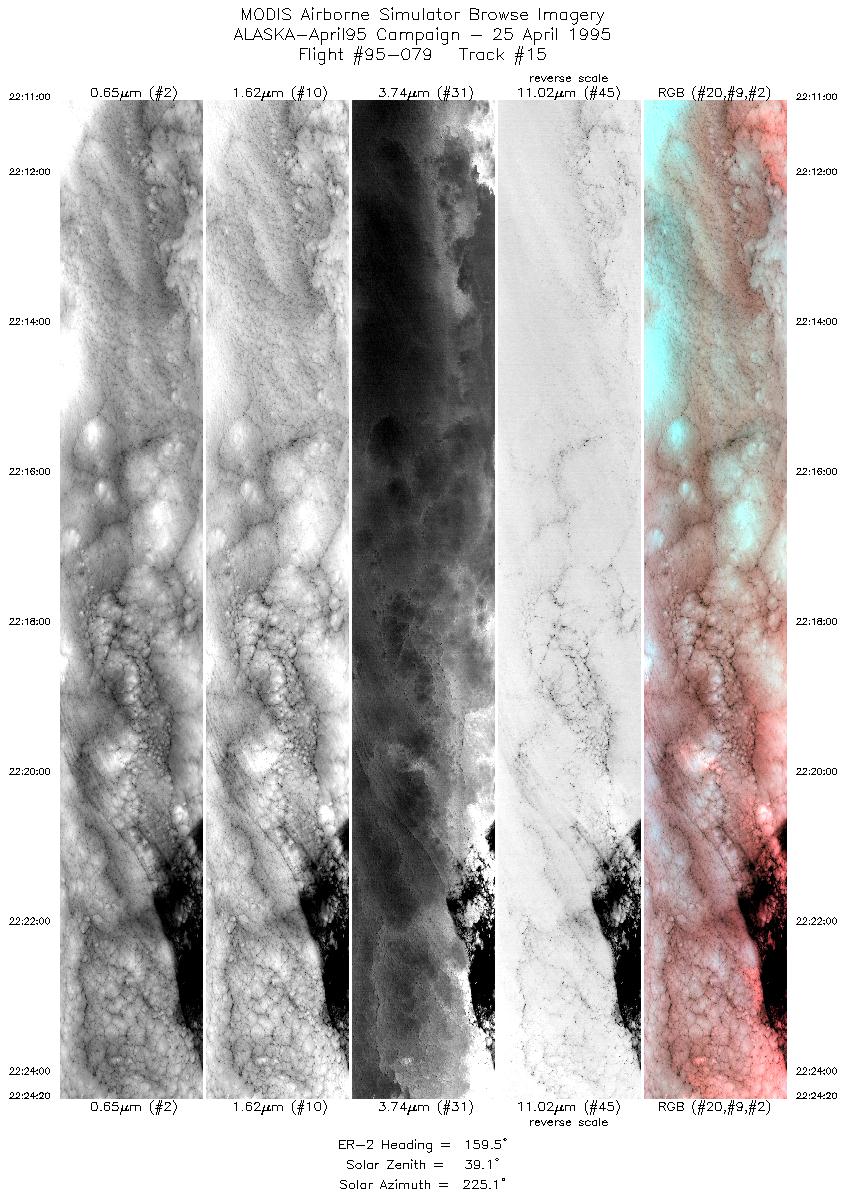
| 15 |
22:11-22:24 |
159 |
44.72-43.25 |
125.78-124.96 |
4998 |
~20000 |
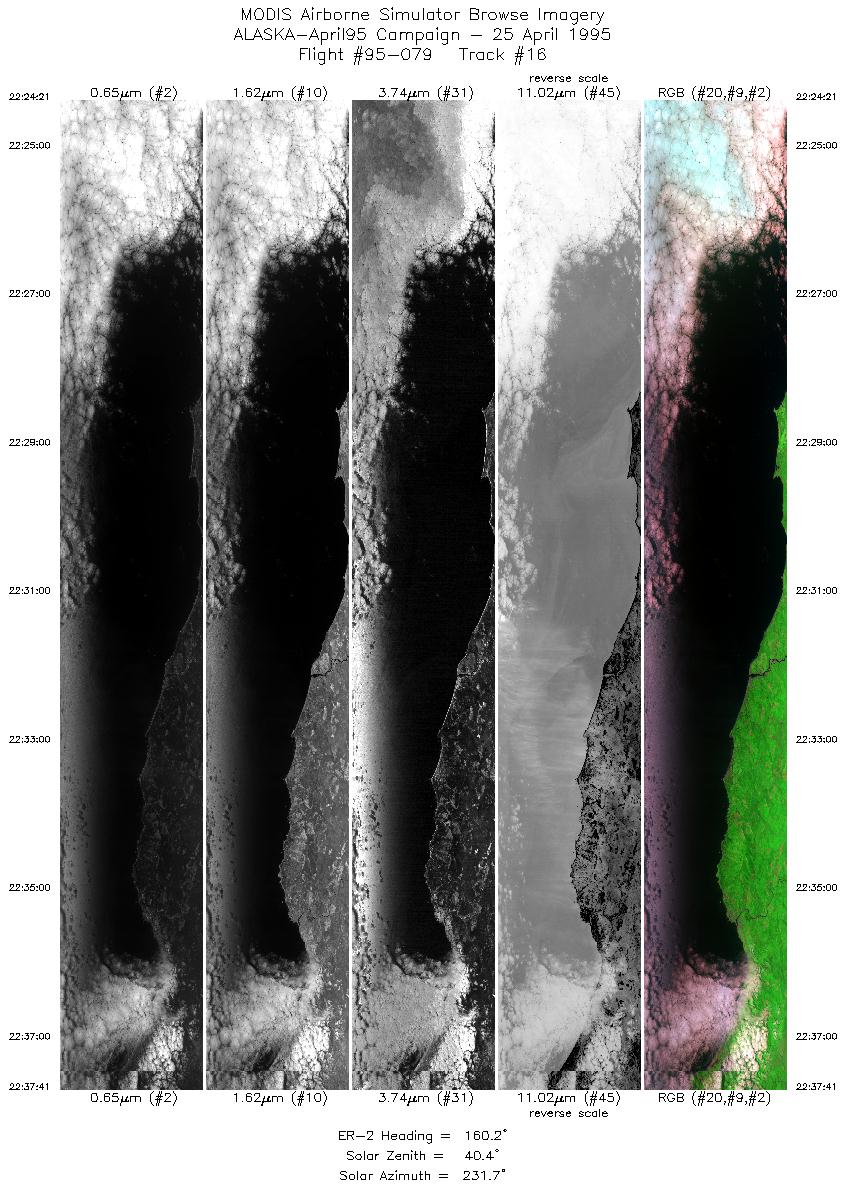
| 16 |
22:24-22:37 |
160 |
43.25-41.77 |
124.96-124.18 |
4950 |
~20000 |
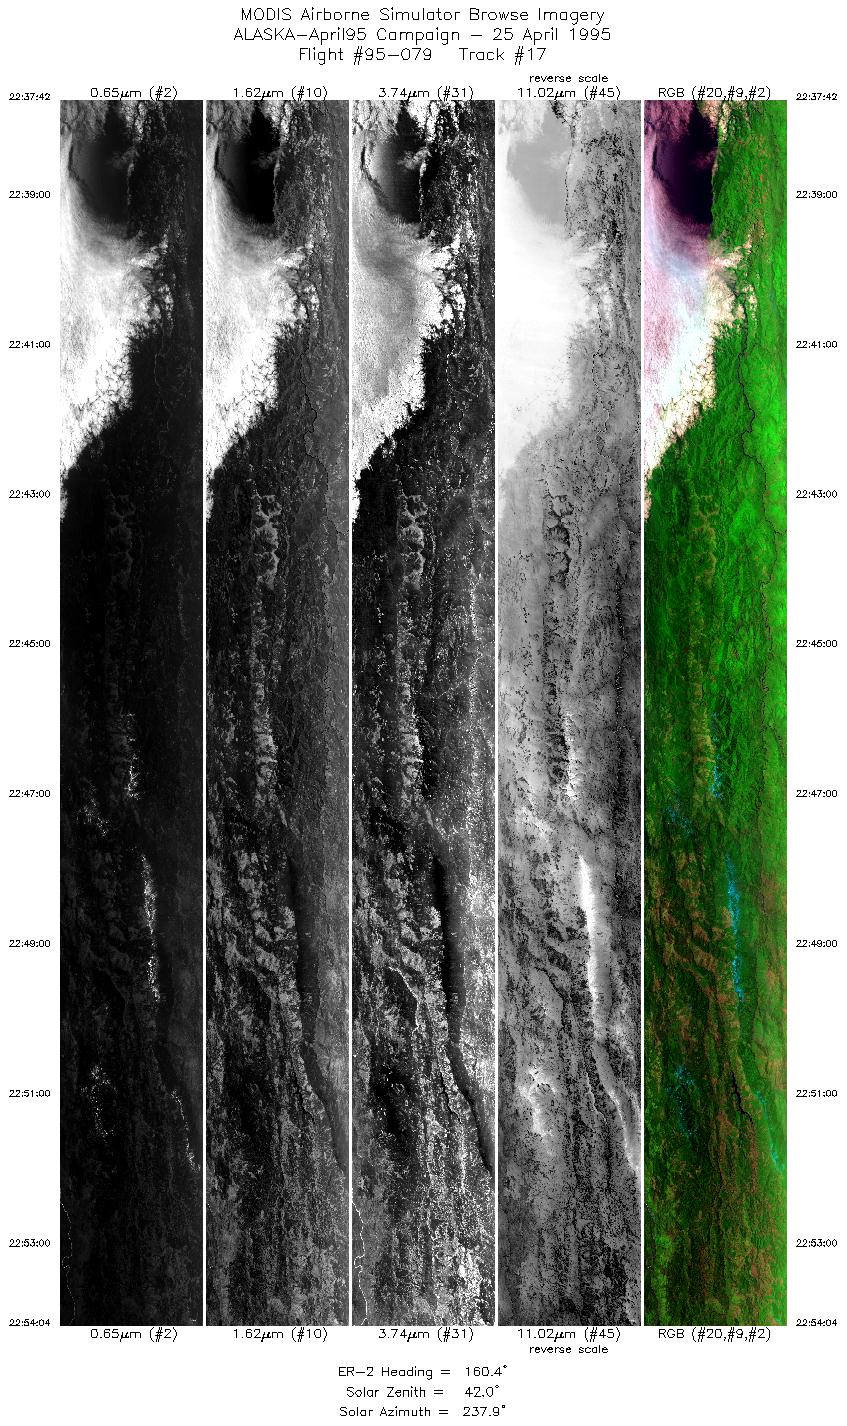
| 17 |
22:37-22:54 |
160 |
41.78-39.98 |
124.18-123.28 |
6134 |
~20000 |
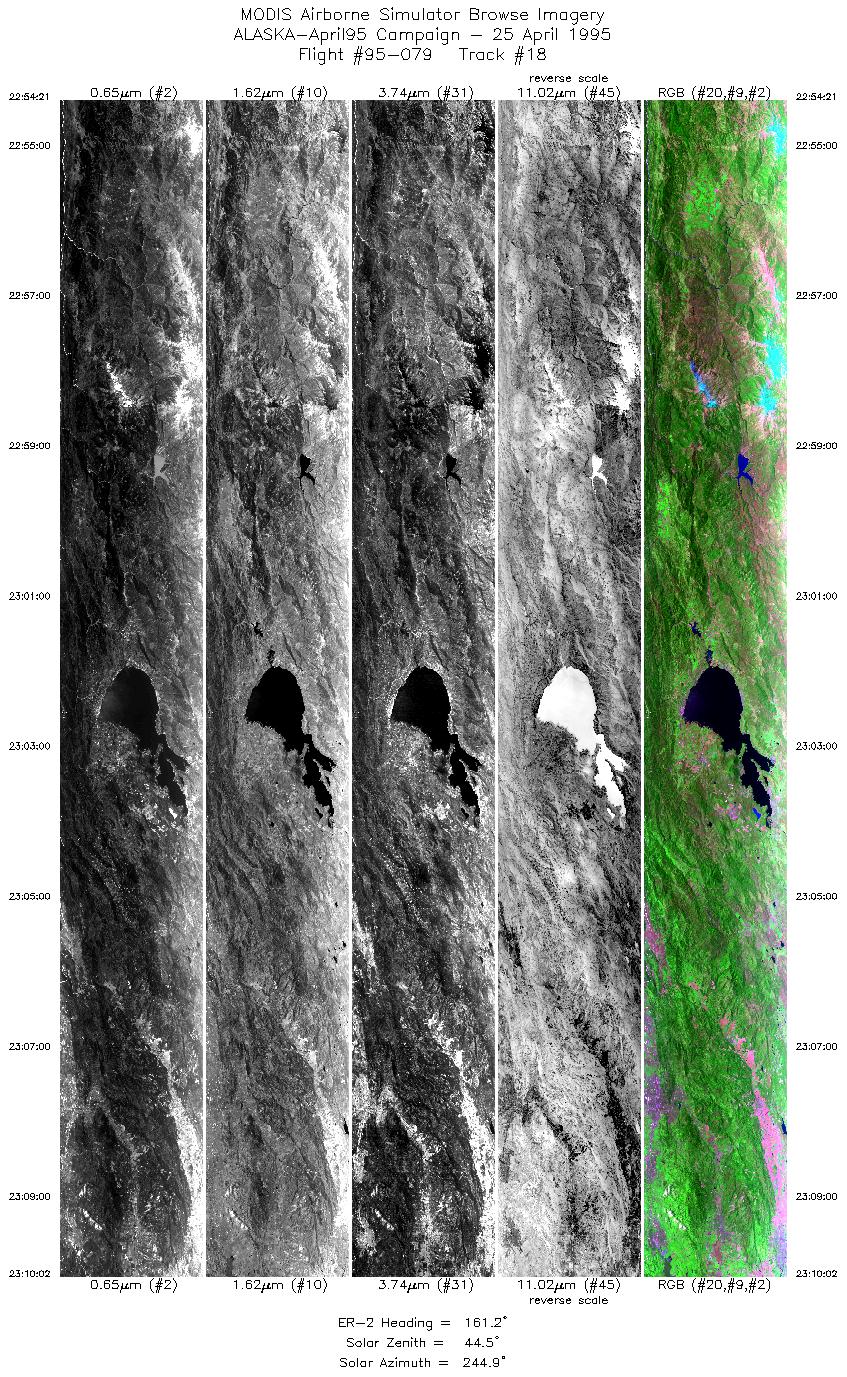
| 18 |
22:54-23:10 |
161 |
39.95-38.22 |
123.26-122.45 |
5885 |
~20000 |
|
Images 01 through 18 in sequence |
Level-1B HDF Data Distribution Point
NASA GSFC Earth Sciences (GES) Data Center
NASA DAAC's
|
|