Flight: 98-074
Date: 3 June 1998
Location: Alaska / Arctic Ocean
Deployment: FIRE-ACE
Principal Investigator: King (NASA GSFC)
Additional Sensors: AirMISR, AMPR, CLS, MIR, HIS, SSFR
|
Data Evaluation
Overall quality is good
|
Processing Information
Level-1B Data in HDF format is available
Flight Line Summary
Spectral Band Configuration
Spectral Response Function Table
|
Browse Imagery
Flight Tracks: 19
Scanlines: 91271
|
Browse Imagery Table
|
Click a Flight Track number to view a quicklook image
Lat/Lon ranges are for the BEG-END scanline nadir pixels |
Flight
Track |
Time Span
(GMT) |
Heading
(Deg) |
Lat Range
(Deg North) |
Lon Range
(Deg West) |
Length
(scanlines) |
Altitude
(meters) |
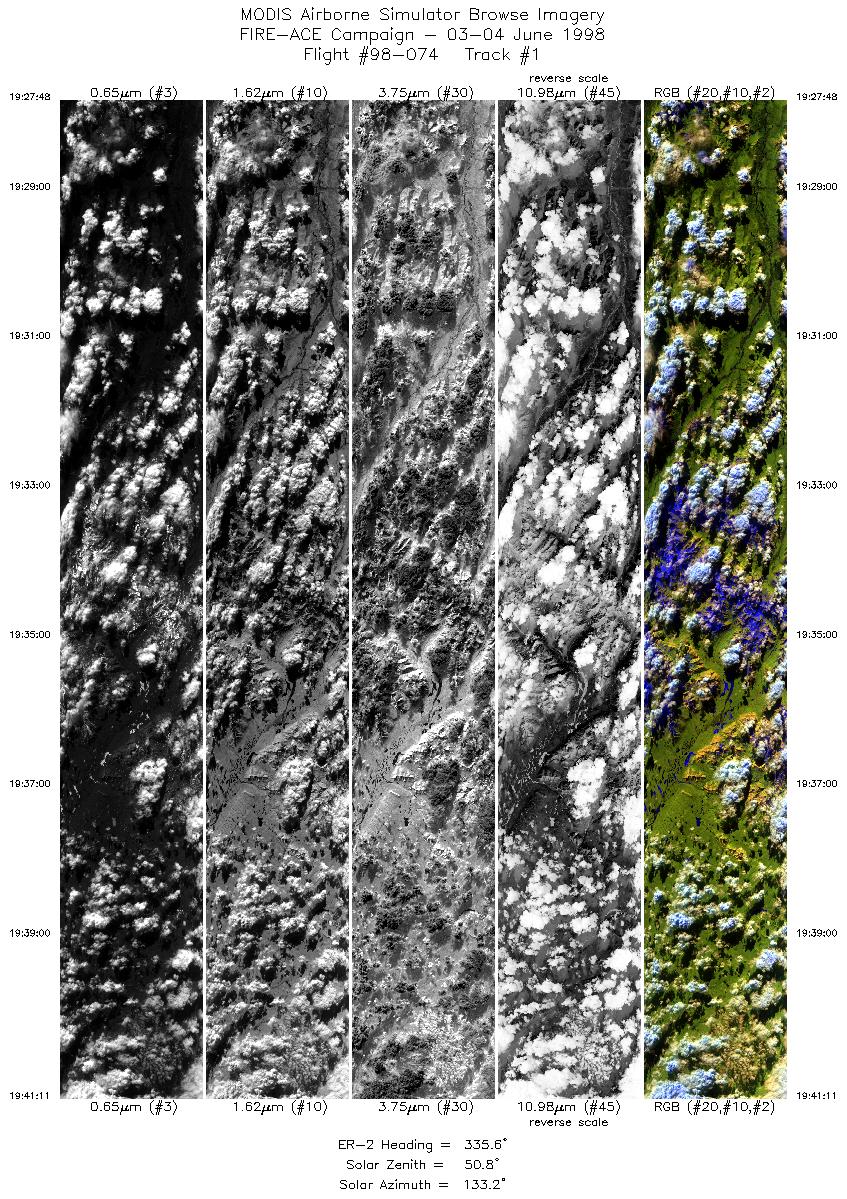
| 1 |
19:27-19:41 |
336 |
67.33-68.73 |
150.46-152.33 |
4999 |
~20000 |
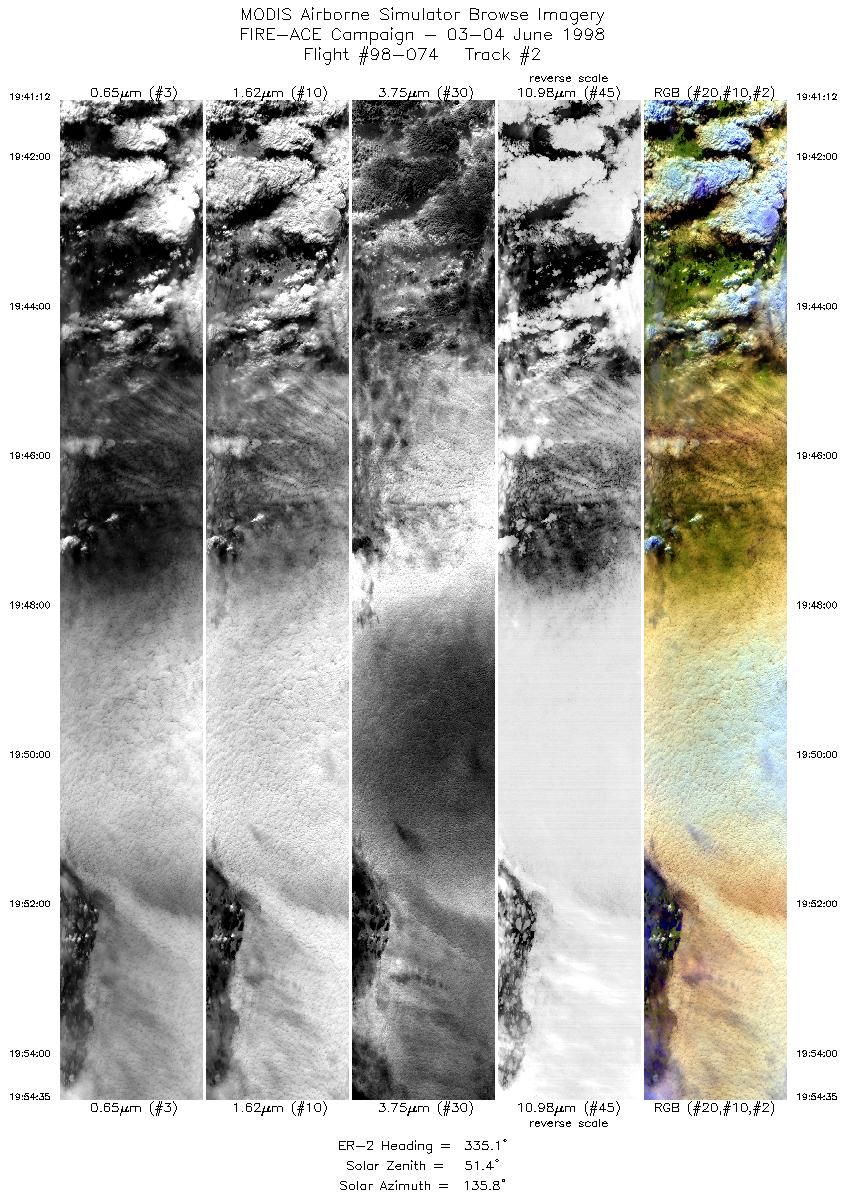
| 2 |
19:41-19:54 |
335 |
68.74-70.12 |
152.32-154.45 |
5001 |
~20000 |
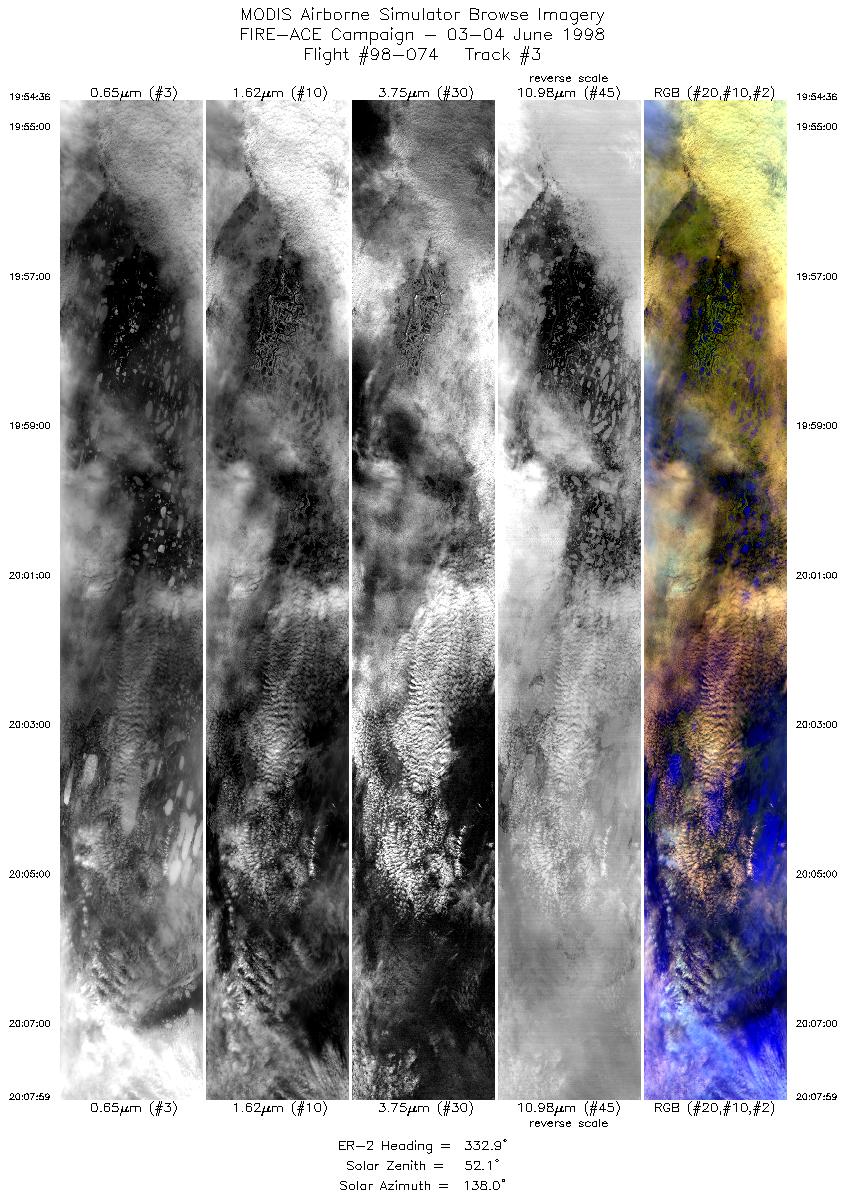
| 3 |
19:54-20:07 |
333 |
70.12-71.48 |
154.45-156.89 |
5001 |
~20000 |
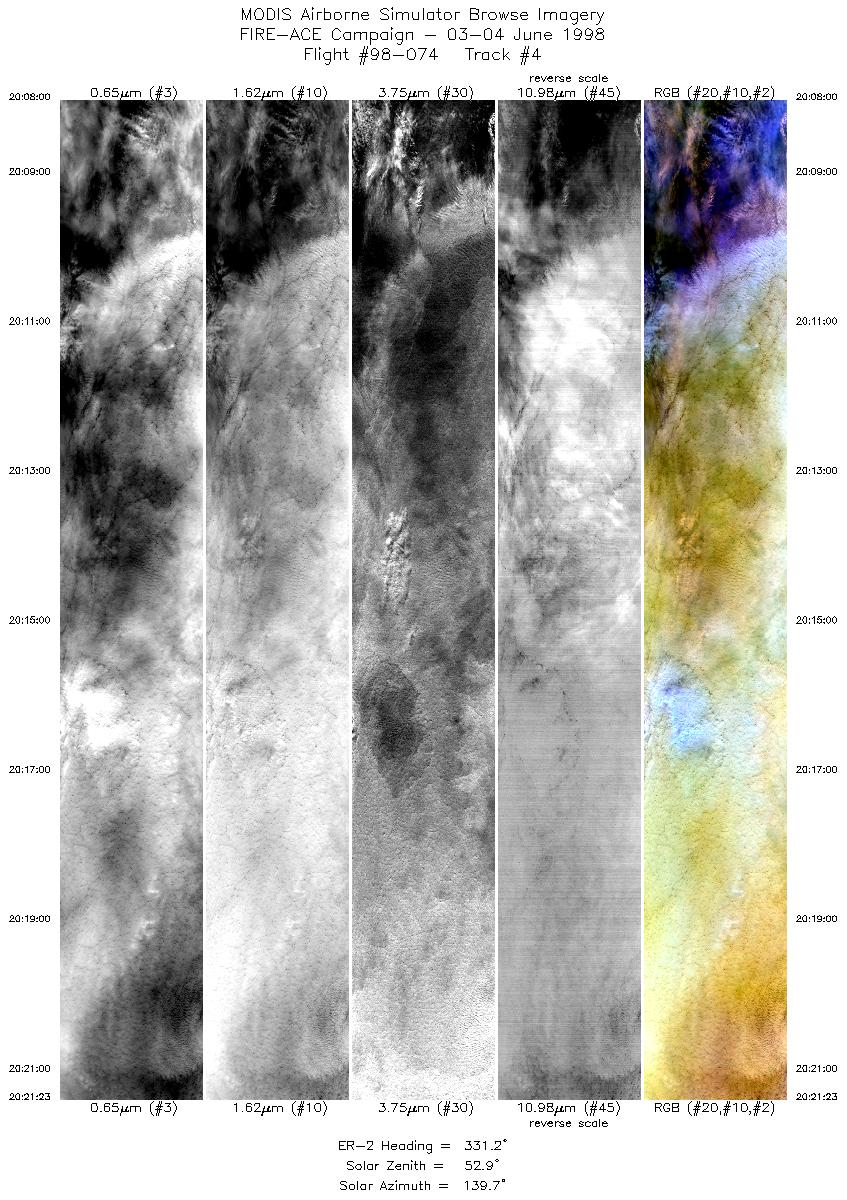
| 4 |
20:08-20:21 |
331 |
71.49-72.80 |
156.88-159.71 |
5000 |
~20000 |
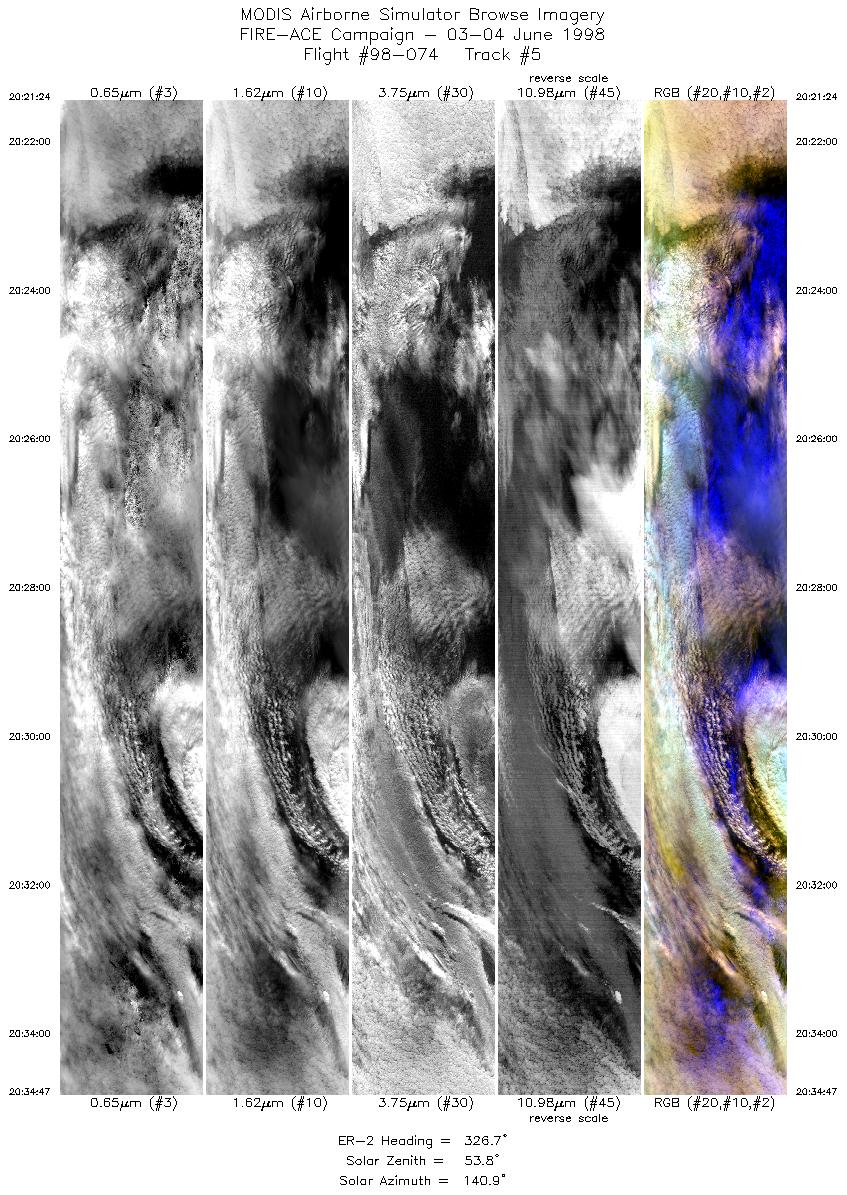
| 5 |
20:21-20:34 |
327 |
72.80-74.04 |
159.72-163.01 |
4976 |
~20000 |
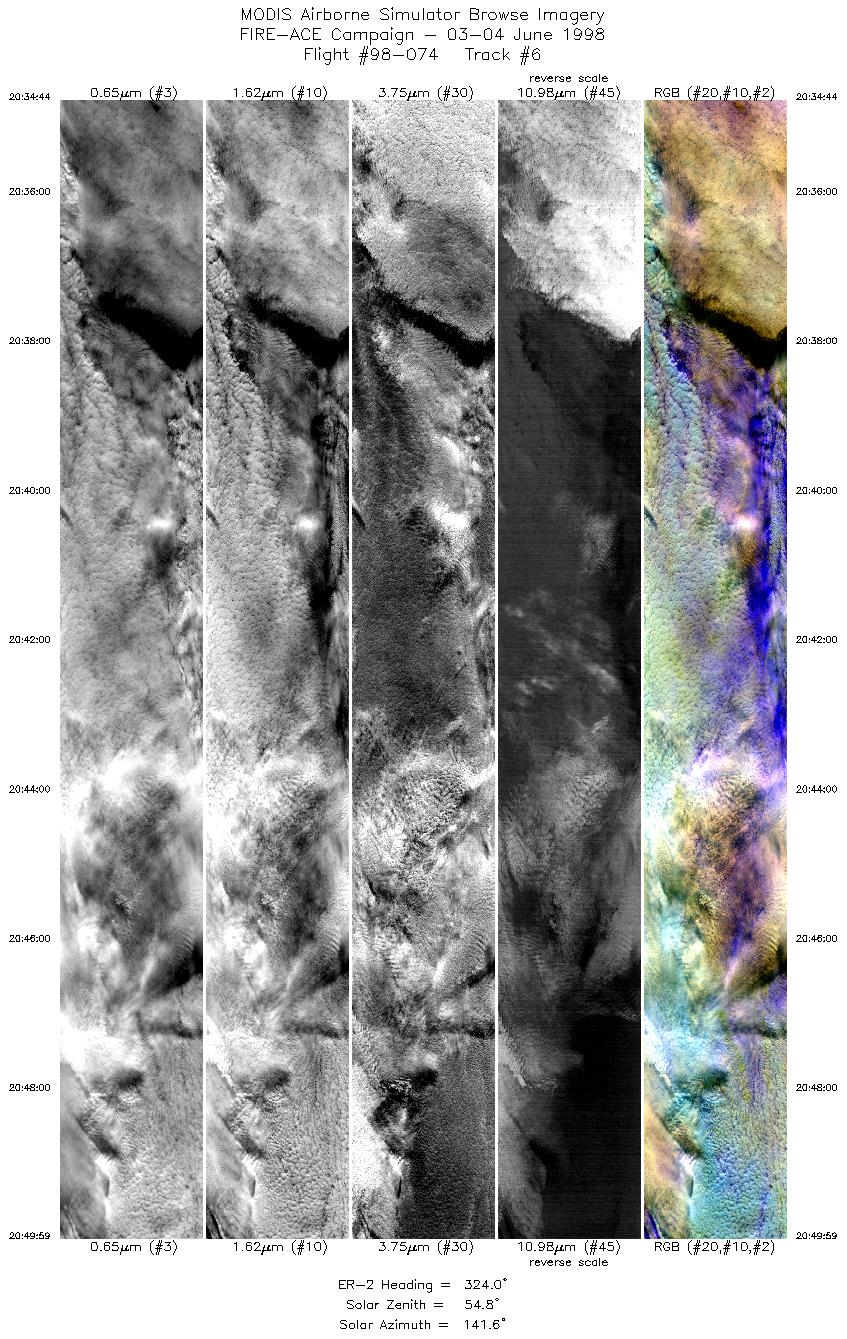
| 6 |
20:34-20:49 |
324 |
74.05-75.38 |
162.98-167.37 |
5697 |
~20000 |
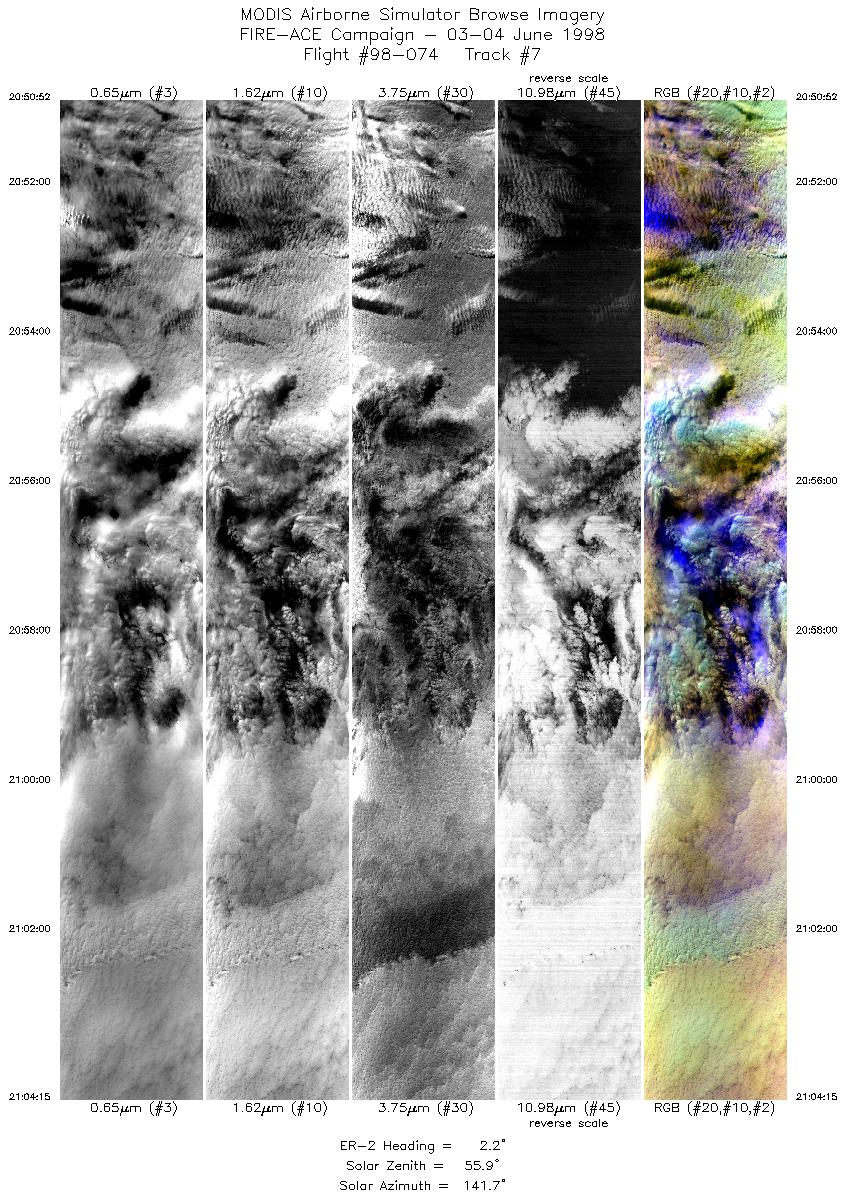
| 7 |
20:50-21:04 |
2 |
75.47-77.03 |
167.56-167.55 |
5000 |
~20000 |
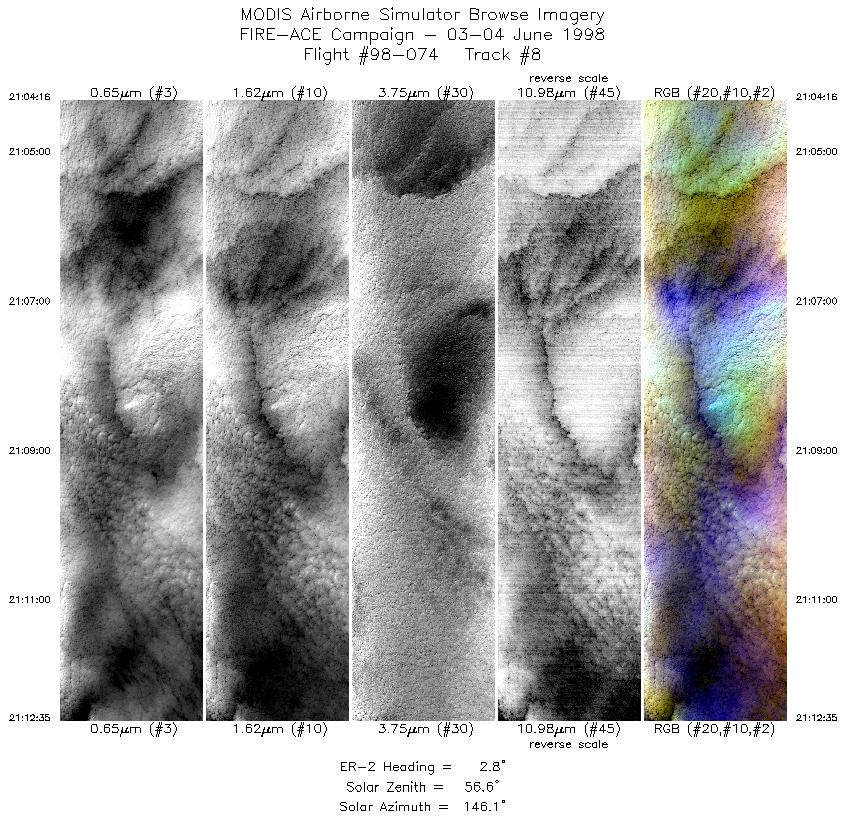
| 8 |
21:04-21:12 |
3 |
77.03-78.00 |
167.56-167.56 |
3108 |
~20000 |
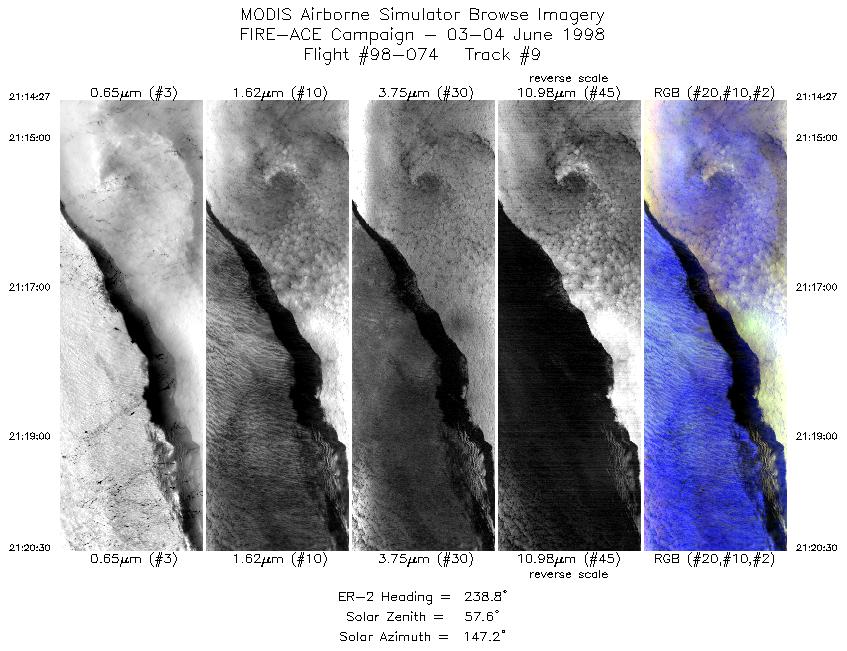
| 9 |
21:14-21:20 |
239 |
78.05-77.69 |
168.34-171.23 |
2259 |
~20000 |
| 10 |
21:23-21:42 |
131 |
77.47-76.00 |
170.74-163.79 |
7078 |
~20000 |
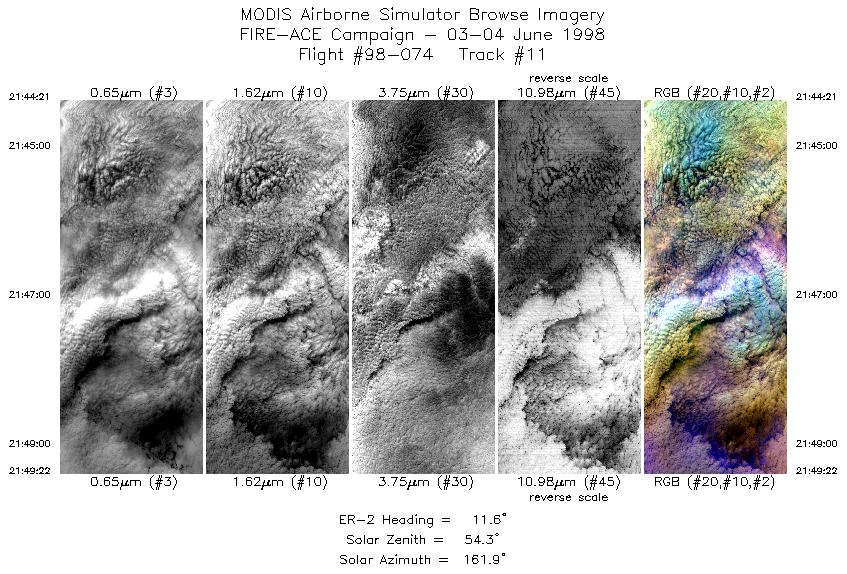
| 11 |
21:44-21:49 |
12 |
76.06-76.63 |
163.11-162.64 |
1874 |
~20000 |
| 12 |
21:50-22:09 |
276 |
76.81-76.81 |
163.01-172.77 |
7040 |
~20000 |
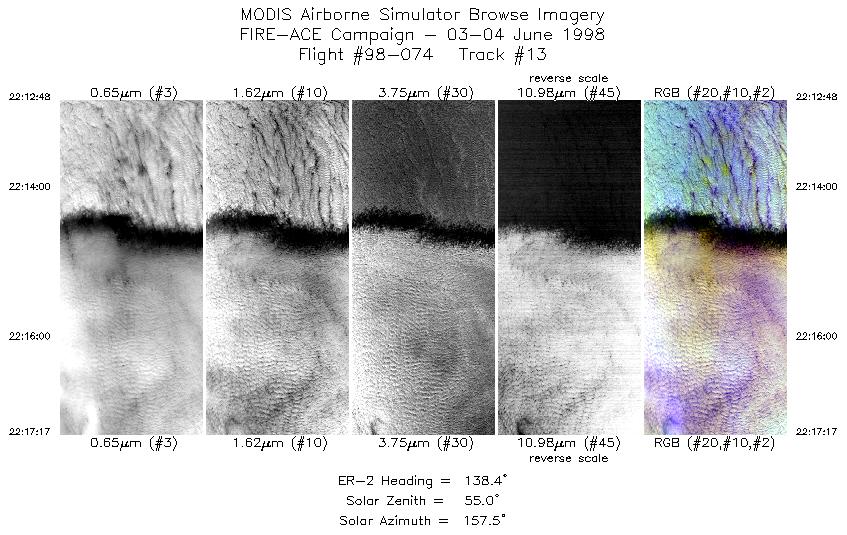
| 13 |
22:12-22:17 |
138 |
76.50-76.11 |
172.95-171.49 |
1675 |
~20000 |
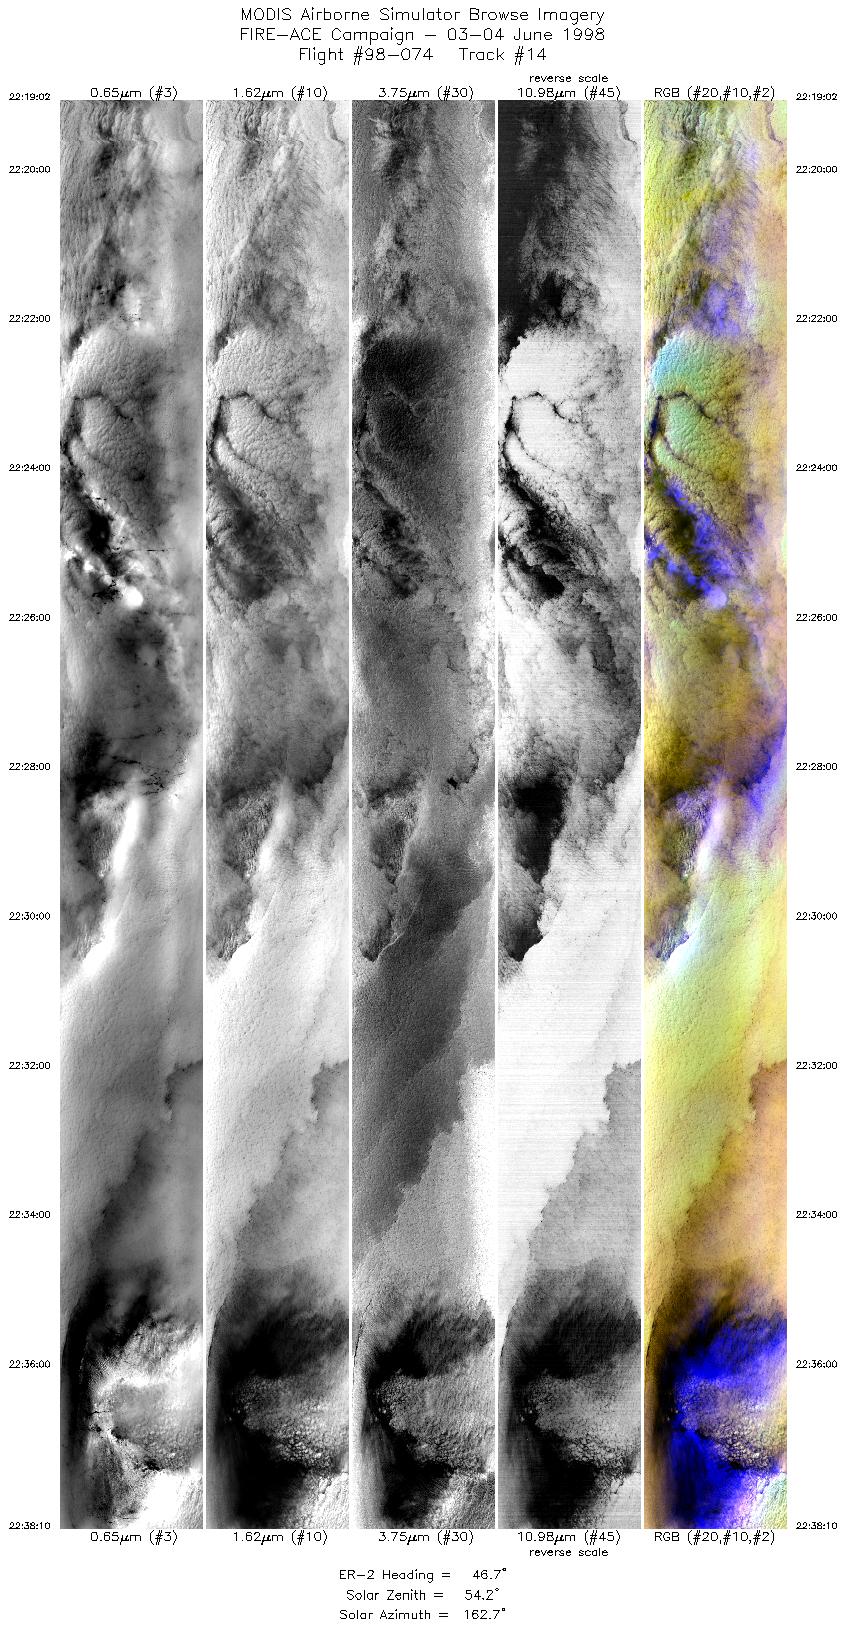
| 14 |
22:19-22:38 |
47 |
76.12-77.60 |
170.88-163.62 |
7146 |
~20000 |
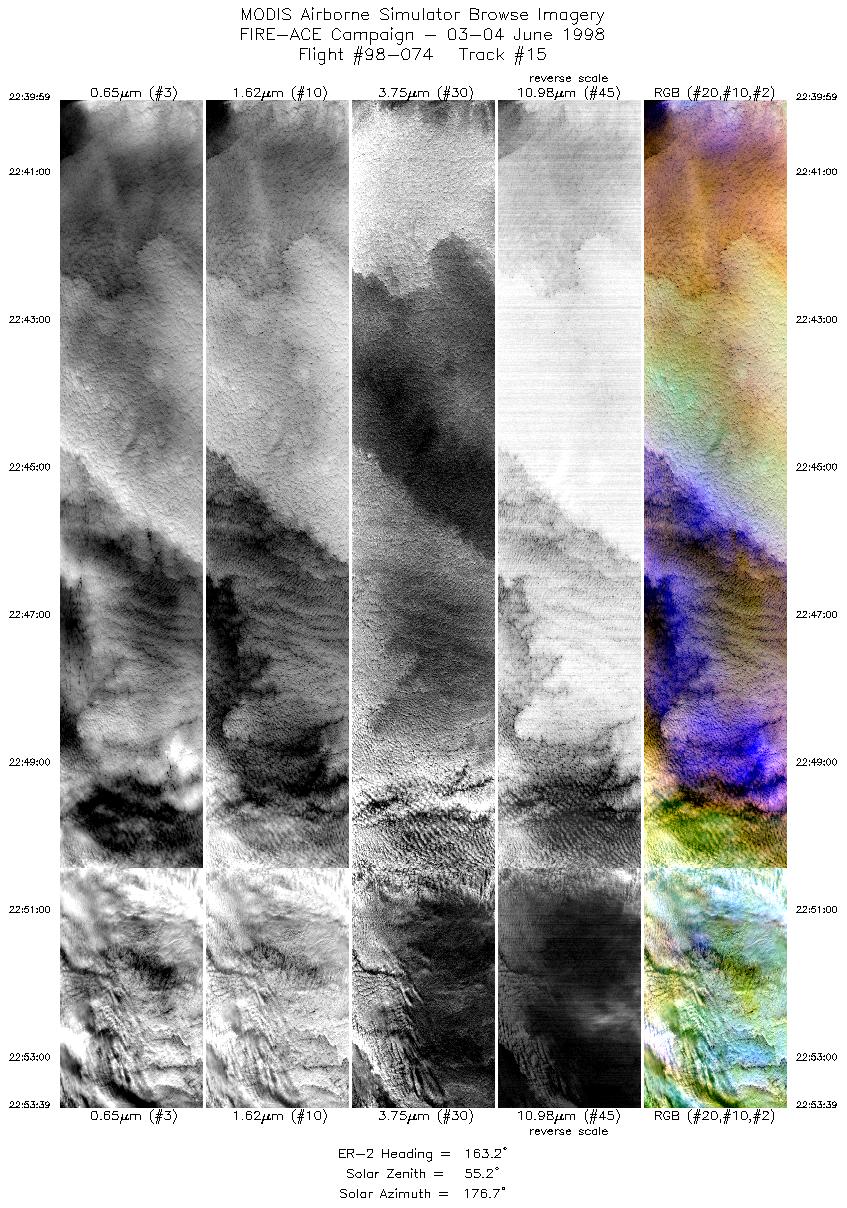
| 15 |
22:39-22:53 |
163 |
77.54-76.03 |
162.66-160.75 |
5044 |
~20000 |
| 16 |
22:53-23:07 |
165 |
76.03-74.53 |
160.76-159.23 |
5042 |
~20000 |
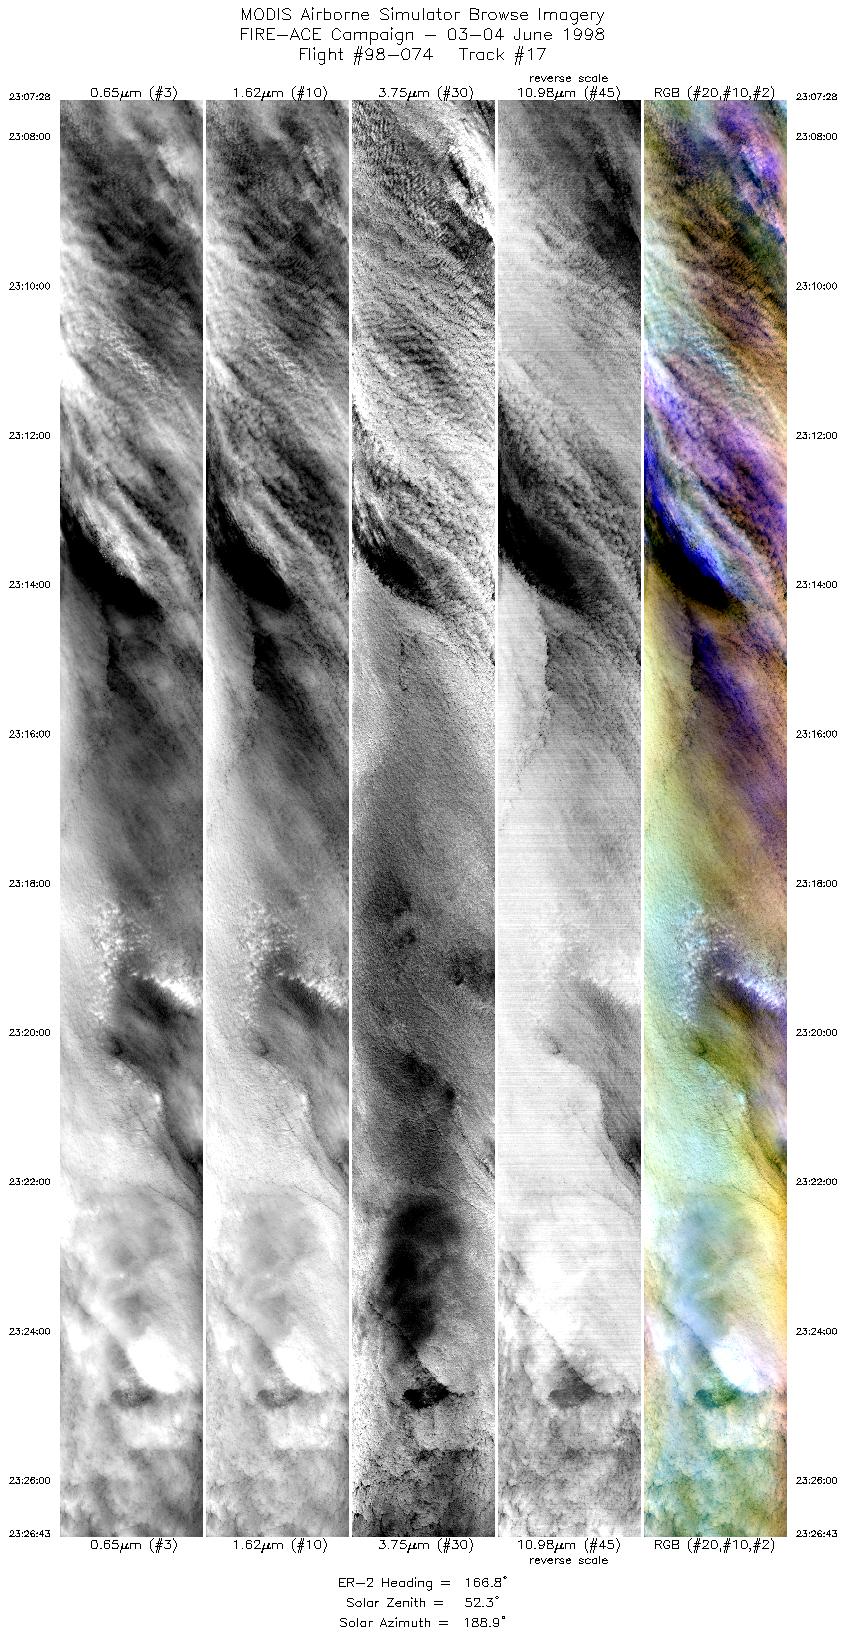
| 17 |
23:07-23:26 |
167 |
74.49-72.34 |
159.18-157.46 |
7188 |
~20000 |
| 18 |
23:26-23:45 |
168 |
72.33-70.18 |
157.47-156.12 |
7177 |
~20000 |
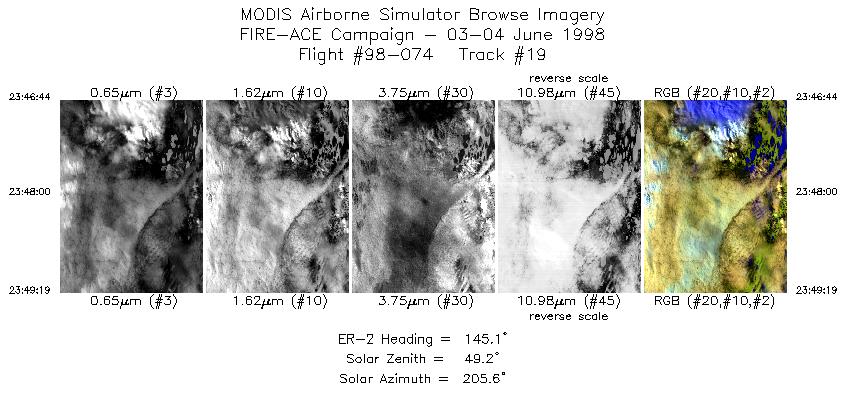
| 19 |
23:46-23:49 |
145 |
70.10-69.86 |
156.03-155.53 |
966 |
~20000 |
|
Flight Summary Report
Author: Steve Platnick
Mission Scientist: Steve Platnick
ER-2 Pilot: Jan Nystrom
Takeoff: 1900 (UTC)
Landing: 0155 (UTC)
Duration: 6:00 (h:mm)
Objective and Summary:
- Overfly the SHEBA ice camp (76°49'N, 167°34'W) in astar-shaped or
"shamrock" pattern for cloud remote sensing and cloud masking validation,
cloud bidirectional reflectance measurements, and sea ice retrievals in the
presence of changing cloud cover for AMPR.
- Overfly the ARM site on outgoing and incoming flight legs.
Coordinations:
- University of Washington CV-580 aircraft
- F-14 satellite (2148 & 2329 UTC)
Key Flight Legs:
- The ER-2 overflew the ARM site on a NW flight line enroute toward the SHEBA ice
station.
- The ER-2 made four legs of about 260km in length centered over the SHEBA ice
station, with legs offset by 45°. A South-to-North leg was run first, repeating
a pass from the previous day's flight of 2 June 1998 (requested for assessing
changes in AMPR sea ice retrievals with different cloud types and amounts).
- The CV-580 flew to SHEBA and attempted above and below-cloud bidirectional
reflectance measurements and in situ profiles through the cloud.
- The ER-2 overflew the ARM site on the return to Ft. Wainwright.
- The AirMISR was turned on for 6 acquisitions: once over the ARM site on the
outgoing leg, four times over the SHEBA ice station, and once more over the
ARM site on the return leg. The AirMISR operated at the following times with
notes of observed clouds as seen by the instrument:
- 2001-2015 UTC (ARM - complete run of 9 angles; stratocumulus visible with thin high cloud)
- 2057-2110 UTC (SHEBA - complete run; stratus clouds)
- 2126-2138 UTC (SHEBA - complete run; stratus clouds)
- 2154-2208 UTC (SHEBA - complete run; stratus clouds)
- 2222-2235 UTC (SHEBA - complete run; stratus clouds)
- 2330-2346 UTC (ARM - complete run; stratocumulus visible through moderately thick high clouds)
Pilot Report:
- The ER-2 pilot reported solid midlevel cloud cover over the ice station on the
initial flight tracks, with gradual clearing during the mission (some ice seen
with the clearer regions to the Northwest).
- On the outbound leg over the ARM site: undercast to the West, thin cirrus over
broken stratus.
- On return over ARM site: clouds at all levels, some cirrus, some clearing.
Meteorology:
- Extensive stratus clouds with heights at about 3.5km were expected over the
SHEBA ice station. Morning report of fog with solid overcast clouds with flat
and uniform tops at about 3.5km associated with a strong inversion. Light
cirrus between Barrow and the ice station. Surface winds out of the Southwest
at 5kts. Morning satellite imagery showed a uniform stratus deck above the ice
station. Later imagery from about the time of the ER-2 takeoff indicated that
the upper stratus deck might be breaking up, some light cirrus seen in some
locations.
- At 2000 UTC, the ice station reported surface winds at 6kts, 125° and a ceilometer
cloud base of about 1km. Radar showing two cloud layers: lower one at 1-1.2km
and a higher layer at 1.6-3km. Near the time of the ER-2 arrival (2100 UTC),
the lower cloud dissipated with the higher cloud layer thinning to 2-3km,
possibly liquid at the top. Low fog present at 2230 UTC.
Instrument Status:
- AirMISR (Airborne Multi-angle Imaging Spectroradiometer): Worked well
- AMPR (Advanced Microwave Precipitation Radiometer): Worked well
- CLS (Cloud Lidar System): Worked well
- HIS (High-resolution Interferometer Sounder): Worked well
- MAS (MODIS Airborne Simulator): Worked well
- MIR (Millimeter-wave Imaging Radiometer): Intermittent noise in higher frequency channels
- SSFR (Solar Spectral Flux Radiometer): No data taken during flight. Under investigation
|


