NASA logo and link
EOSPSO logo and link
ASP logo and link
MAS Banner image

MODIS Airborne Simulator (MAS)

FLIGHT SUMMARY INFORMATION

Flight Track Map
track map thumbnail Click map
Flight: 98-070
Date: 29 May 1998
Location: Alaska / Arctic Ocean
Deployment: FIRE-ACE
Principal Investigator: King (NASA GSFC)
Additional Sensors: AirMISR, AMPR, CLS, MIR, HIS, SSFR

Data Evaluation
Overall quality is good

Processing Information
Level-1B Data in HDF format is available
Flight Line Summary
Spectral Band Configuration
Spectral Response Function Table

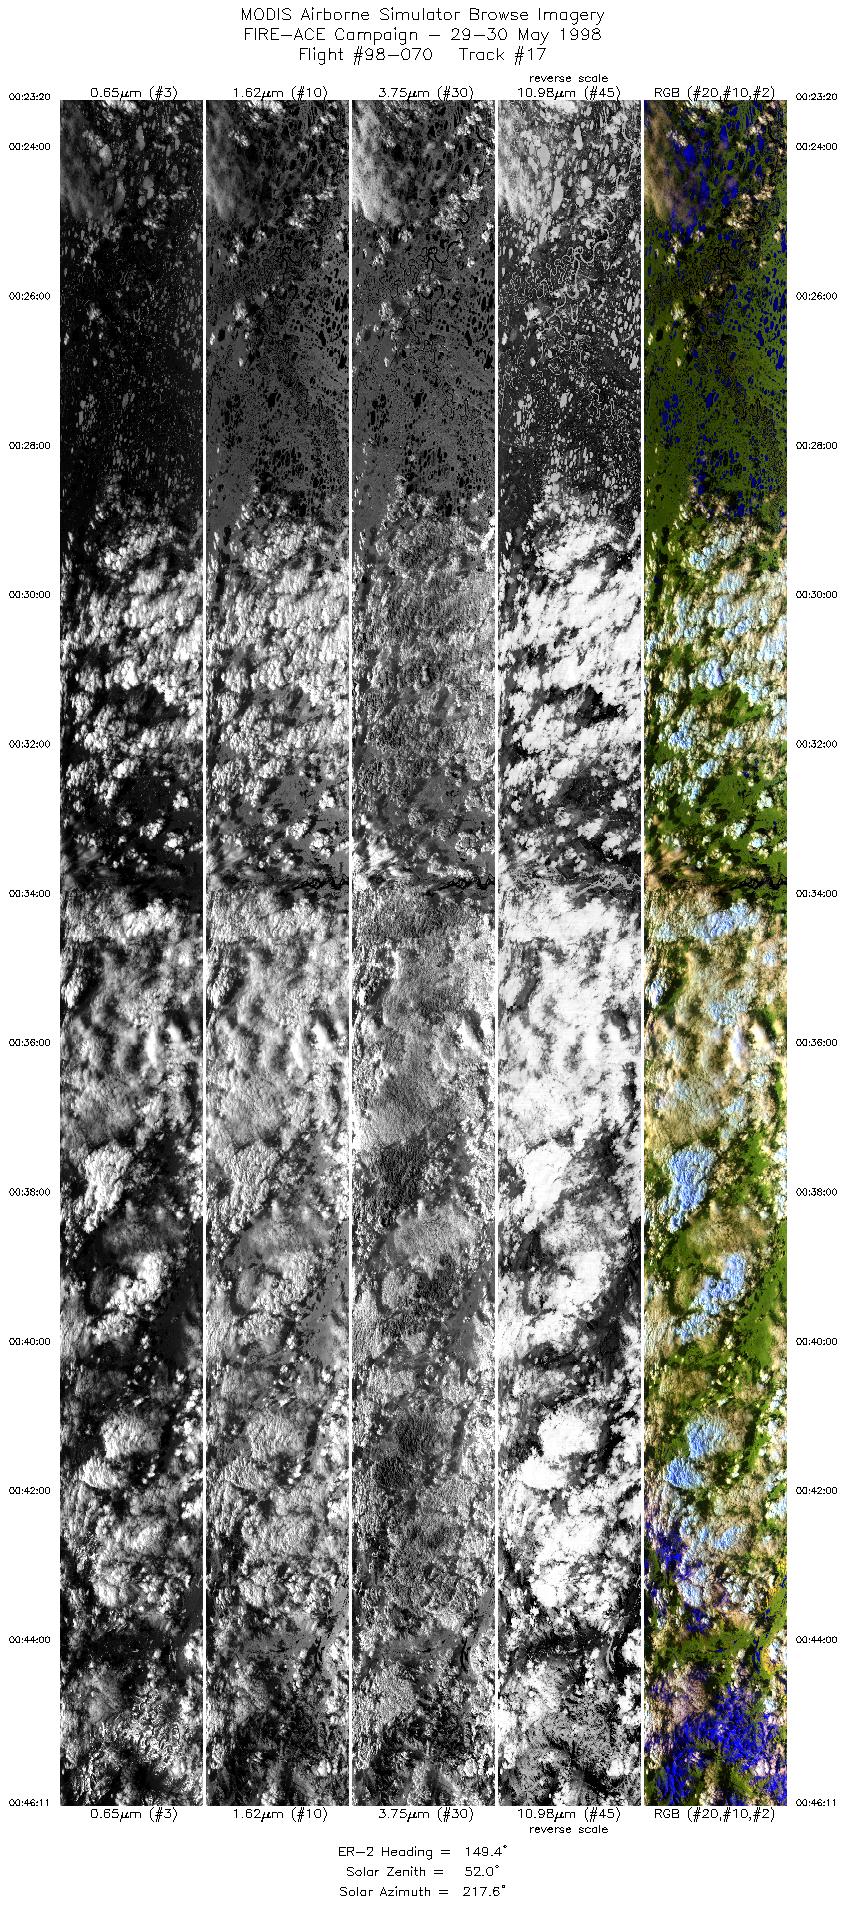
Browse Imagery
Flight Tracks: 17
Scanlines: 82080

Browse Imagery Table
Click a Flight Track number to view a quicklook image
Lat/Lon ranges are for the BEG-END scanline nadir pixels
Flight
Track
Time Span
(GMT)
Heading
(Deg)
Lat Range
(Deg North)
Lon Range
(Deg West)
Length
(scanlines)
Altitude
(meters)
1 19:55-20:09 335 67.33-68.74 150.49-152.36 5000 ~20000
2 20:09-20:22 335 68.73-70.13 152.34-154.47 5000 ~20000
3 20:22-20:35 331 70.13-71.50 154.48-156.91 5000 ~20000
4 20:35-20:49 330 71.50-72.82 156.91-159.70 5001 ~20000
5 20:49-21:02 327 72.82-74.12 159.69-162.96 4972 ~20000
6 21:02-21:13 324 74.12-75.11 162.97-165.96 3916 ~20000
7 21:13-21:14 319 75.11-75.21 166.01-166.32 387 ~20000
8 21:14-21:16 318 75.22-75.45 166.38-167.21 965 ~20000
9 21:17-21:37 352 75.52-77.82 167.30-169.05 7277 ~20000
10 21:43-21:57 169 78.06-76.53 169.50-168.01 5165 ~20000
11 21:58-22:07 259 76.40-76.18 168.57-172.83 3349 ~20000
12 22:10-22:30 77 76.43-76.88 172.89-163.16 7326 ~20000
13 22:37-22:59 264 76.93-76.40 162.43-173.10 8197 ~20000
14 23:05-23:17 76 76.33-76.68 173.93-168.14 4450 ~20000
15 23:18-23:34 145 76.63-75.22 167.55-163.33 5587 ~20000
16 23:34-23:39 153 75.19-74.67 163.31-162.19 1954 ~20000
17 00:23-00:46 149 70.16-67.92 155.04-151.41 8534 ~20000
View all Quicklooks in sequence
Flight Summary Report

Author: Steve Platnick
Mission Scientist: Steve Platnick
ER-2 Pilot: Bill Collette
Takeoff: 1930 (UTC)
Landing: 0140 (UTC)
Duration: 6:10 (h:mm)

Objective and Summary:

  • SHEBA ice camp (76°40'N, 168°09'W) in coordination with University of Washington CV-580 for remote sensing validation and cloud masking. Thick low clouds with scattered higher level clouds were expected over the SHEBA site during the mission.
  • The ER-2 flew a repeated cross pattern, with flight legs of about 260km in length, oriented perpendicular and parallel to the solar azimuth, while CV-580 attempted above and below-cloud bidirectional reflectance measurements and in situ profiles through the cloud.

Coordinations:

  • University of Washington CV-580 aircraft
  • F-14 satellite (2250 UTC)
  • NOAA satellite (2327 UTC)

Key Flight Legs:

  • After overflying the ARM site, the ER-2 flew a NW flight line toward the SHEBA ice station to begin the cross pattern with legs of about 260km in length. One-and-a-half flight legs were flown in a NW-SE orientation, followed by one-and-a-half flight legs in a perpendicular direction chosen such that the imaging instruments would be scanning into the solar plane. The ER-2 pilot had wings level during the F-14 overpass. The last leg over the ice station was at the time and heading of the NOAA-14 overpass. The return leg overflew the ARM site enroute back to Ft. Wainwright.
  • The CV-580 flew above the ARM site in coordination with the ER-2, making above and below-cloud bidirectional reflectance measurements and in situ profiles through the cloud. The CV-580 reported a stratocumulus deck with a top at about 2500ft. and about 1000ft. thick, with a little stratus below. They reported clear skies above the stratocumulus deck during ER-2 overpasses.
  • The AirMISR was turned on for 6 acquisitions: twice over the ARM site, three times over SHEBA, and once along the NOAA-14 flight leg. The AirMISR operated at the following times:
    • 2029-2041 (ARM site)
    • 2122-2134 UTC (SHEBA)
    • 2215-2227 UTC (SHEBA)
    • 2244-2256 UTC (SHEBA)
    • 2321-2334 UTC (NOAA-14 overpass)
    • 0007-0024 UTC (ARM)

Pilot Report:

  • The ER-2 pilot reported undercast conditions everywhere between Barrow and the ice station, and also throughout the ice station legs. Clear over Barrow on return leg.
  • The CV-580 pilot reported extensive low stratus between Barrow and the SHEBA ice camp on both outgoing and returning transits, with clear skies above. Higher level stratus observed at SHEBA.

Meteorology:

  • The SHEBA ice camp reported rain, temperatures around freezing, and winds Southeasterly at 8-12kts. A variety of clouds were reported from the surface up to 3.5km on the radar. Sounding and satellite images indicated moisture and cloud layers up to 7km. All cloud layers were broken including the boundary layer stratus with bases of 100, 250, and 500 meters on the ceilometer. It was expected that upper level clouds would begin to dissipate by mission time with lower level clouds remaining. Additional clearing was possible during the day.

Instrument Status:

  • AirMISR (Airborne Multi-angle Imaging Spectroradiometer): First five runs worked well, last run failed
  • AMPR (Advanced Microwave Precipitation Radiometer): Worked well
  • CLS (Cloud Lidar System): Worked well
  • HIS (High-resolution Interferometer Sounder): Possible problem during return leg
  • MAS (MODIS Airborne Simulator): Worked well
  • MIR (Millimeter-wave Imaging Radiometer): Worked well
  • SSFR (Solar Spectral Flux Radiometer): Worked well

page title background image

Flight 98-070

  • + HOME
  • + CAMPAIGNS
  • - MISSIONS
  • + ORDER DATA
  • + IMAGE GALLERY
  • + REFERENCE
  • + CONTACT US
Sample Imagery
Click image for full resolution
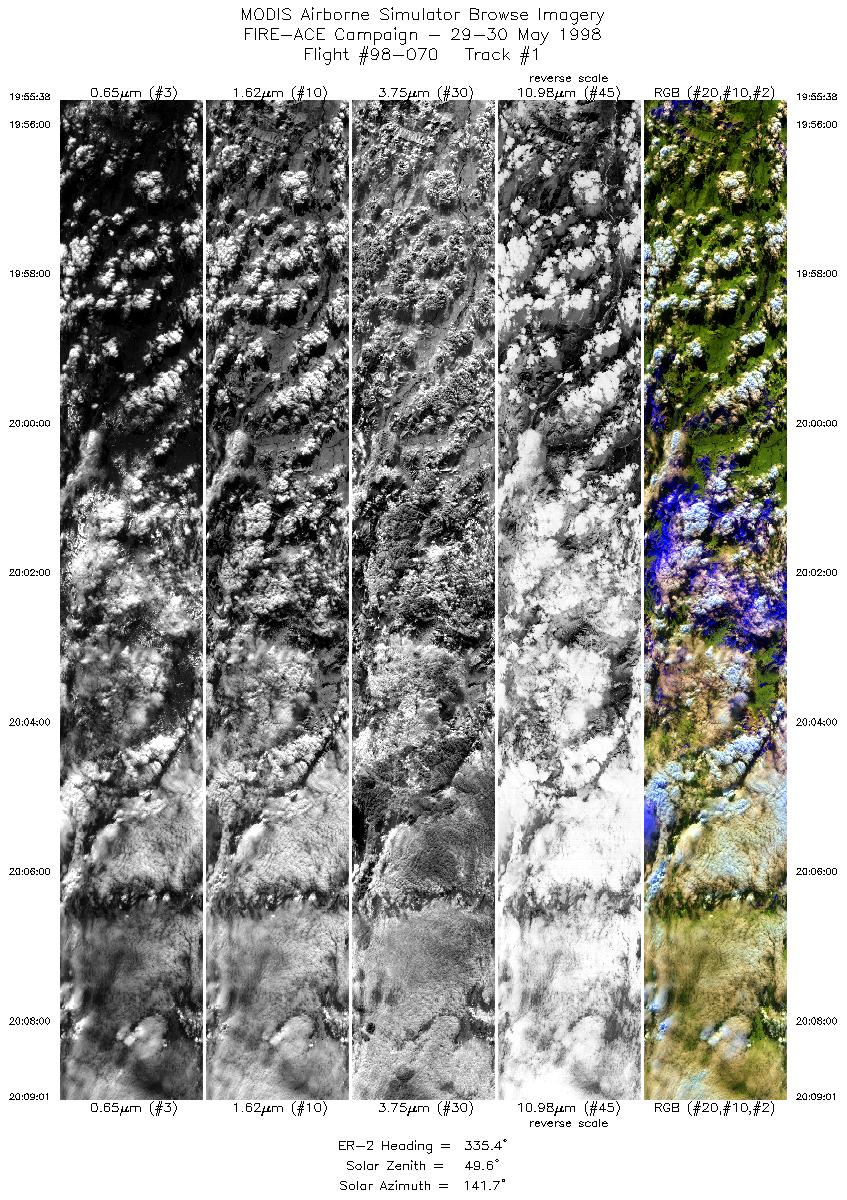
Track #1
Brooks Range, AK
Click to load the full resolution image Flight Direction Indicator
R: 2.13µm
G: 0.95µm
B: 0.65µm

Sample Imagery
Click image for full resolution
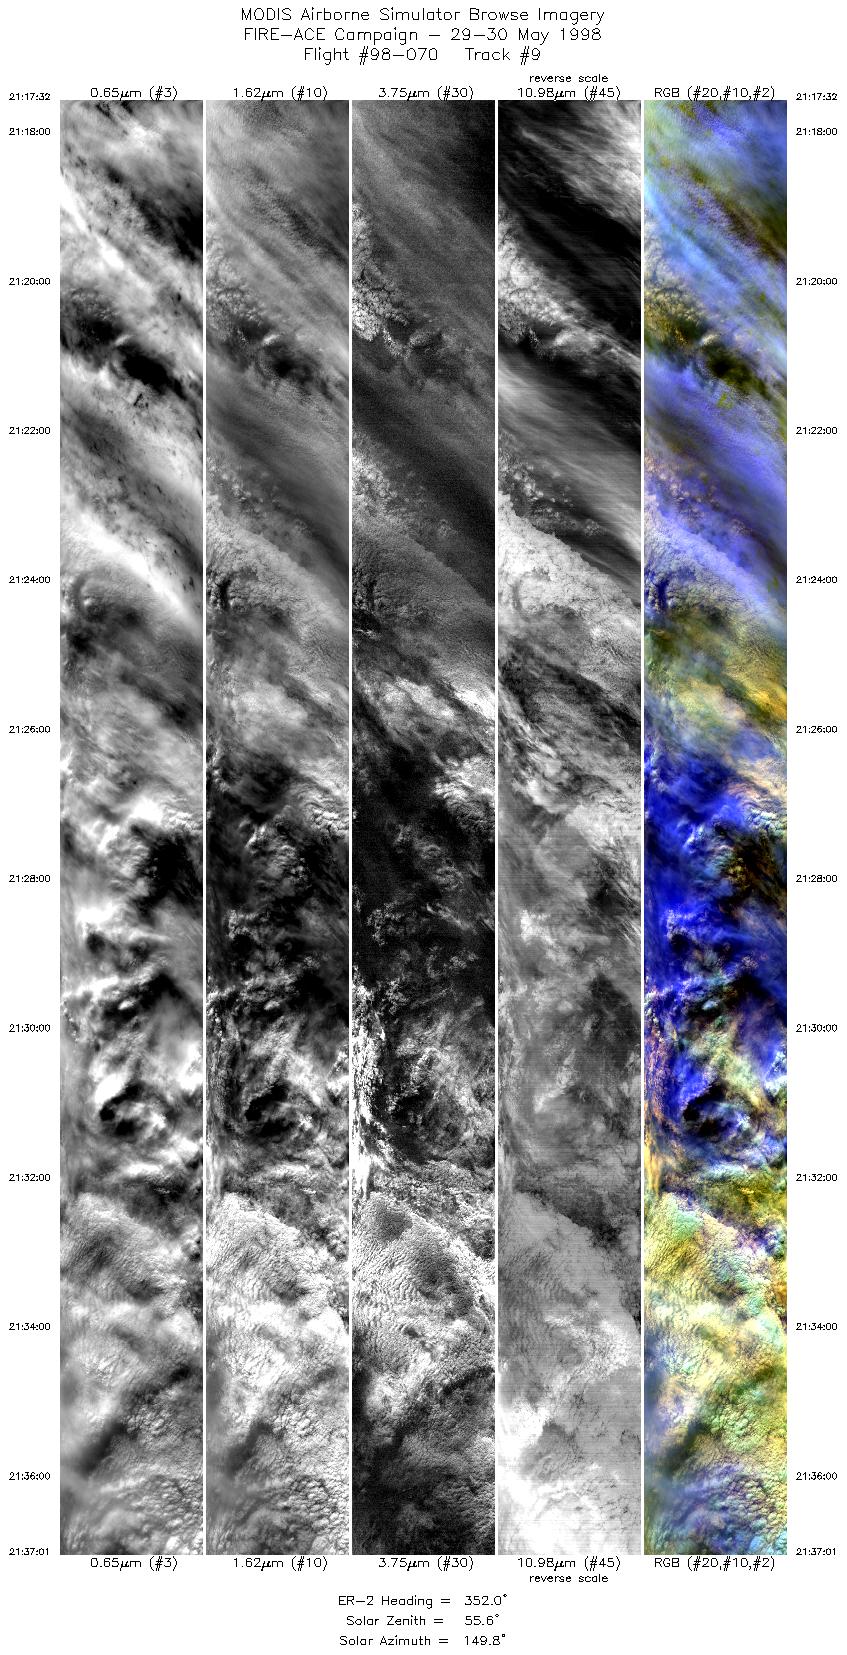
Track #9
Arctic Ocean
Click to load the full resolution image Flight Direction Indicator
R: 2.13µm
G: 0.95µm
B: 0.65µm