Flight: 19-916
Date: 16 Aug 2019
Location: Southwest USA
Deployment: FIREX-AQ
Principal Investigators: Dr. Steven Platnick (NASA GSFC)
Configuration: 38 Channel
Additional Sensors: FIREX-AQ Payload
|
Data Evaluation
Vis, NIR, and SWIR data quality is fair, no TIR channel data
|
Processing Information
Level-1B Data in HDF format is available upon request
Flight Line Summary
Spectral Band Configuration
Spectral Response Function Table
Spectral Response Function (text)
|
Browse Imagery
Flight Tracks: 20
Scanlines: 92972
|
Browse Imagery Table
|
Click a Flight Track number to view a quicklook image
Lat/Lon ranges are for the BEG-END scanline nadir pixels
|
Flight
Track |
Time Span
(UTC) |
Heading
(Deg) |
Lat Range
(Deg N) |
Lon Range
(Deg W) |
Length
(Scanlines) |
Altitude
(Meters) |
| 1 |
20:08 - 20:12 |
74.1 |
35.771 - 35.859 |
117.953 - 117.526 |
1239 |
18901 |
| 2 |
20:12 - 20:18 |
87.7 |
35.864 - 35.859 |
117.478 - 116.588 |
2422 |
19363 |
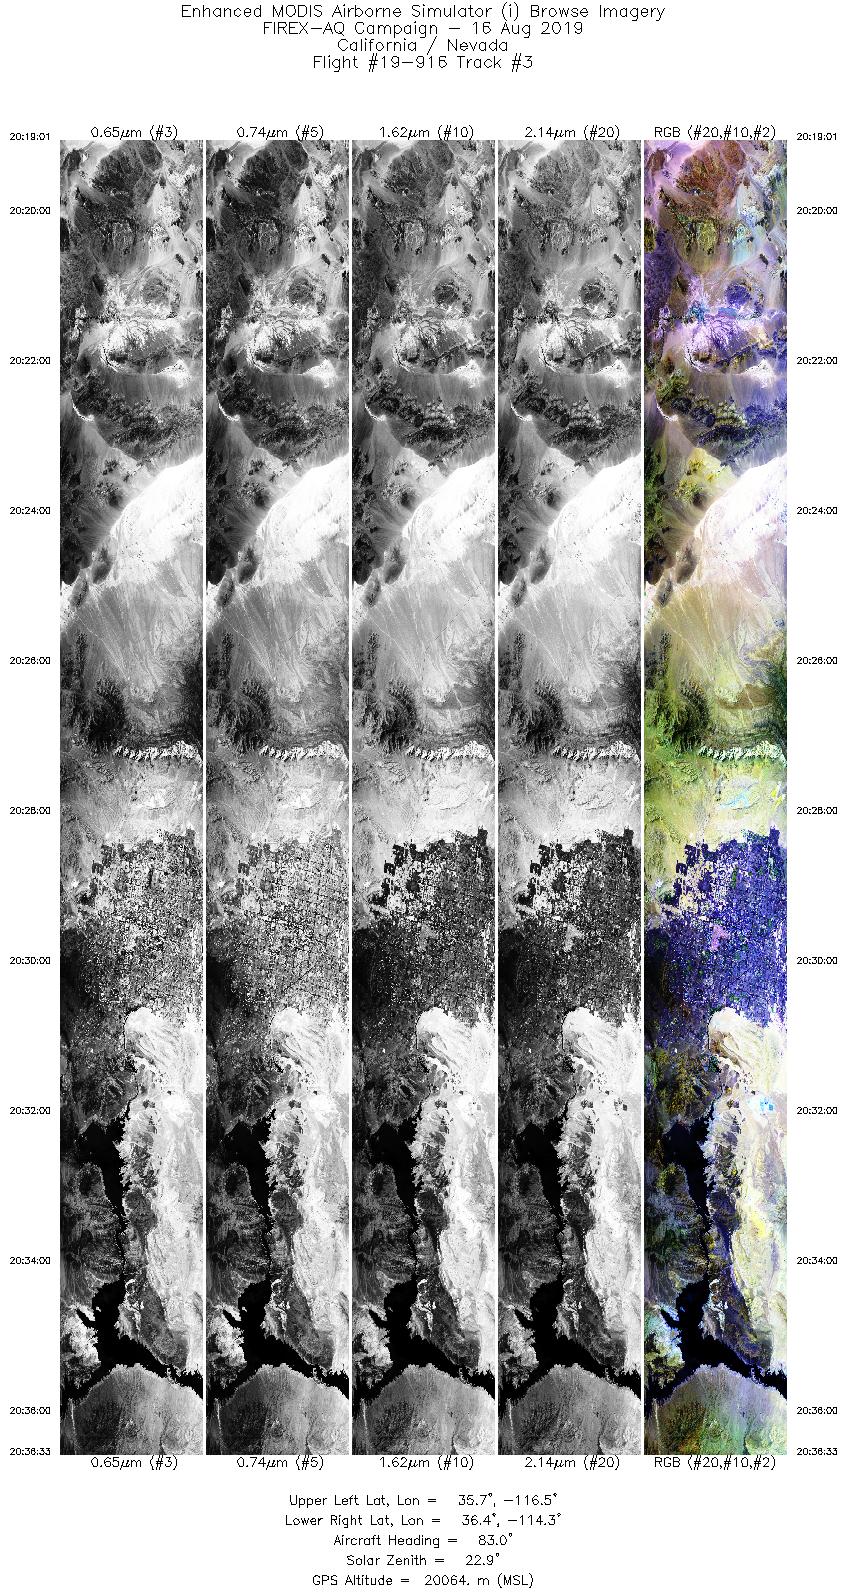
| 3 |
20:19 - 20:36 |
80.6 |
35.859 - 36.217 |
116.568 - 114.236 |
6578 |
19914 |
| 4 |
20:37 - 20:44 |
47.4 |
36.245 - 36.744 |
114.164 - 113.447 |
2611 |
20186 |
| 5 |
20:44 - 21:00 |
103.7 |
36.765 - 36.347 |
113.337 - 111.329 |
5649 |
20281 |
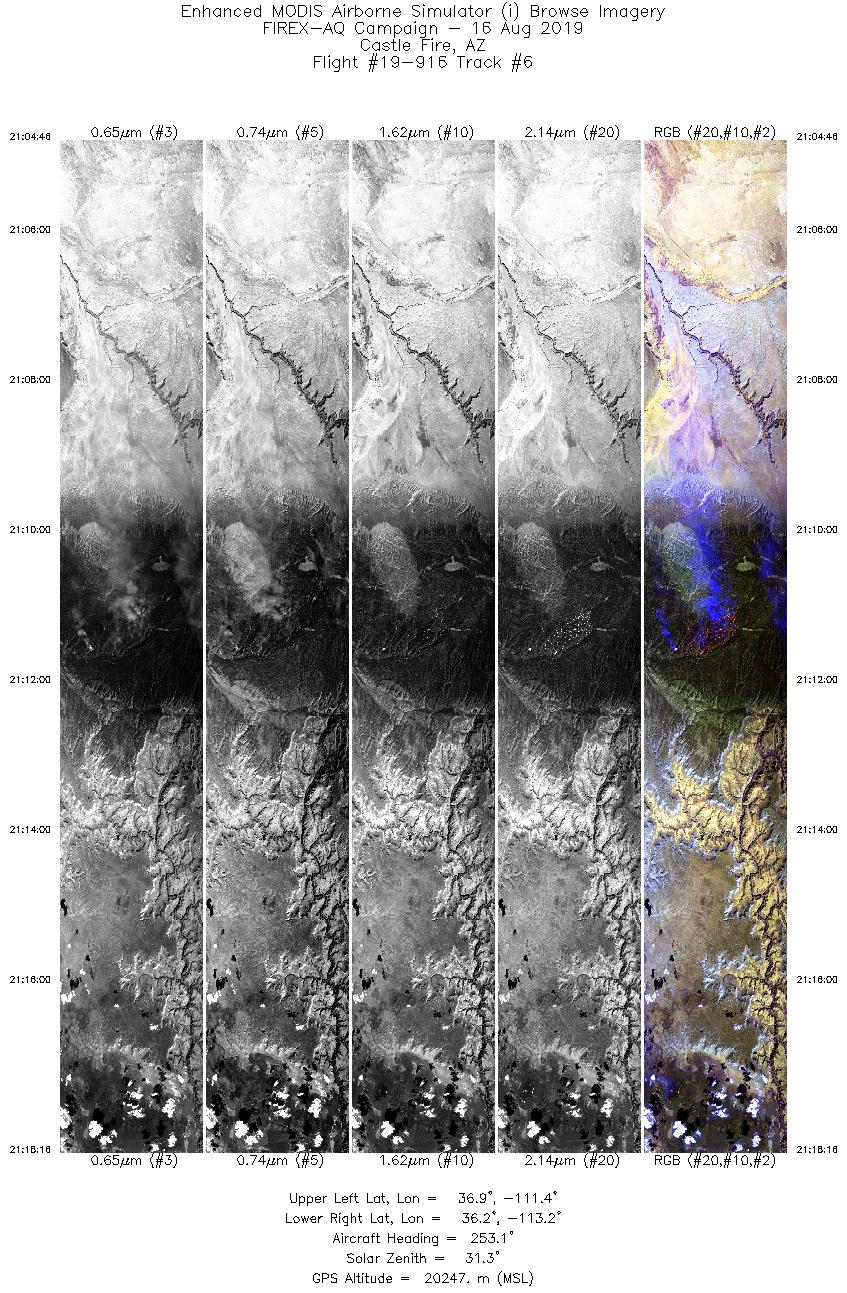
| 6 |
21:04 - 21:18 |
253.1 |
36.698 - 36.308 |
111.365 - 113.216 |
5067 |
20269 |
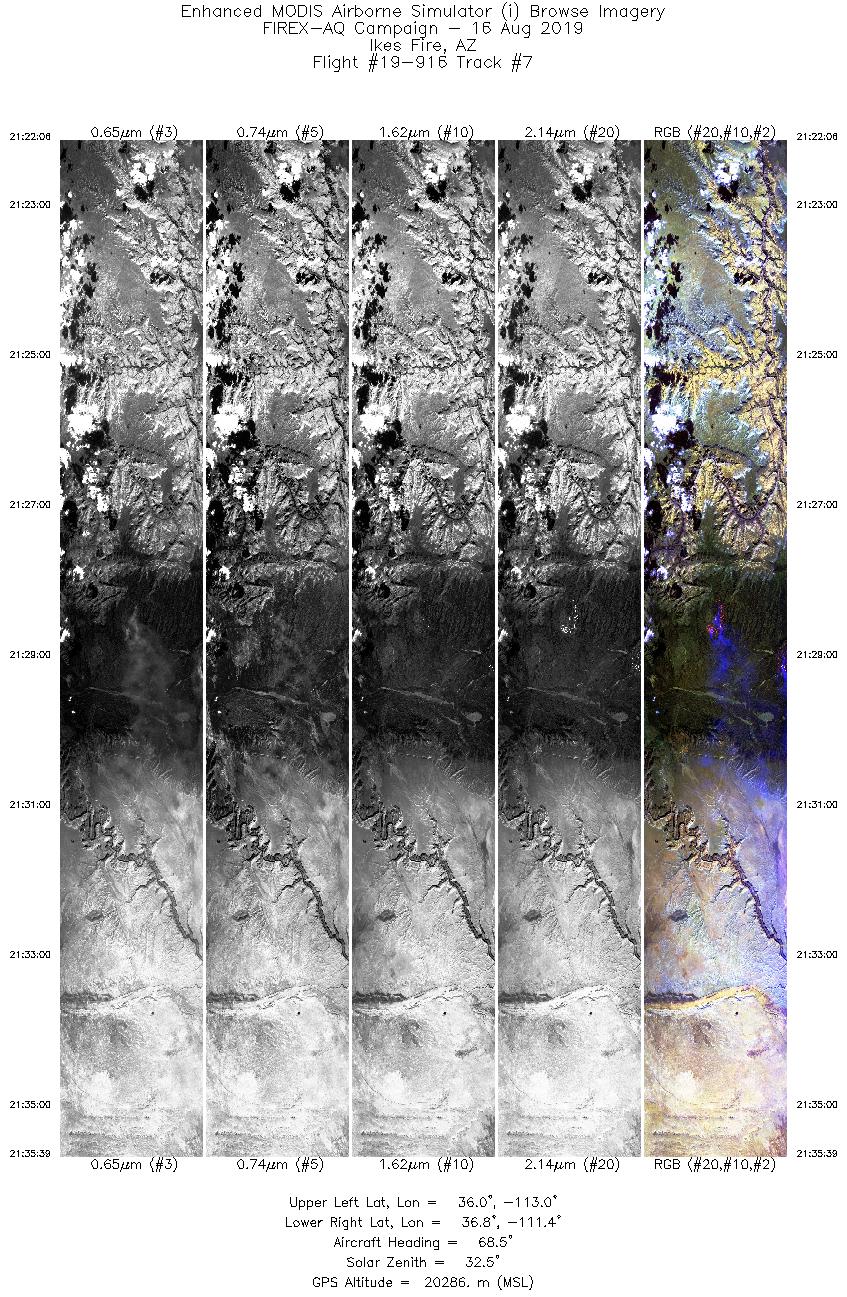
| 7 |
21:22 - 21:35 |
68.5 |
36.101 - 36.630 |
113.079 - 111.336 |
5087 |
20264 |
| 8 |
21:38 - 21:50 |
247.7 |
36.844 - 36.338 |
111.432 - 113.010 |
4523 |
20293 |
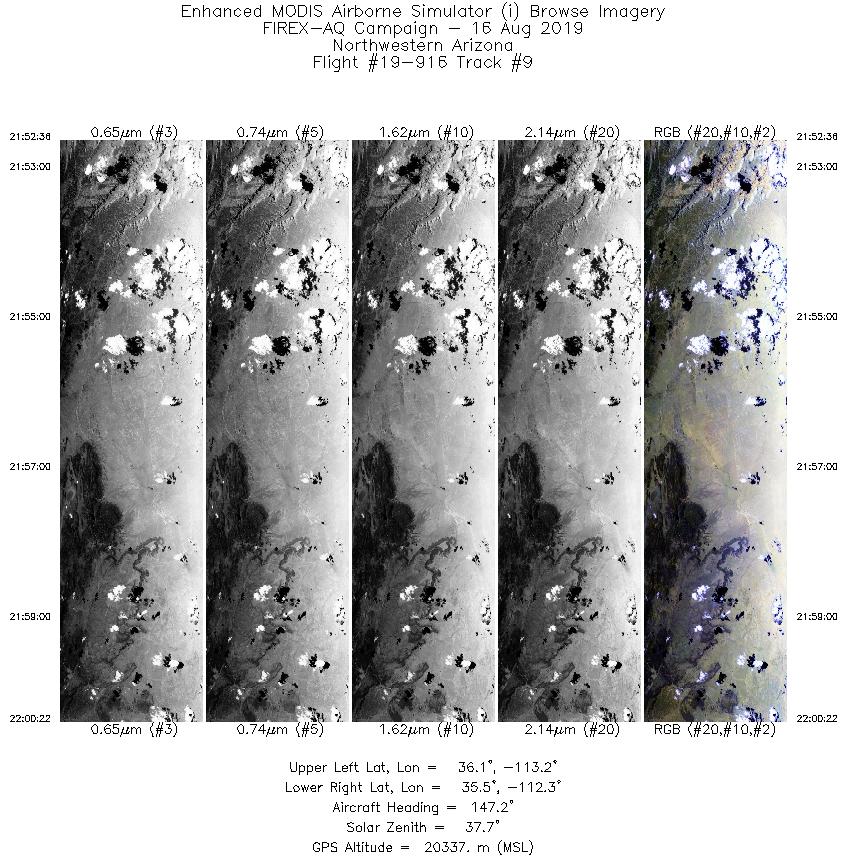
| 9 |
21:52 - 22:00 |
146.5 |
36.183 - 35.431 |
113.031 - 112.483 |
2914 |
20365 |
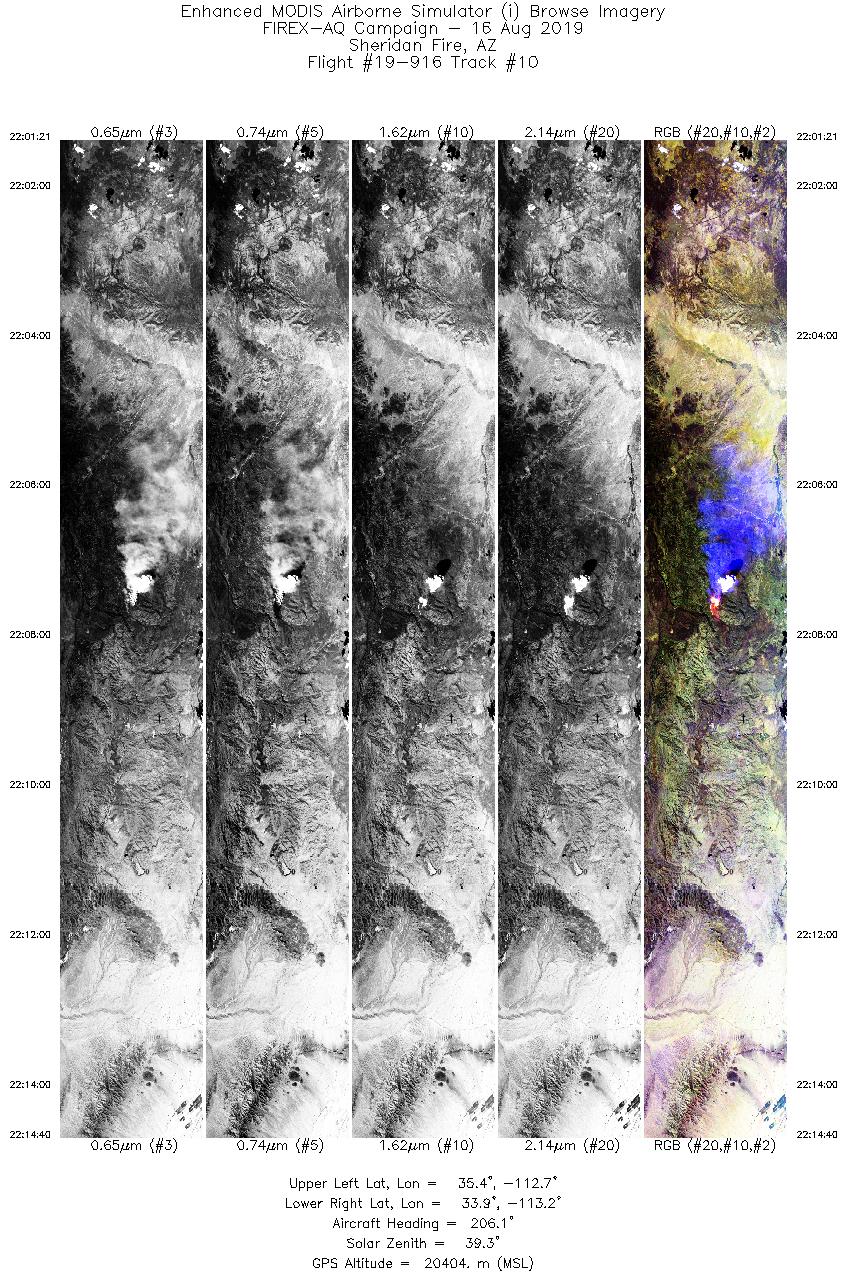
| 10 |
22:01 - 22:14 |
205.9 |
35.327 - 33.986 |
112.478 - 113.362 |
4994 |
20471 |
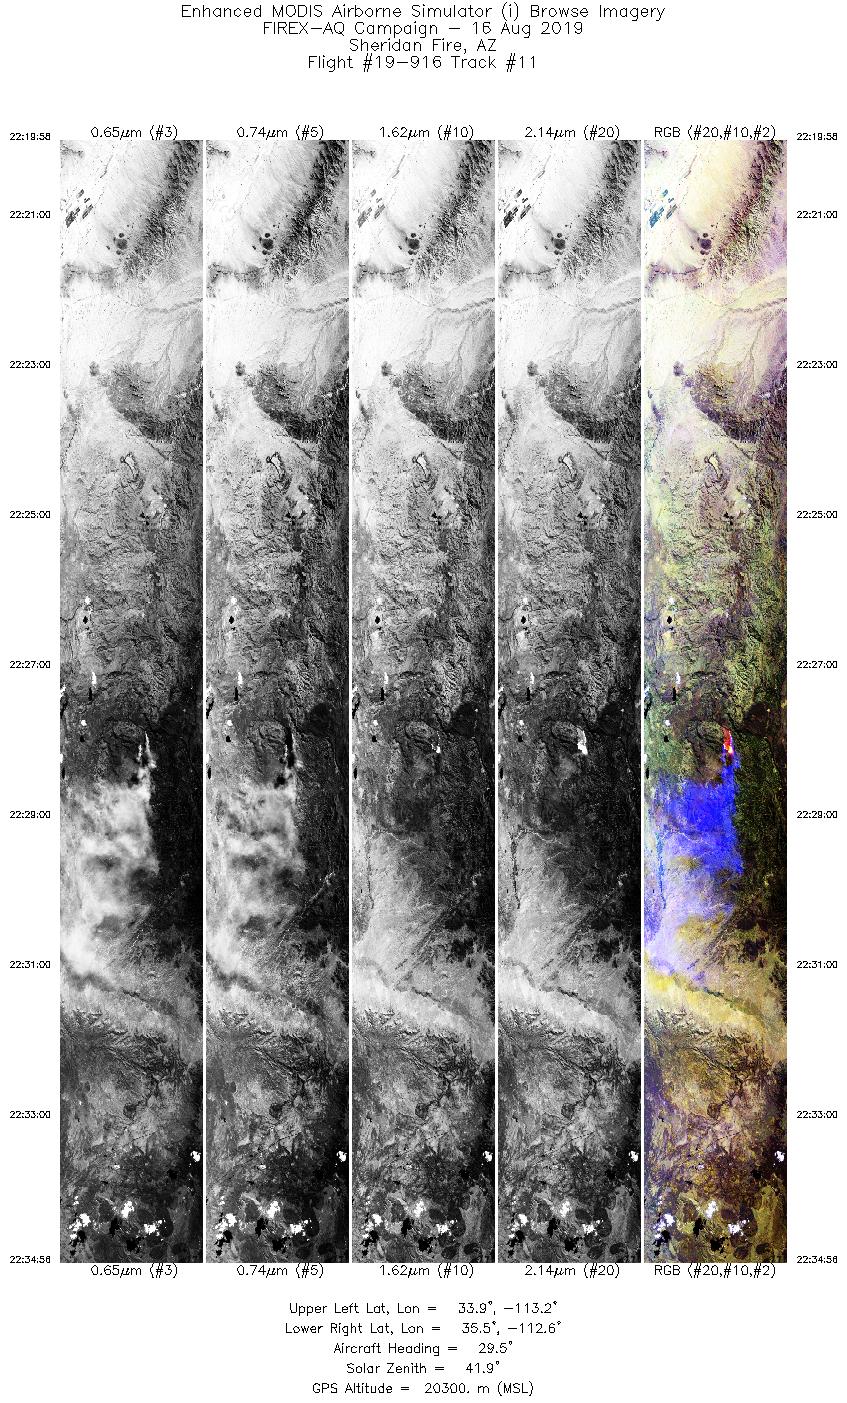
| 11 |
22:19 - 22:34 |
27.3 |
33.927 - 35.384 |
113.385 - 112.437 |
5617 |
20209 |
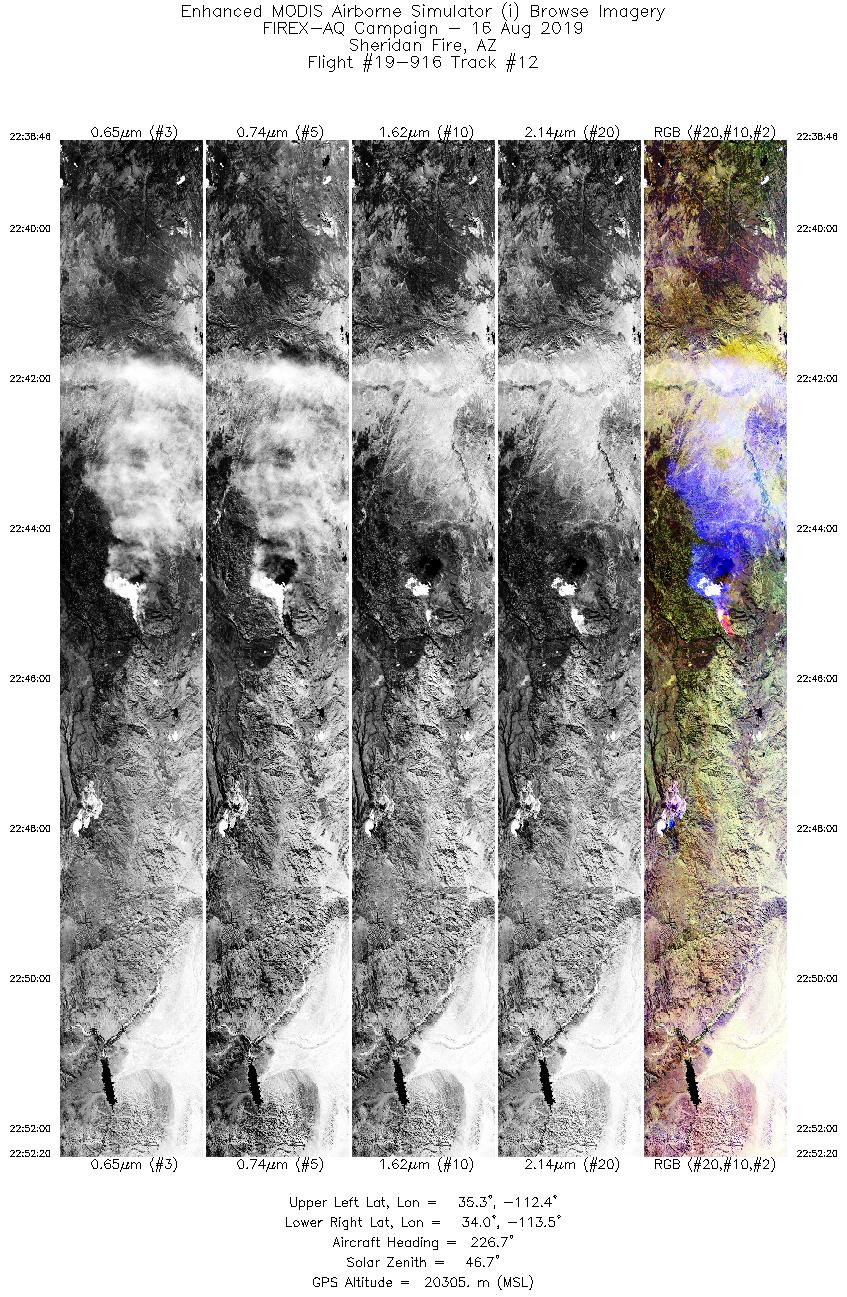
| 12 |
22:38 - 22:52 |
226.0 |
35.219 - 34.159 |
112.248 - 113.633 |
5089 |
20285 |
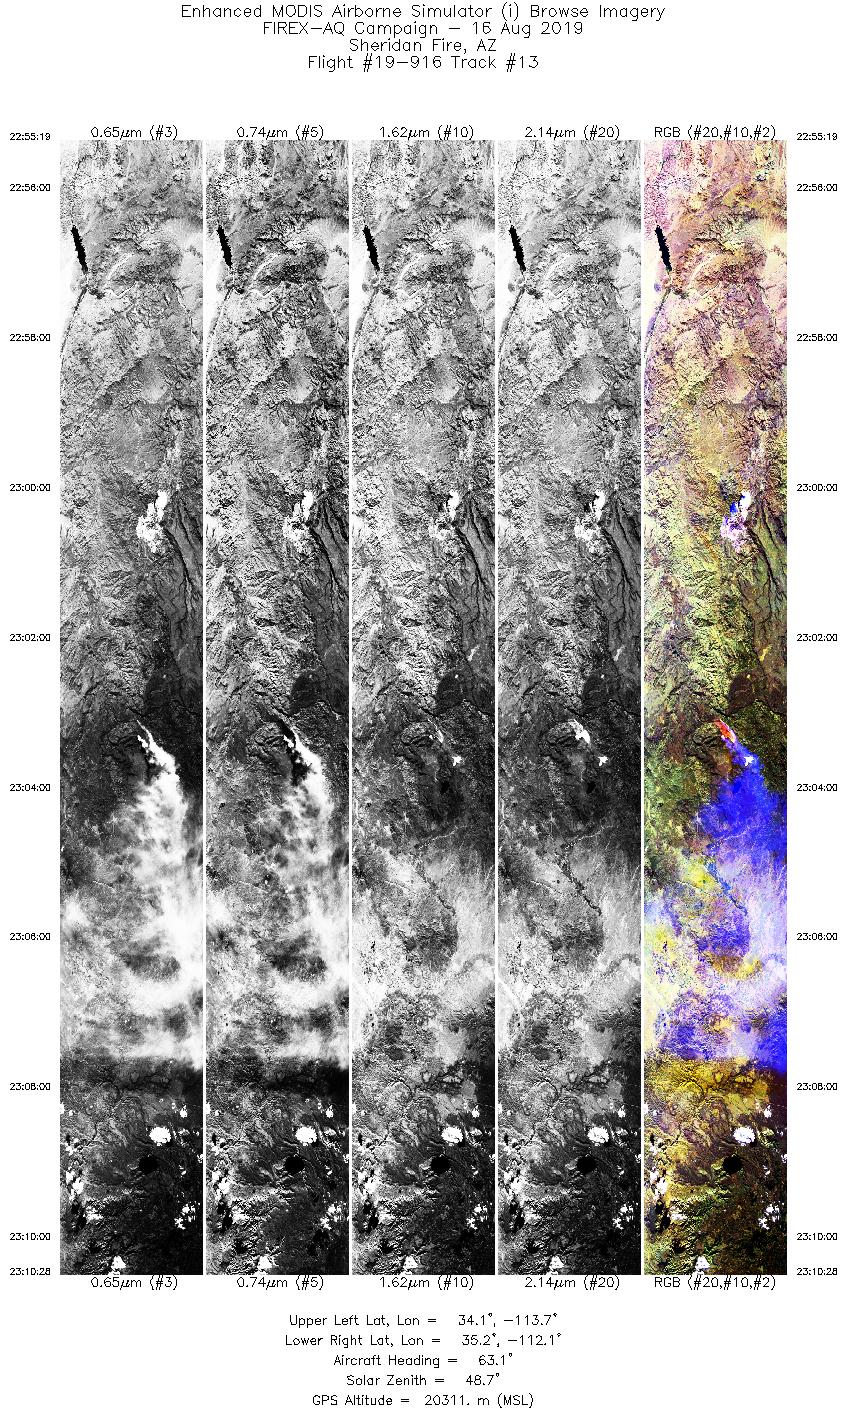
| 13 |
22:55 - 23:10 |
62.3 |
34.296 - 35.057 |
113.804 - 112.008 |
5679 |
20295 |
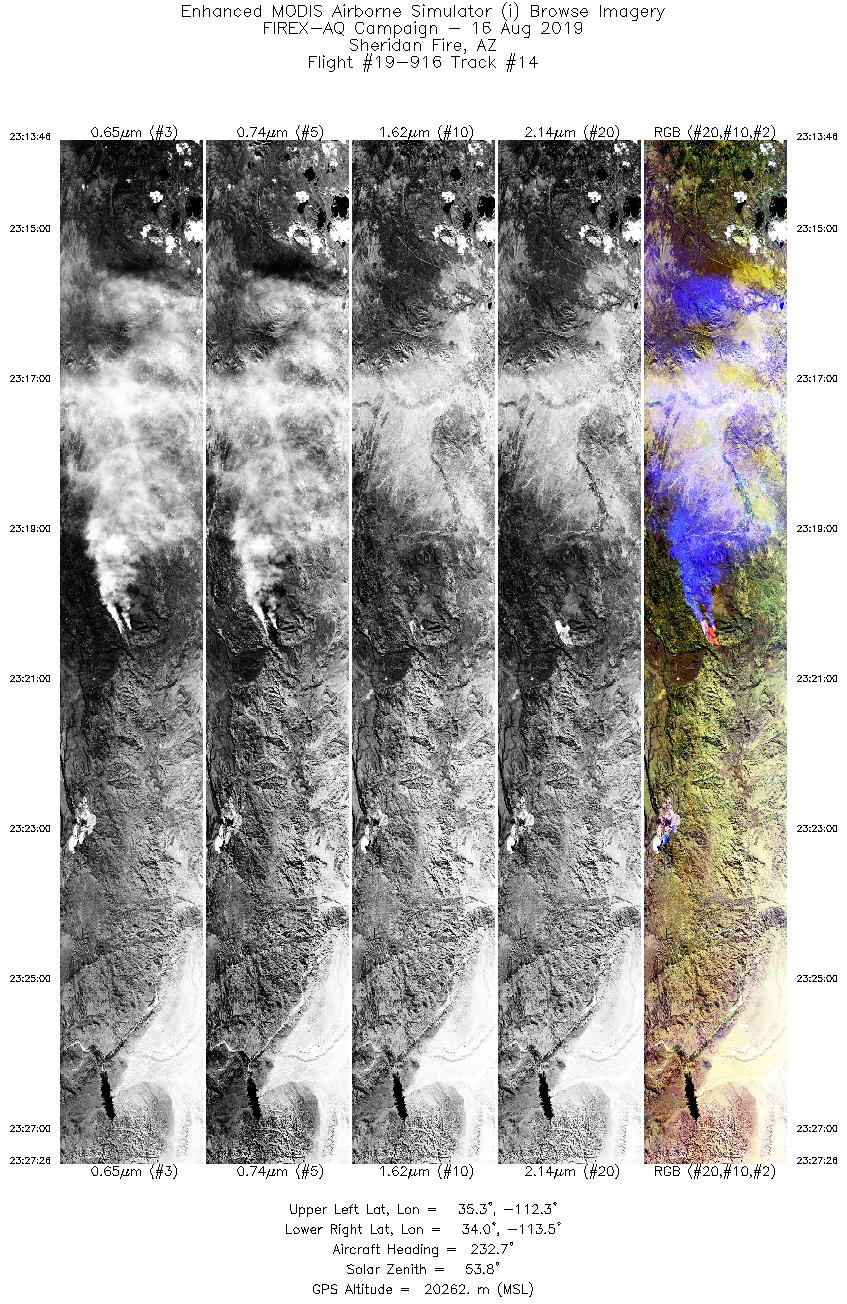
| 14 |
23:13 - 23:27 |
230.2 |
35.182 - 34.164 |
112.180 - 113.625 |
5124 |
20236 |
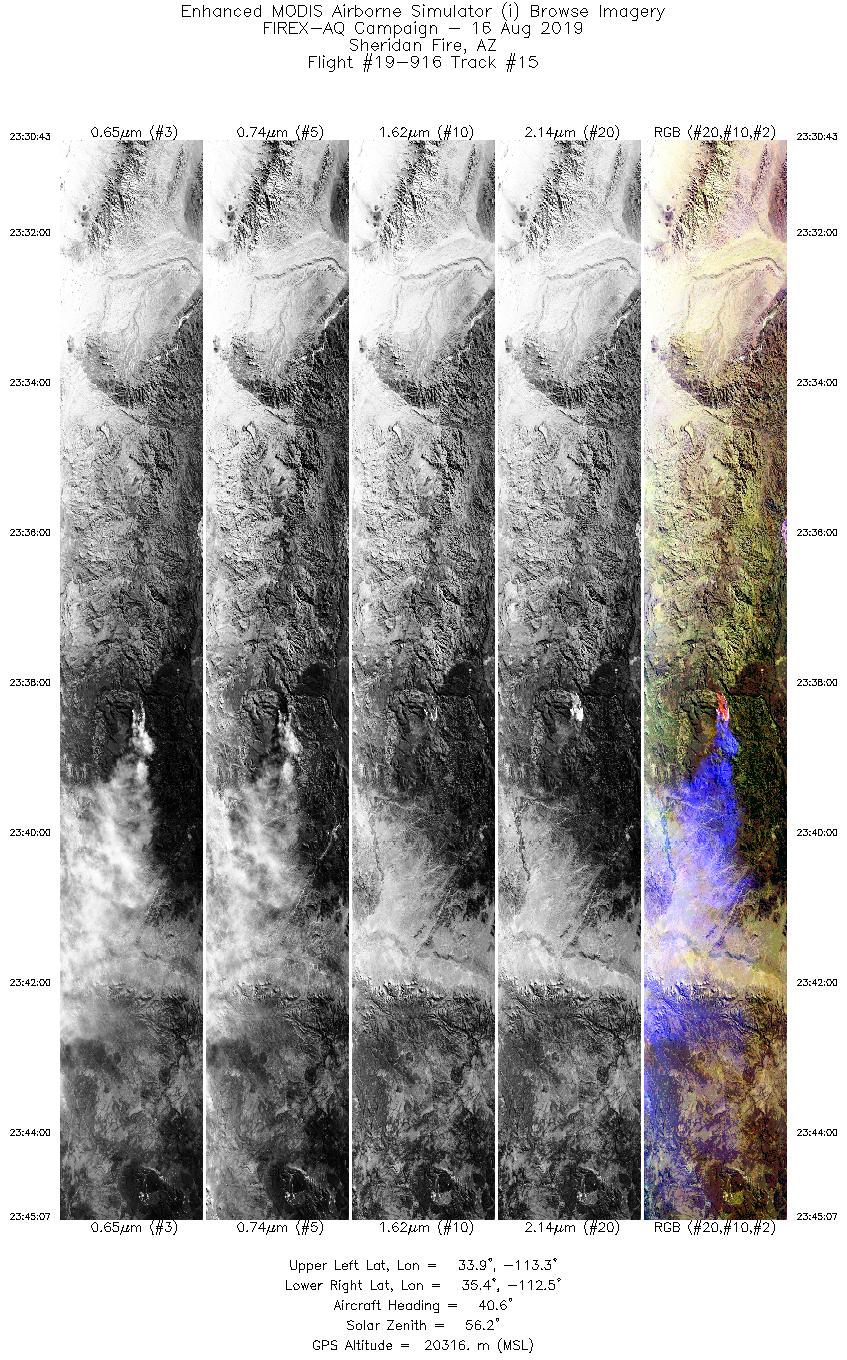
| 15 |
23:30 - 23:45 |
36.6 |
34.018 - 35.318 |
113.448 - 112.351 |
5400 |
20309 |
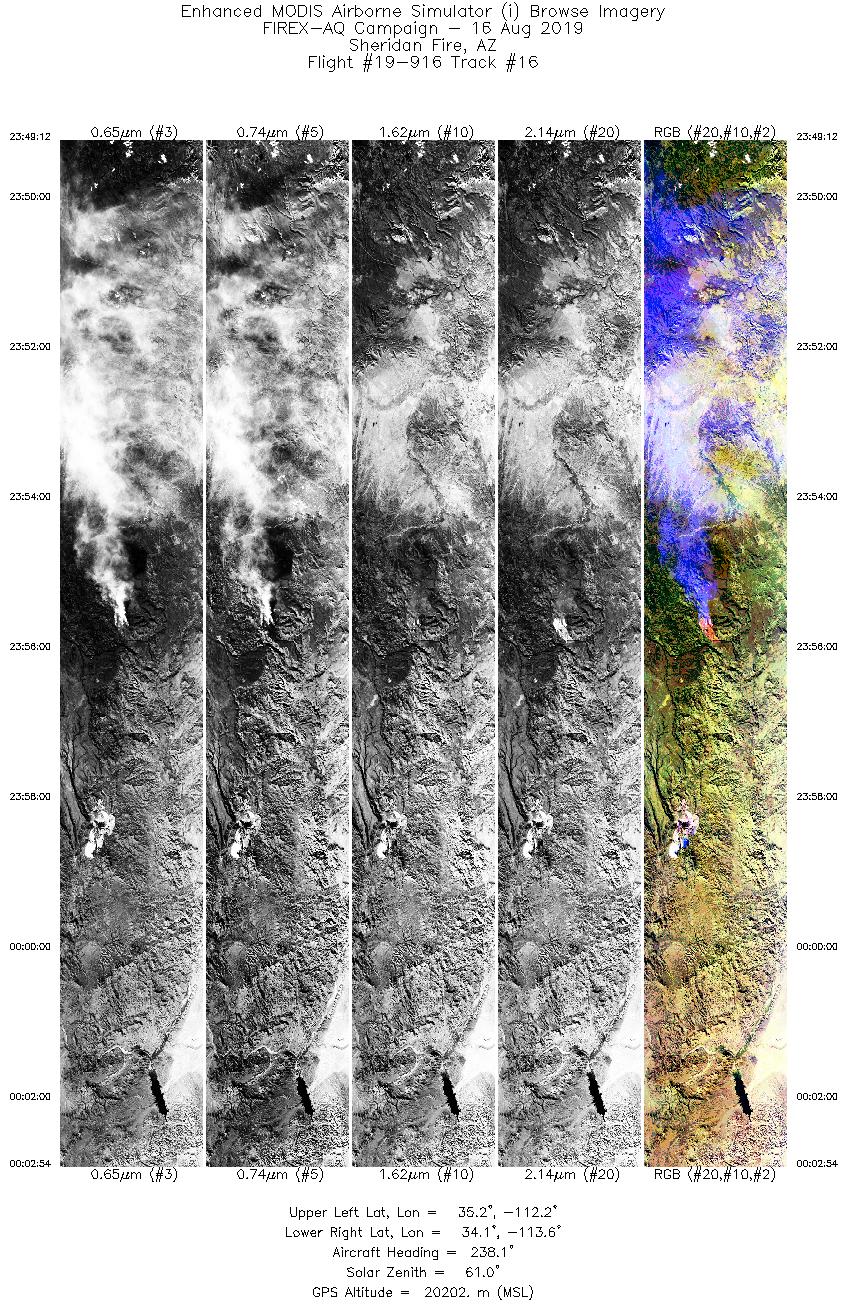
| 16 |
23:49 - 00:02 |
237.2 |
35.091 - 34.250 |
112.110 - 113.714 |
5138 |
20208 |
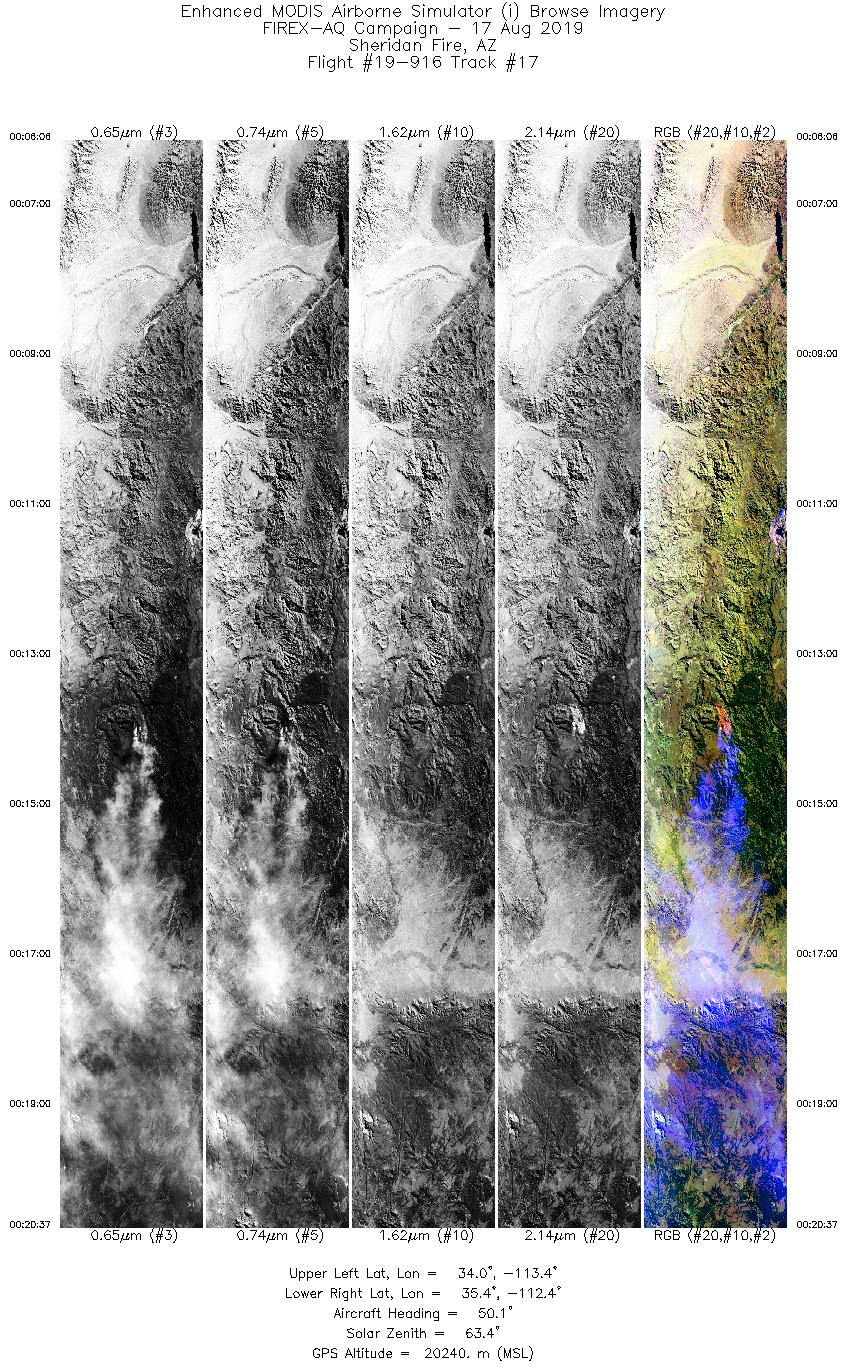
| 17 |
00:06 - 00:20 |
44.8 |
34.077 - 35.248 |
113.564 - 112.262 |
5442 |
20246 |
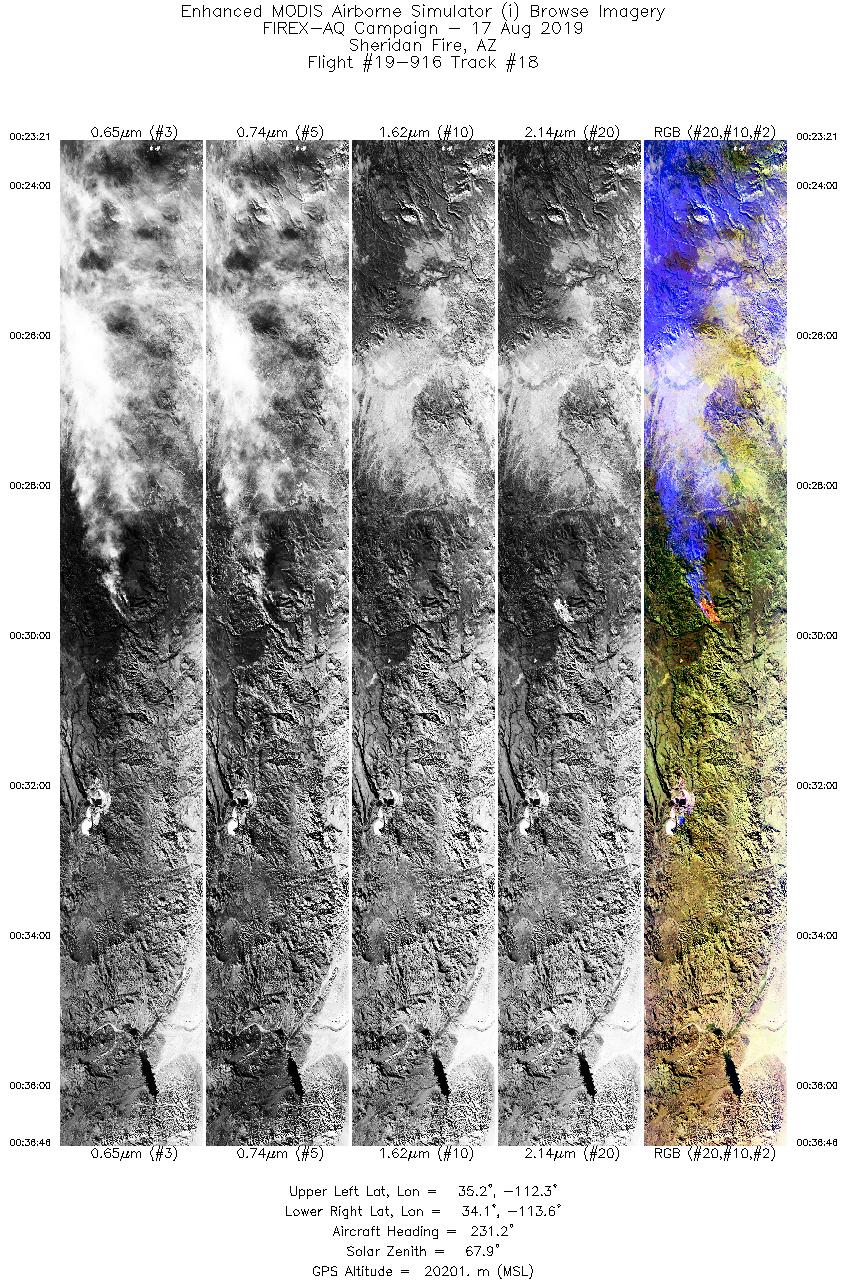
| 18 |
00:23 - 00:36 |
232.6 |
35.099 - 34.232 |
112.154 - 113.698 |
5031 |
20194 |
| 19 |
00:40 - 00:54 |
43.1 |
34.086 - 35.257 |
113.527 - 112.275 |
5357 |
20203 |
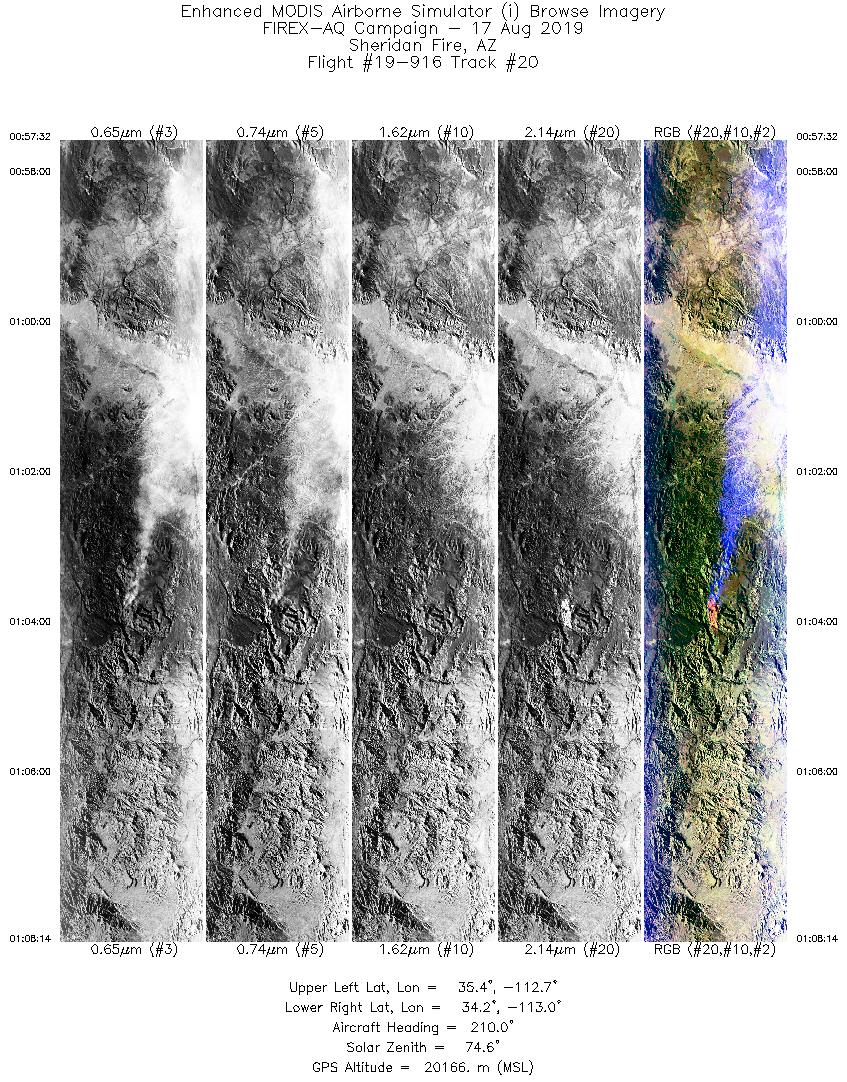
| 20 |
00:57 - 01:08 |
206.0 |
35.357 - 34.250 |
112.497 - 113.140 |
4011 |
20232 |
|
Wildfire Imagery
|
| Wildfire |
Date |
Time (UTC) |
Flight: Track |
Lat |
Lon |
| Castle Fire |
8/16/2019 |
20:53 |
19-916: 05 |
36.53116 |
-112.22810 |
| Castle Fire |
8/16/2019 |
21:11 |
19-916: 06 |
36.53116 |
-112.22810 |
| Ikes Fire |
8/16/2019 |
21:29 |
19-916: 07 |
36.34793 |
-112.28560 |
| Castle Fire |
8/16/2019 |
21:45 |
19-916: 08 |
36.53116 |
-112.22810 |
| Sheridan Fire |
8/16/2019 |
22:08 |
19-916: 10 |
34.67778 |
-112.89030 |
| Sheridan Fire |
8/16/2019 |
22:28 |
19-916: 11 |
34.67778 |
-112.89030 |
| Sheridan Fire |
8/16/2019 |
22:45 |
19-916: 12 |
34.67778 |
-112.89030 |
| Sheridan Fire |
8/16/2019 |
23:03 |
19-916: 13 |
34.67778 |
-112.89030 |
| Sheridan Fire |
8/16/2019 |
23:20 |
19-916: 14 |
34.67778 |
-112.89030 |
| Sheridan Fire |
8/16/2019 |
23:38 |
19-916: 15 |
34.67778 |
-112.89030 |
| Sheridan Fire |
8/16/2019 |
23:56 |
19-916: 16 |
34.67778 |
-112.89030 |
| Sheridan Fire |
8/17/2019 |
00:14 |
19-916: 17 |
34.67778 |
-112.89030 |
| Sheridan Fire |
8/17/2019 |
00:30 |
19-916: 18 |
34.67778 |
-112.89030 |
| Sheridan Fire |
8/17/2019 |
00:47 |
19-916: 19 |
34.67778 |
-112.89030 |
| Sheridan Fire |
8/17/2019 |
01:04 |
19-916: 20 |
34.67778 |
-112.89030 |
|
Satellite Overpasses
|
| Satellite |
Date |
Time (UTC) |
Flight: Track |
| TROPOMI |
8/16/2019 |
~20:25 |
19-916: 03 |
|


