


FLIGHT SUMMARY INFORMATION
Flight Track Map


|
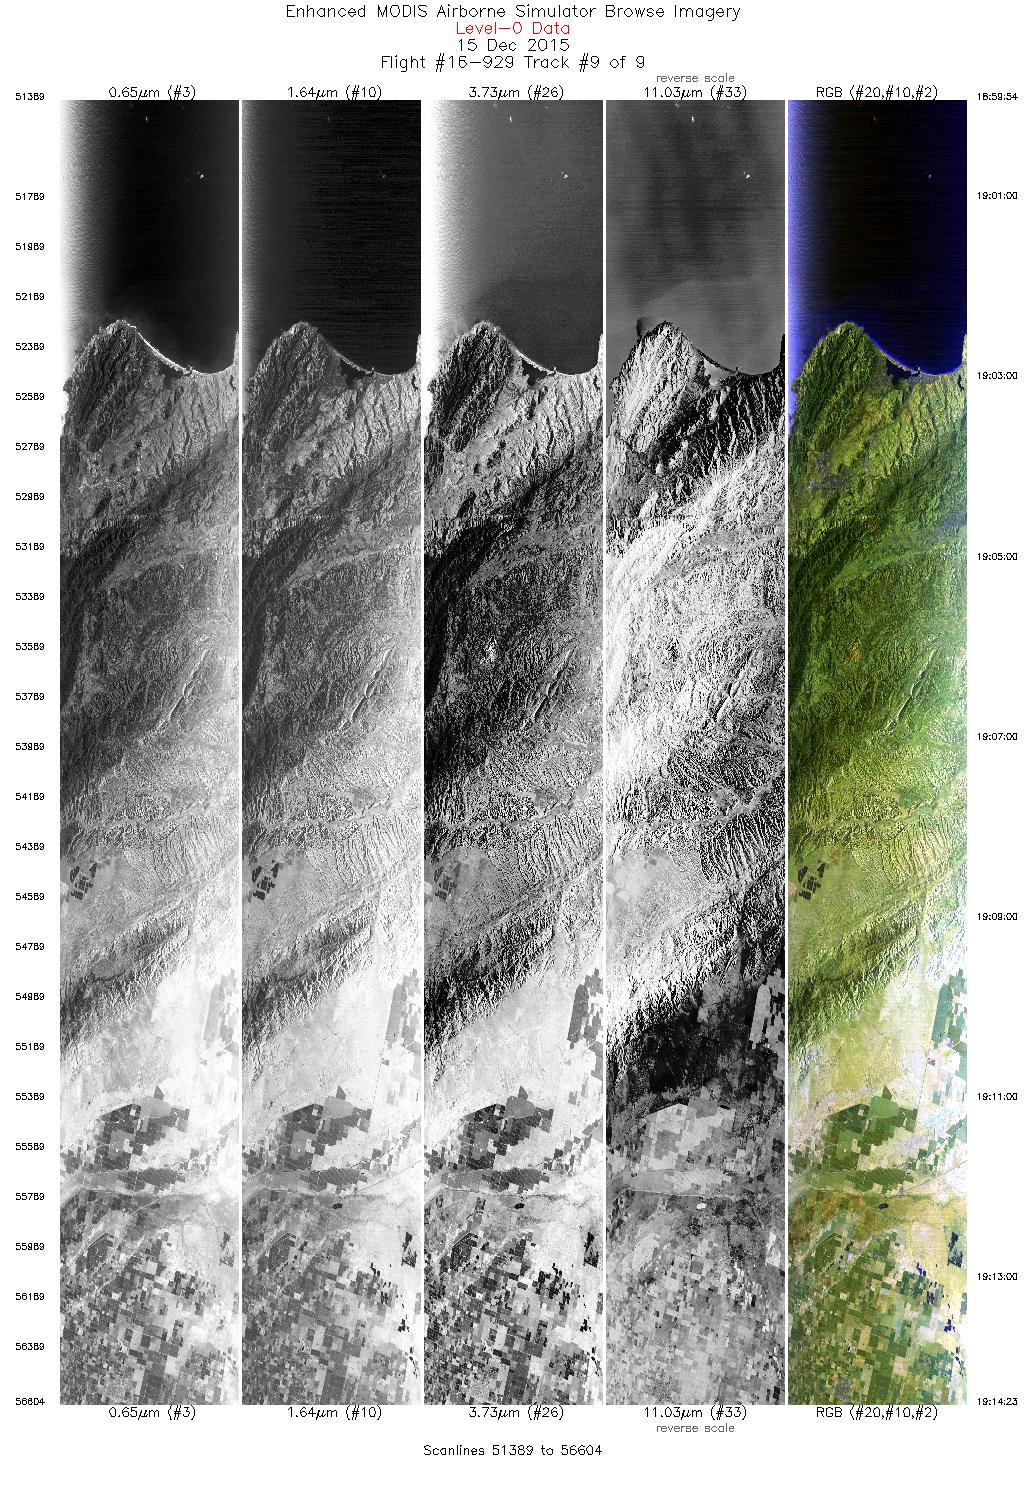
Flight: 16-929 Date: 15 Dec 2015 Location: West Coast States / Pacific Ocean Deployment: RADEX (OLYMPEX) Principal Investigators: Dr. Steven Platnick (NASA GSFC) Configuration: 38 Channel Additional Sensors: AMPR / CPL / CRS / EXRAD / HiWRAP |
|||||||||||||||||||||||||||||||||||||||||||||||||||||||||||||||||||||||||||||||||||||||||||
|
Data Evaluation Overall quality is fair |
|||||||||||||||||||||||||||||||||||||||||||||||||||||||||||||||||||||||||||||||||||||||||||
|
Processing Information Level-1B Data in HDF format is available Flight Line Summary Spectral Band Configuration Spectral Response Function Table Spectral Response Function (text) |
|||||||||||||||||||||||||||||||||||||||||||||||||||||||||||||||||||||||||||||||||||||||||||
|
Browse Imagery Flight Tracks: 9 Scanlines: 34179 |
|||||||||||||||||||||||||||||||||||||||||||||||||||||||||||||||||||||||||||||||||||||||||||
|
|||||||||||||||||||||||||||||||||||||||||||||||||||||||||||||||||||||||||||||||||||||||||||

Flight 16-929


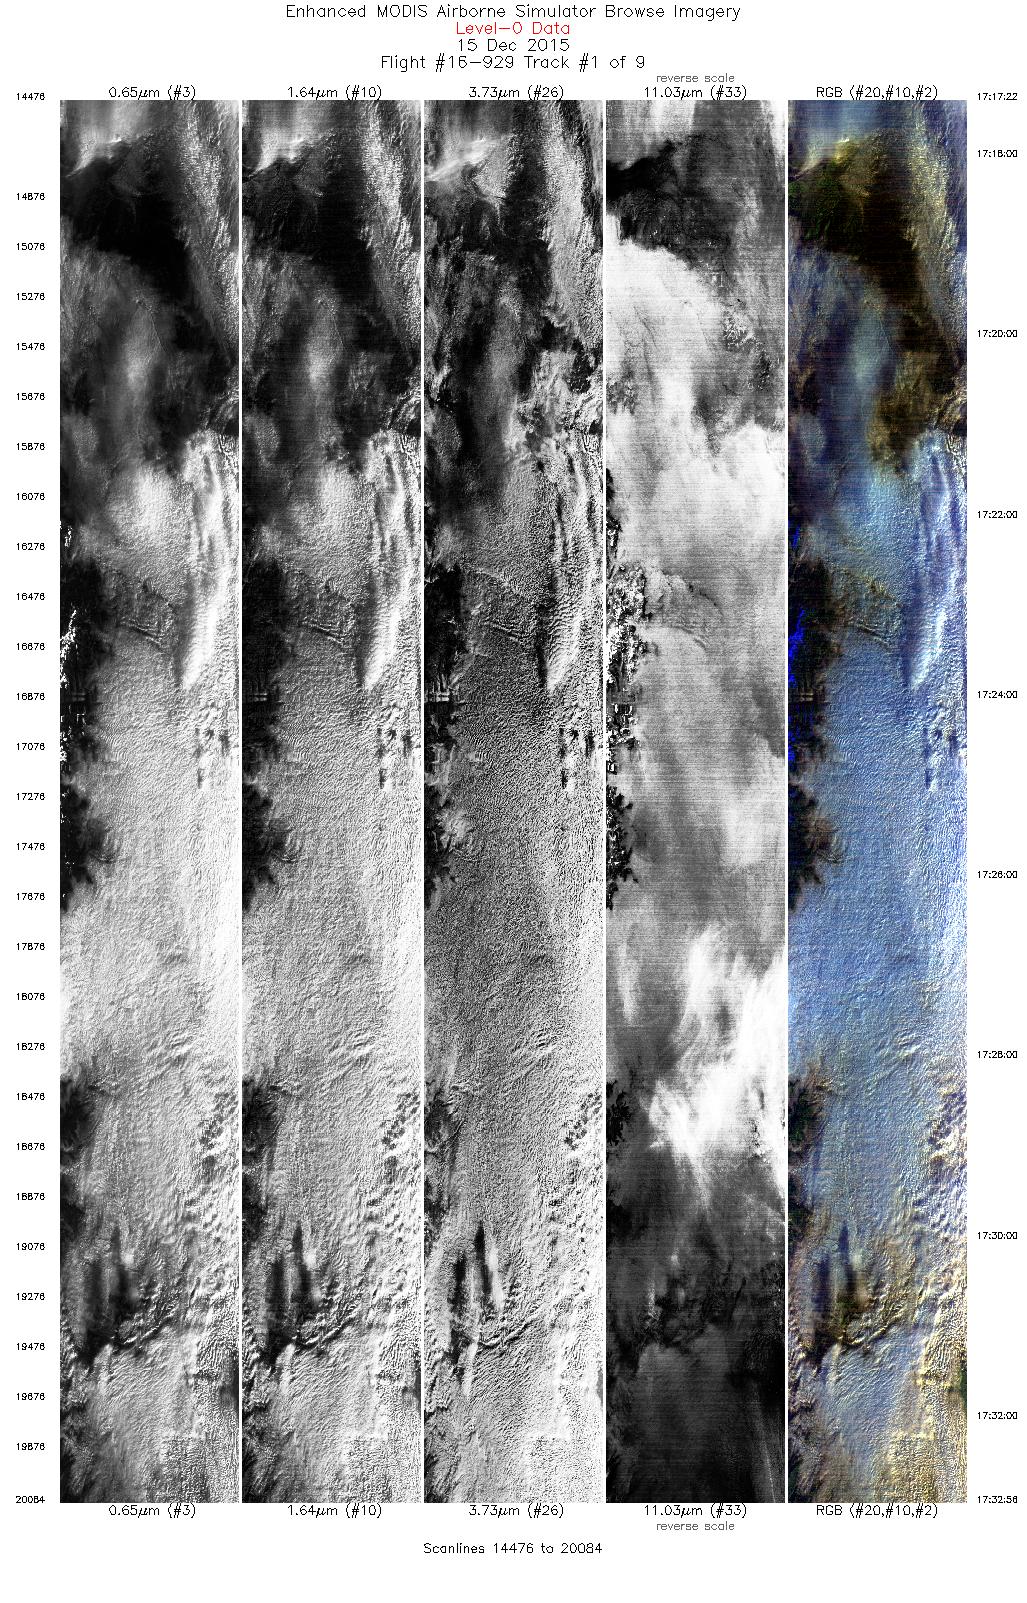
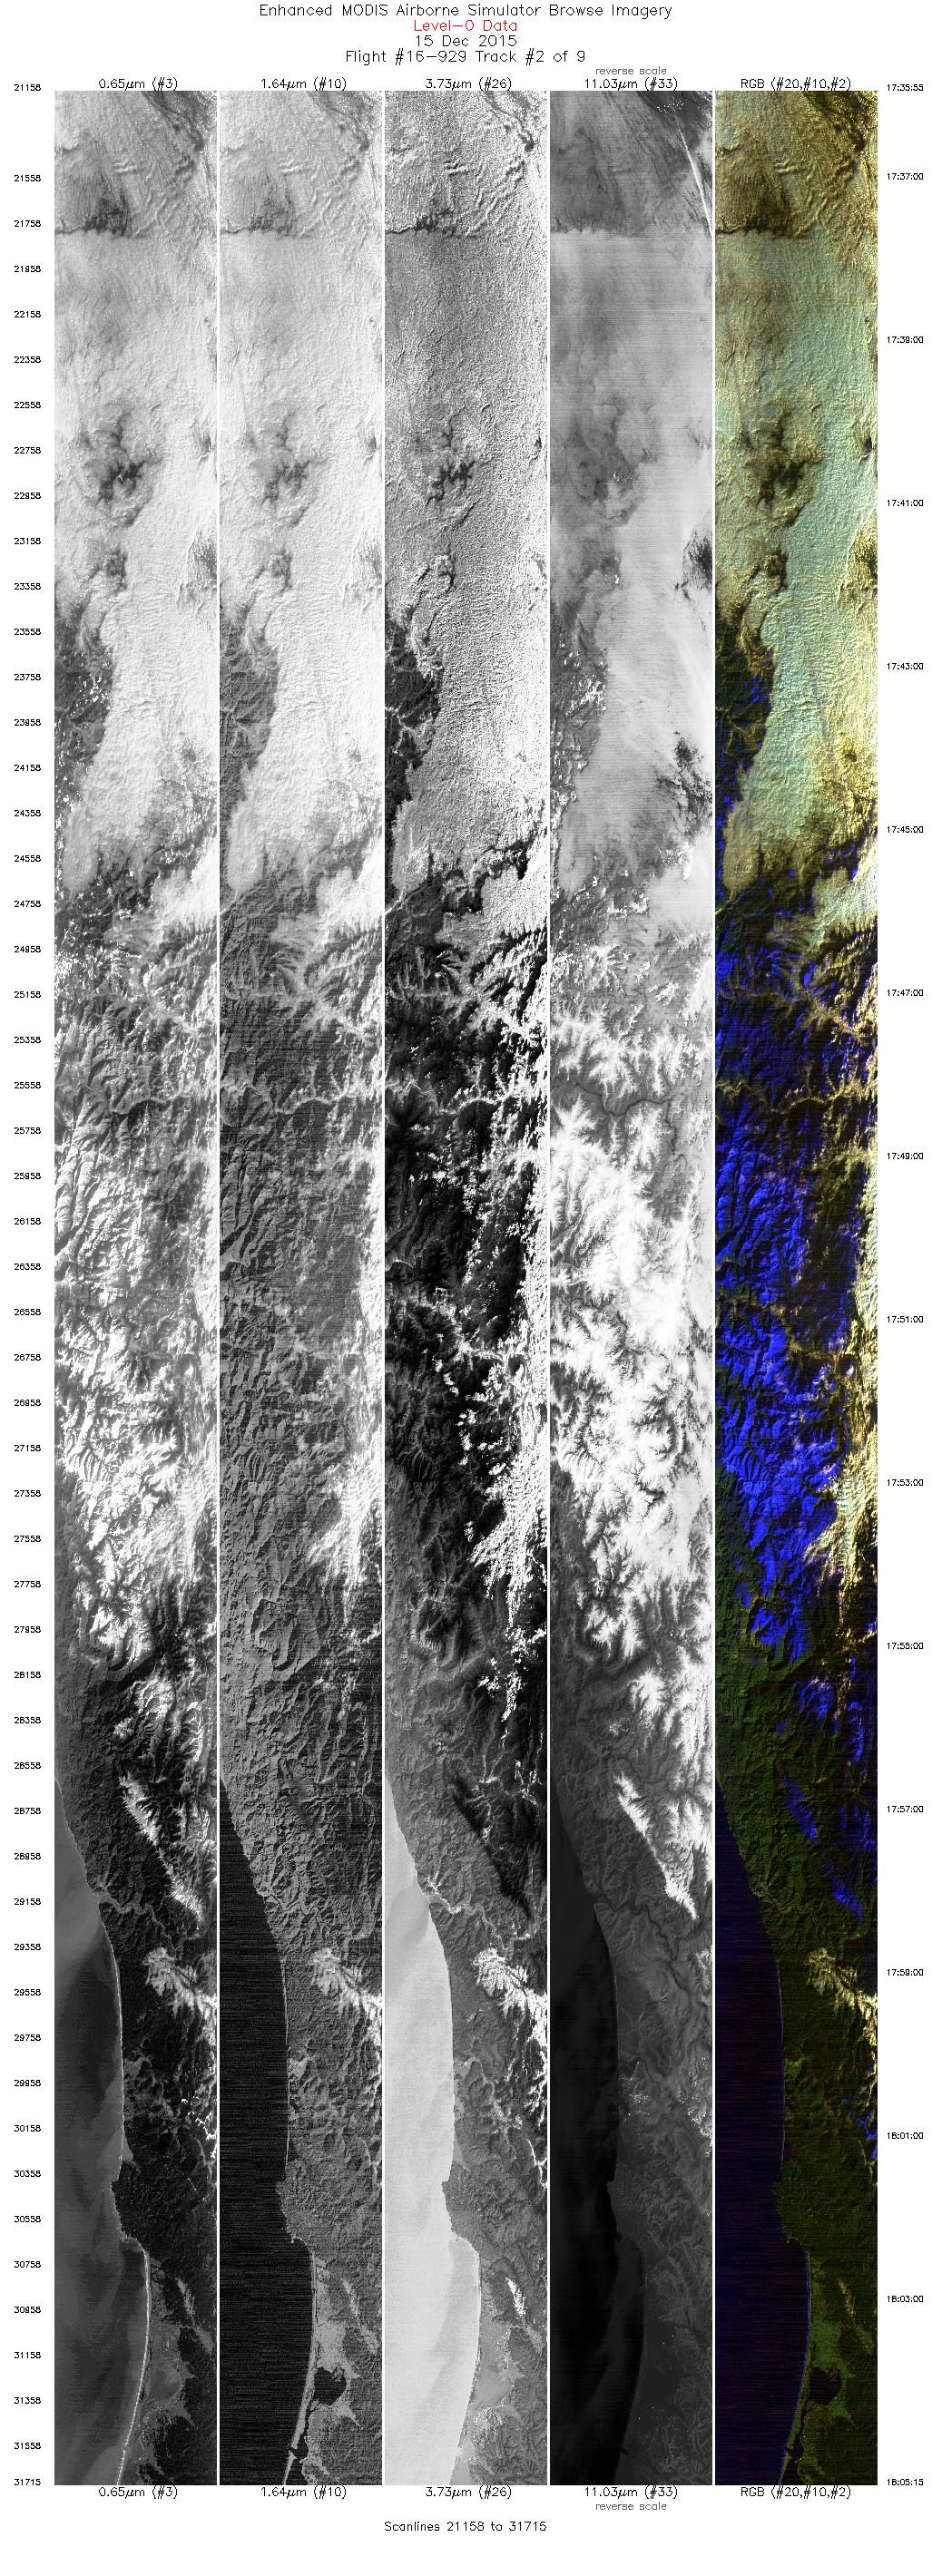
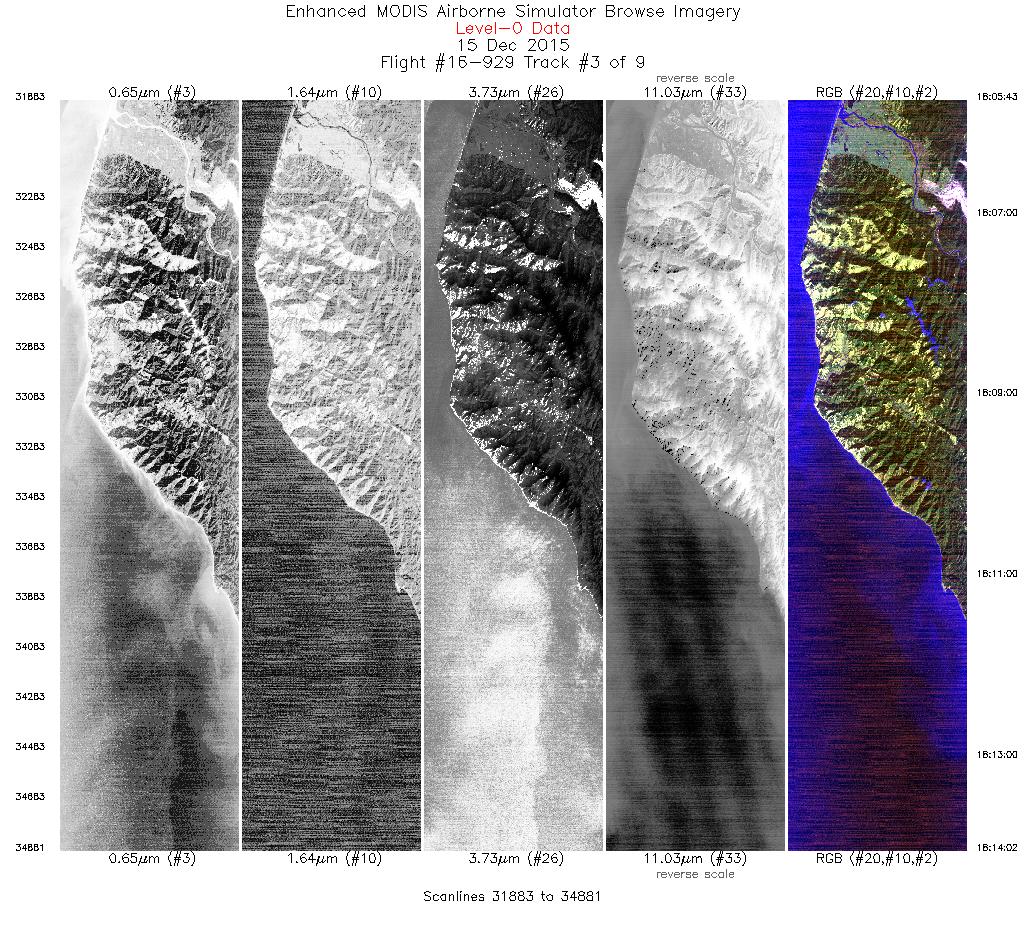
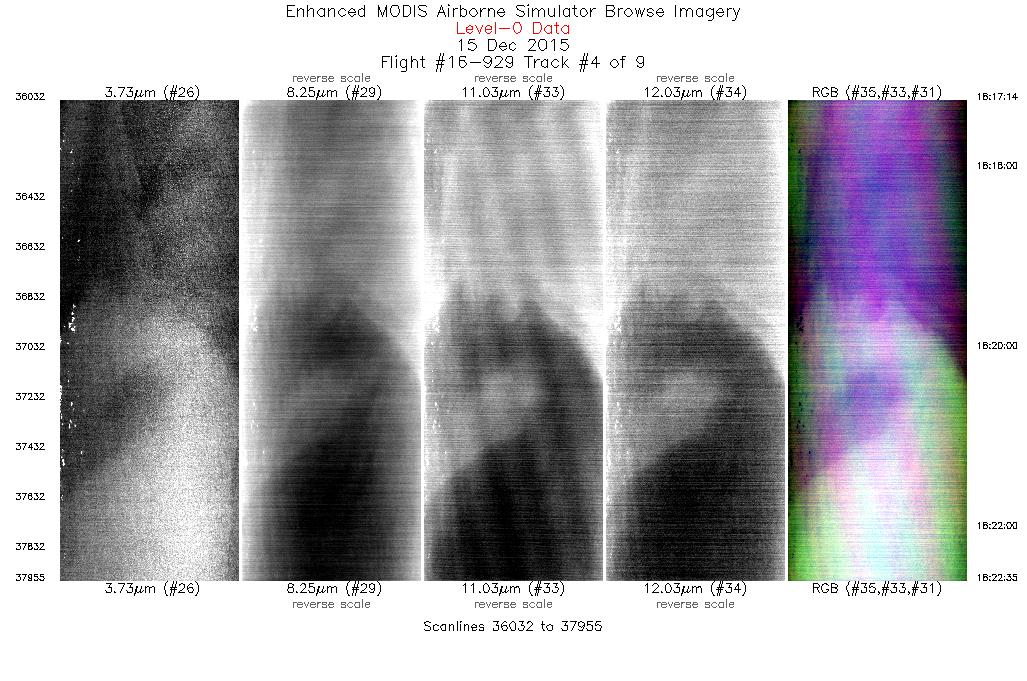
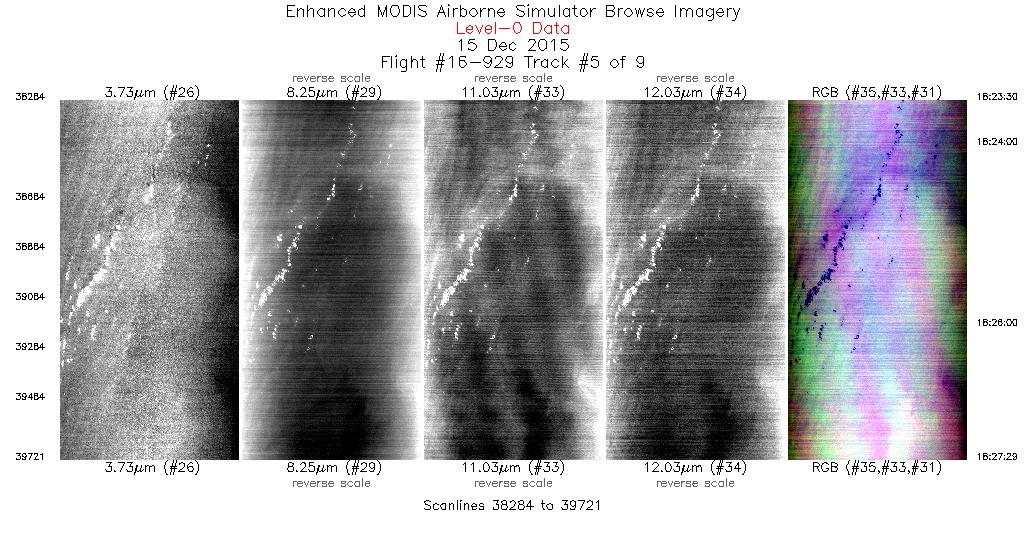
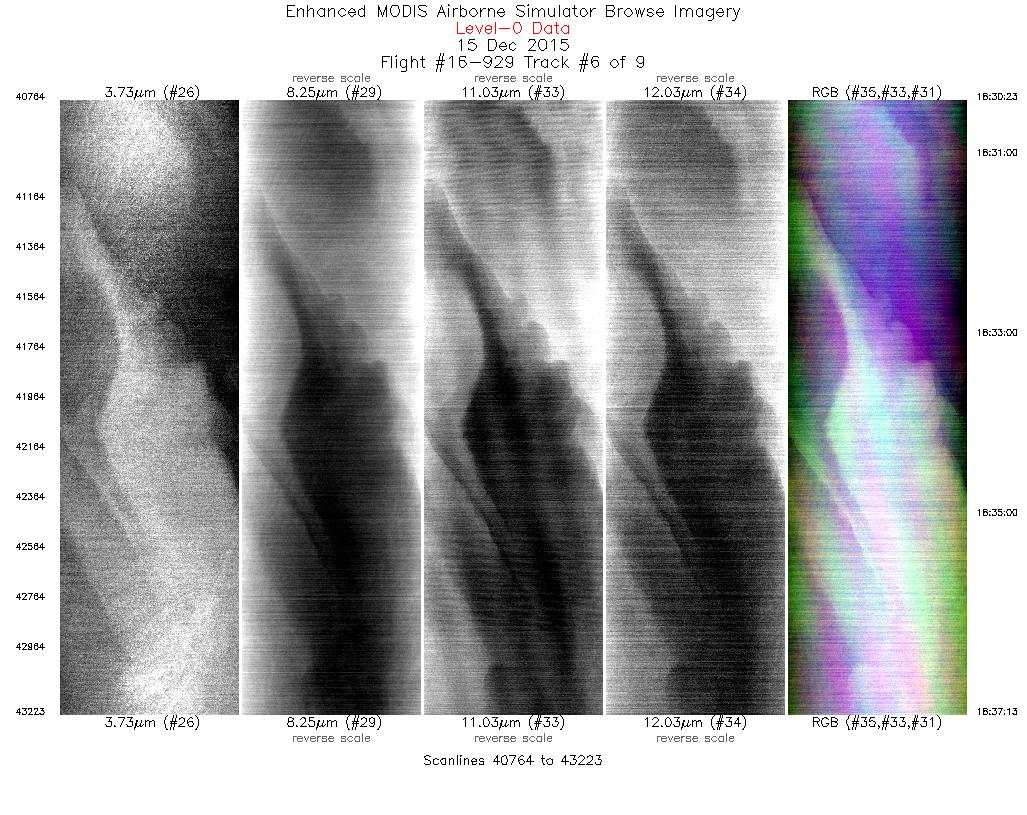
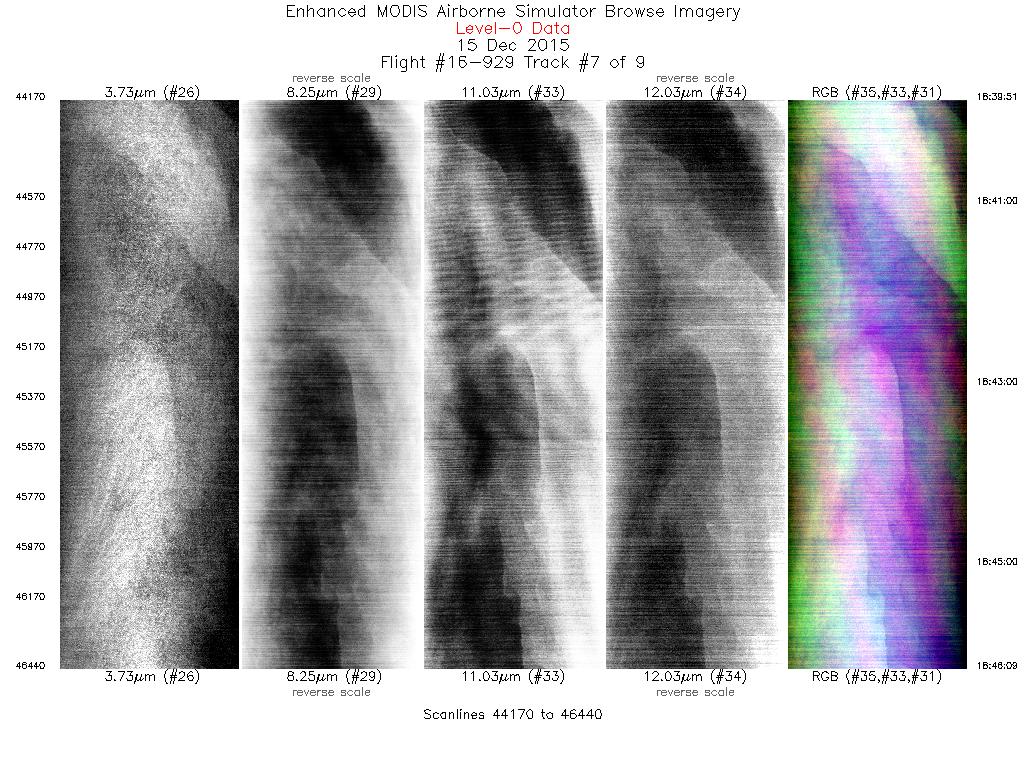
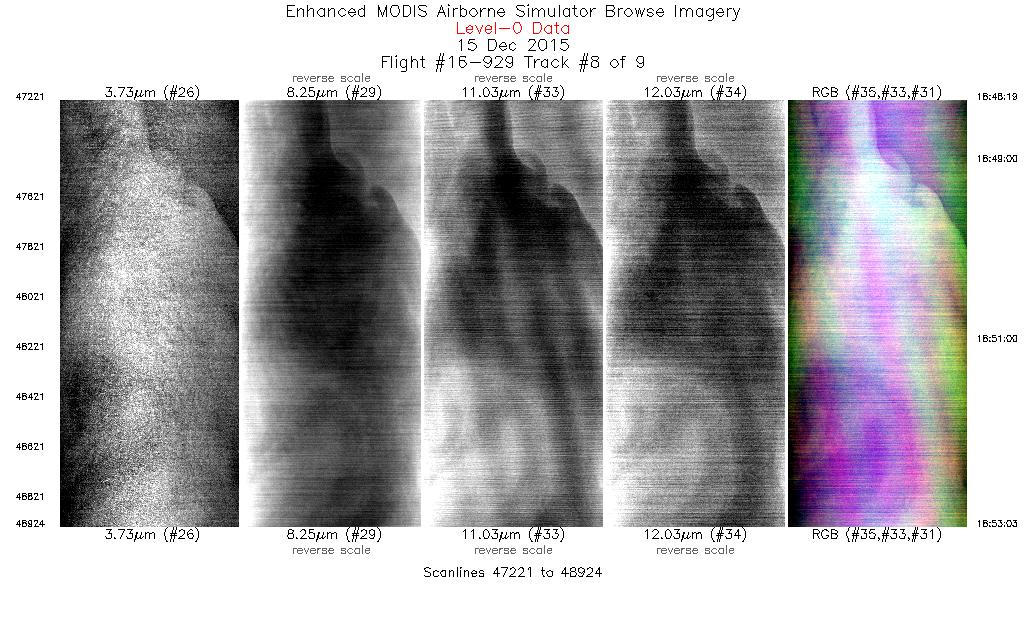
| Sample Imagery |
| Click image for full resolution |
|
Track: #03 Northern California / Pacific Ocean |


|
|
R: 0.75µm G: 0.65µm B: 0.55µm |
- NASA Official: Matt Fladeland
- Project Manager: James Jacobson
- Website Editor: Eric Fraim
- Last Updated: November 16, 2021