


MODIS Airborne Simulator (MAS)
FLIGHT SUMMARY INFORMATION


|
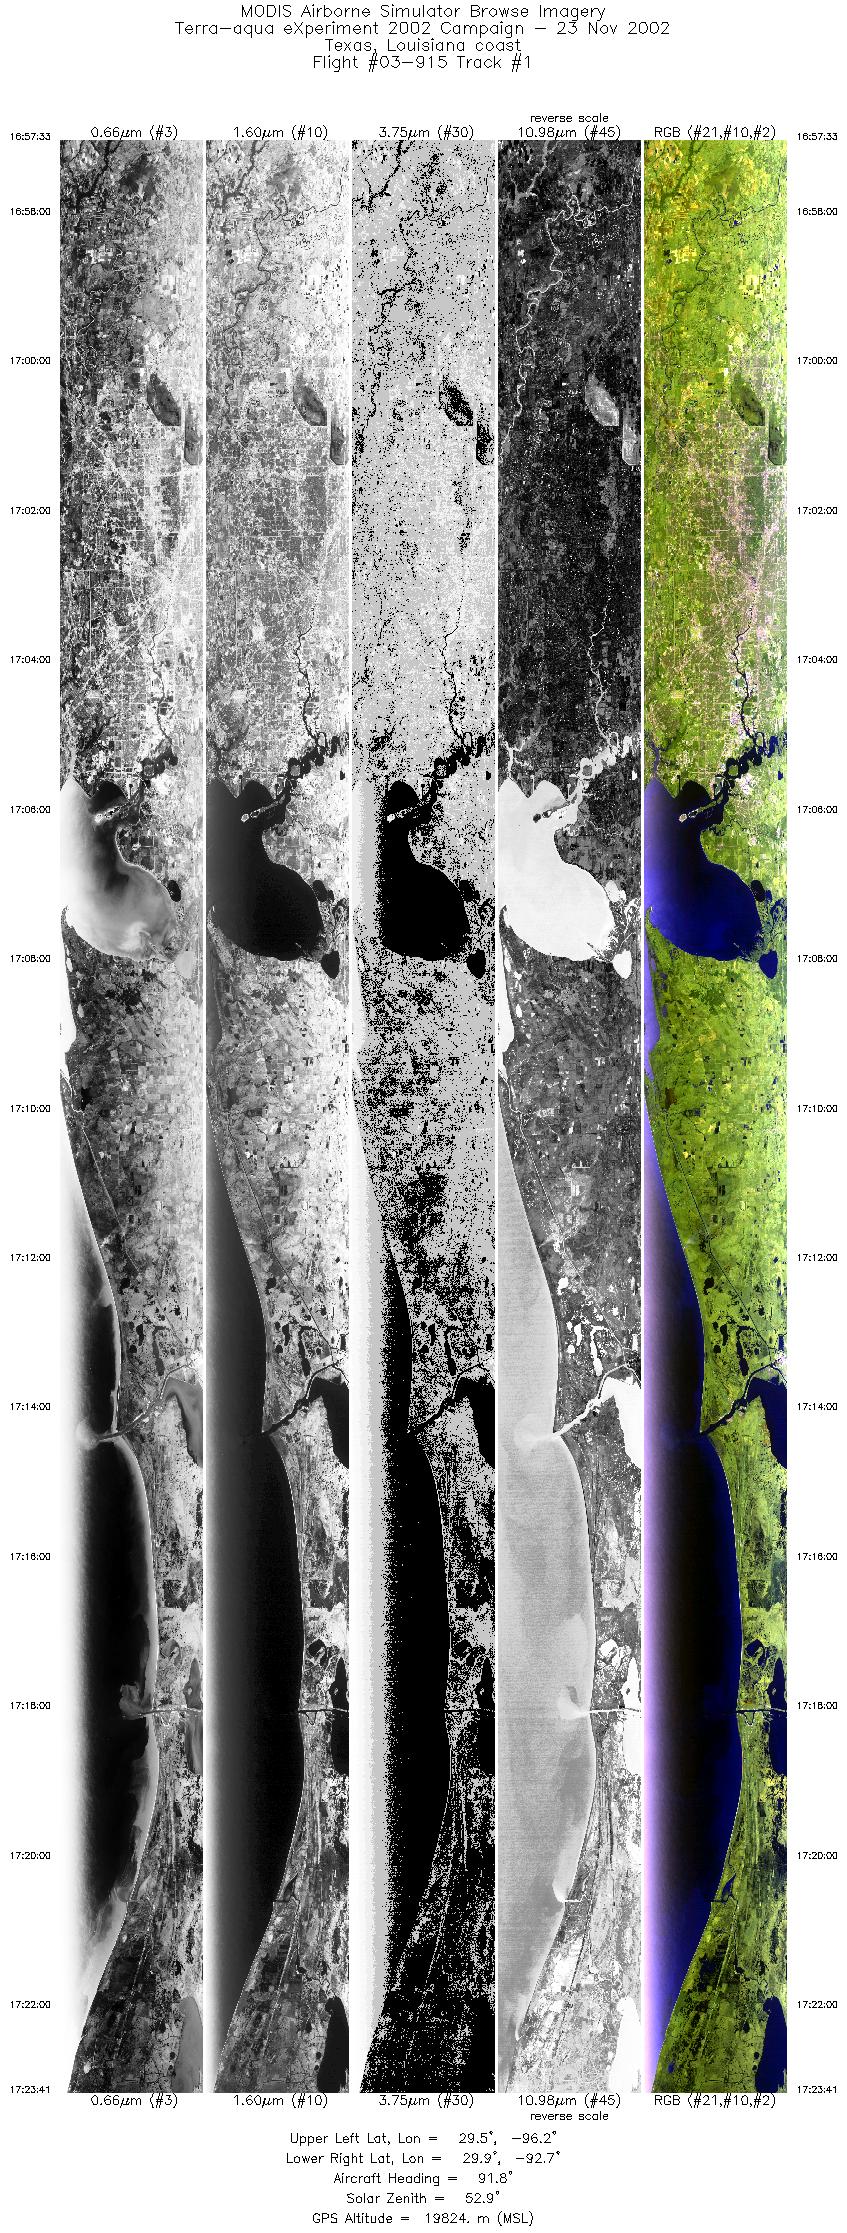
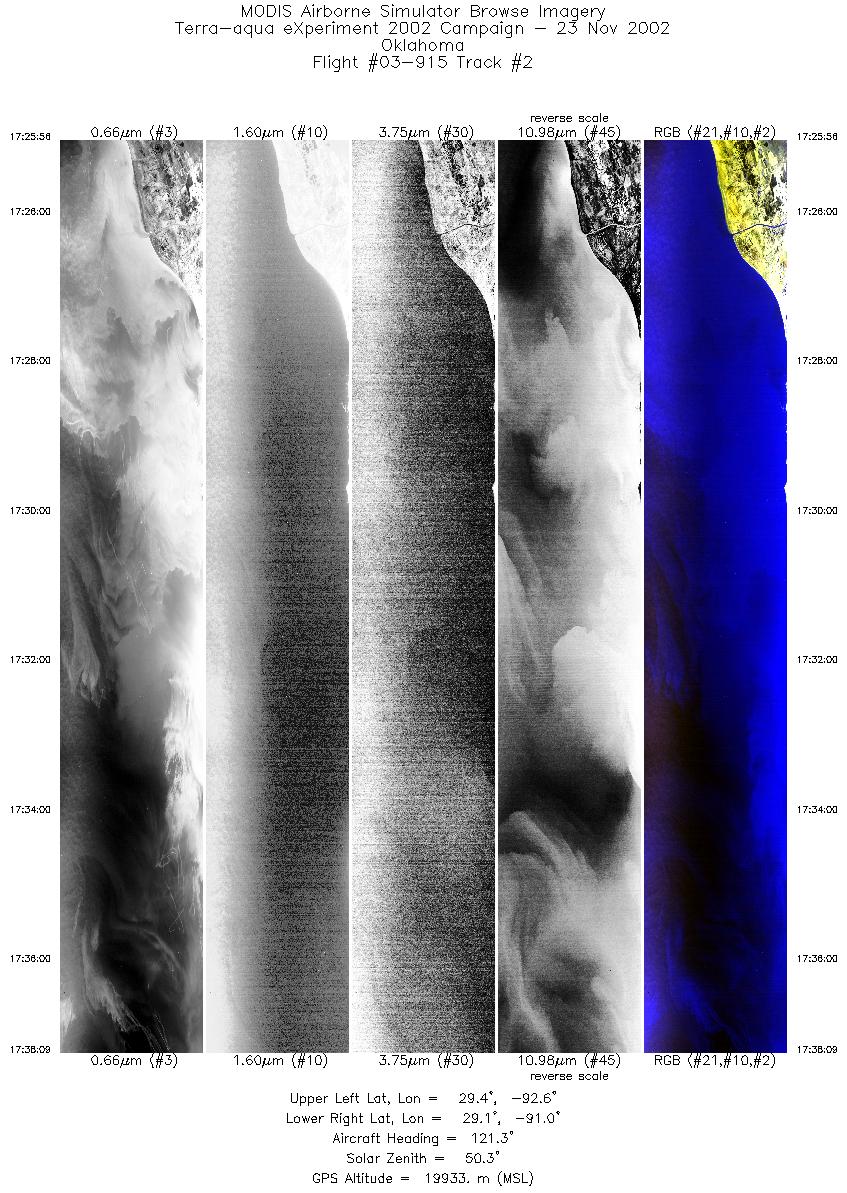
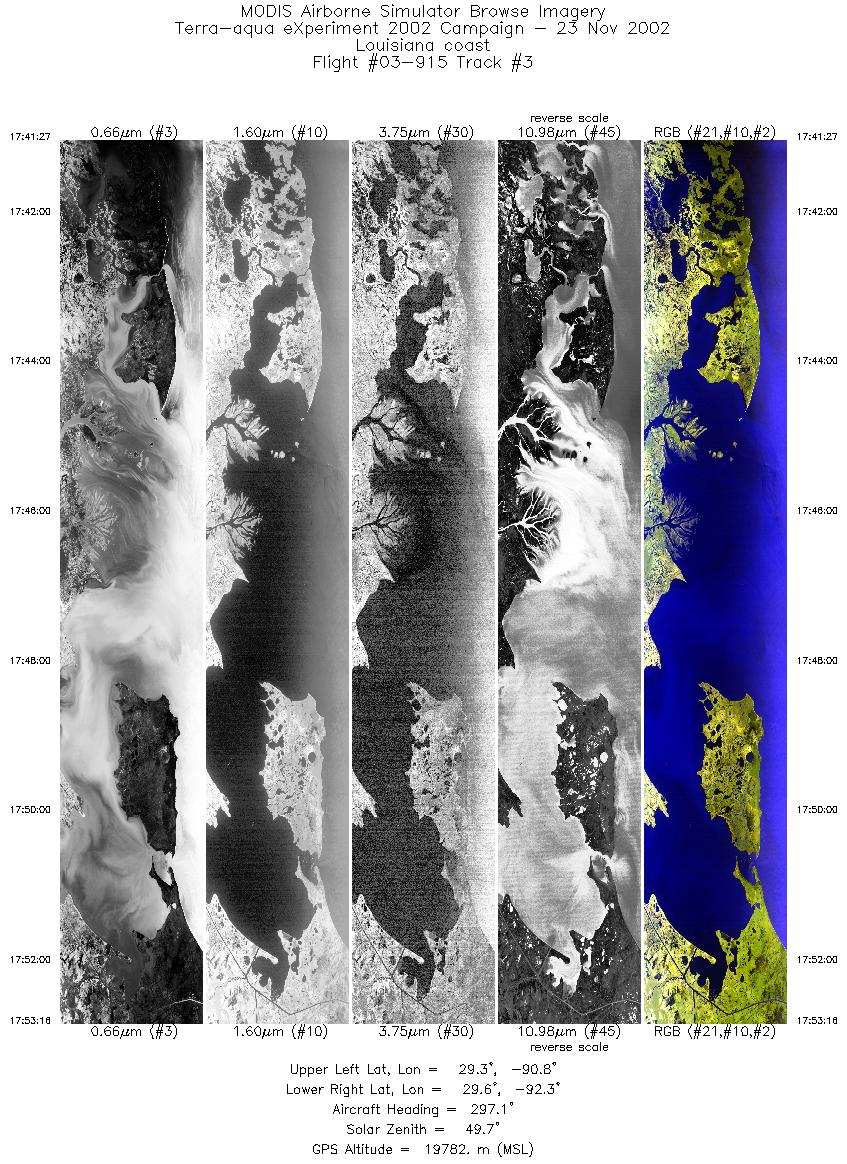
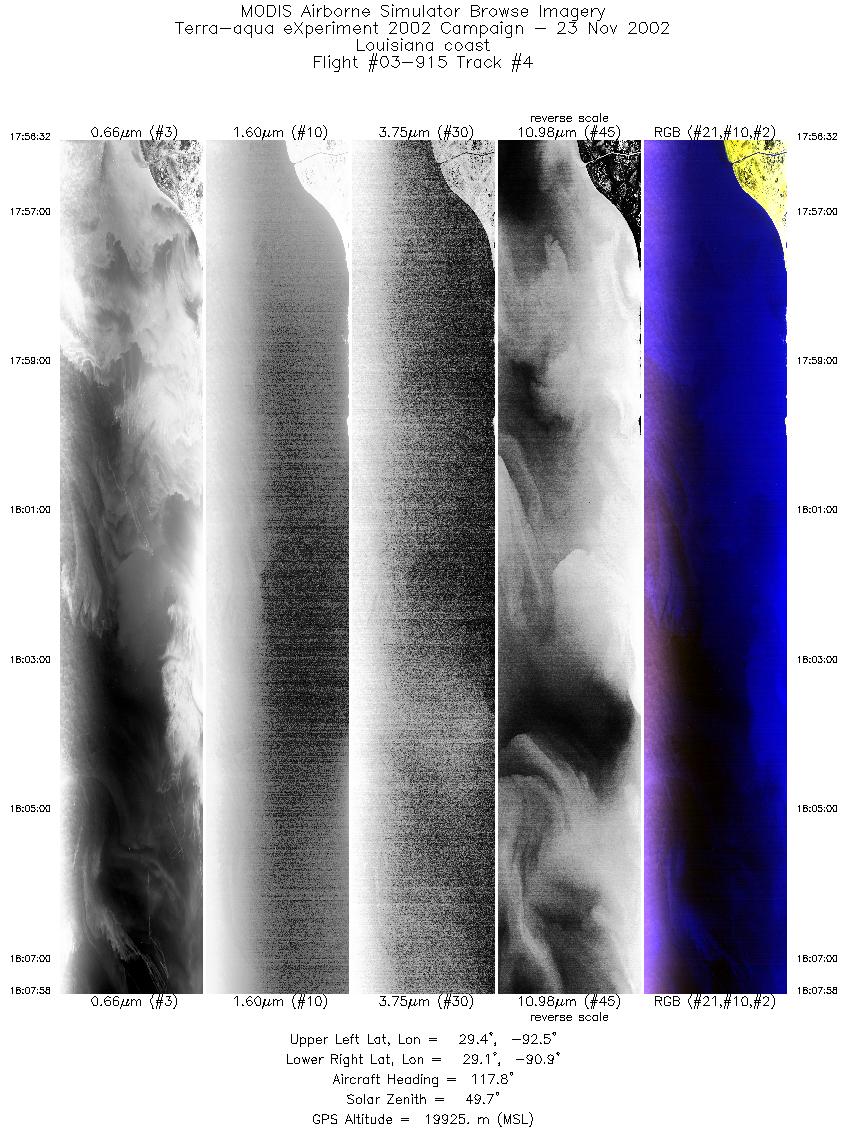
Flight: 03-915 Date: 23 November 2002 Location: Texas / Louisiana / Gulf of Mexico Deployment: TX-2002 Principal Investigators: Drs. Paul Menzel & Chris Moeller (UWISC) Additional Sensors: CPL, MVIS, RC-10 (dual), SHIS, VIS |
||||||||||||||||||||||||||||||||||||||||||||||||||||||||||||||||||||||||||||||||||||||||||||||||||||||||||||||||
|
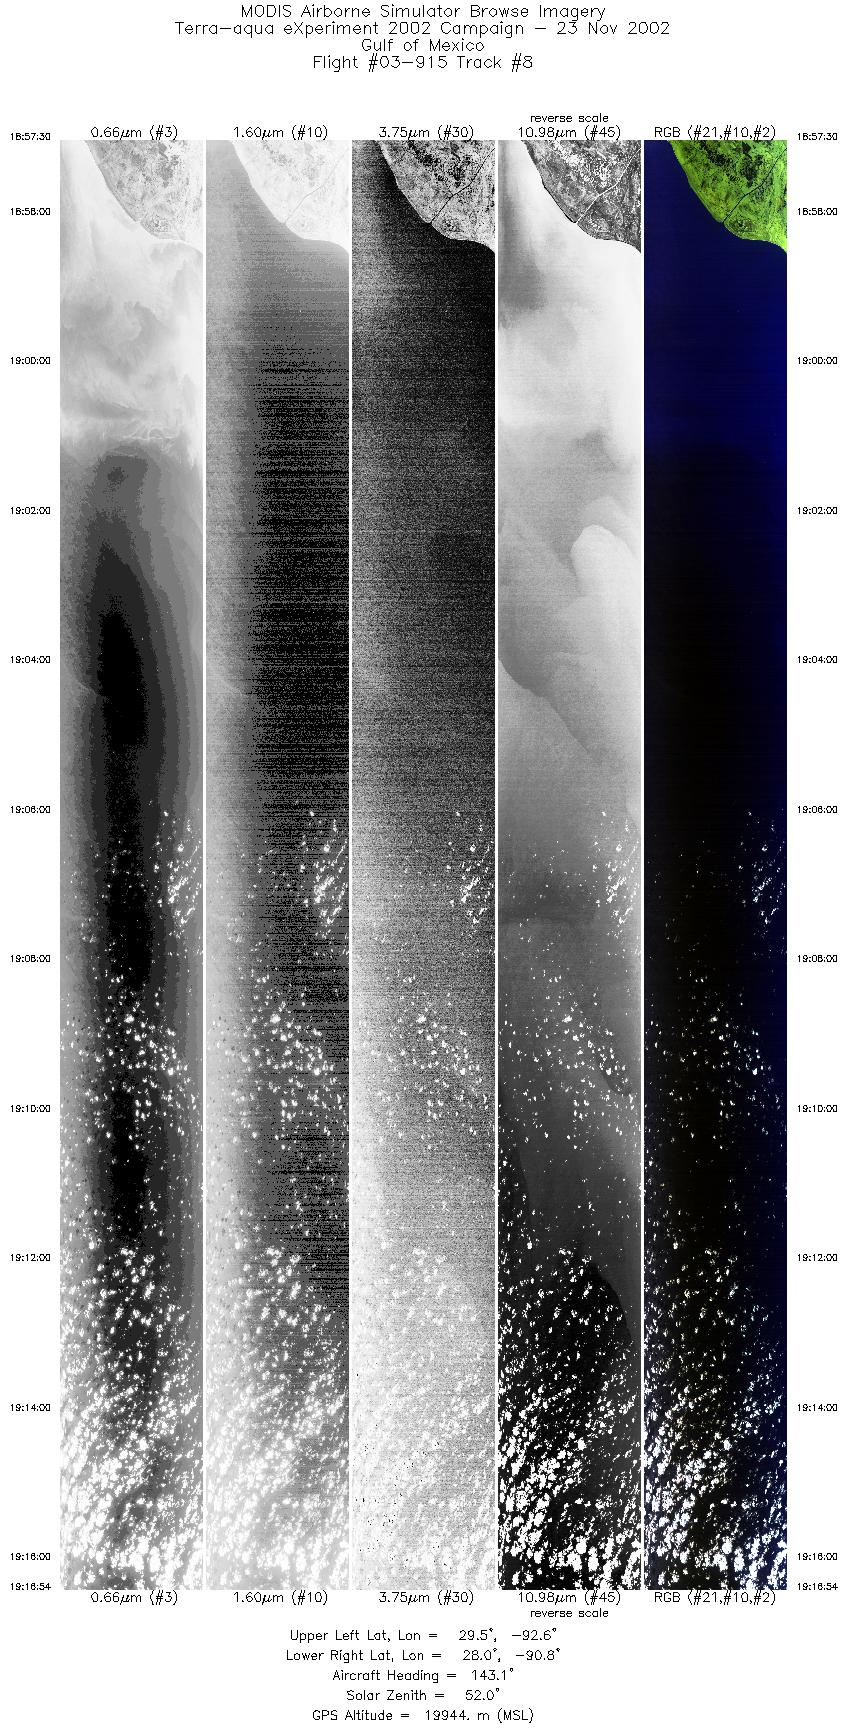
Data Evaluation Ports 2 & 3 have some Line-to-Line Noise. Port 4 has some Coherent Noise (strongest to date), most visable in Bands 42-46. AQUA Underflight @19:29 |
||||||||||||||||||||||||||||||||||||||||||||||||||||||||||||||||||||||||||||||||||||||||||||||||||||||||||||||||
|
Processing Information Level-1B Data in HDF format is available Flight Line Summary Spectral Band Configuration Spectral Response Function Table |
||||||||||||||||||||||||||||||||||||||||||||||||||||||||||||||||||||||||||||||||||||||||||||||||||||||||||||||||
|
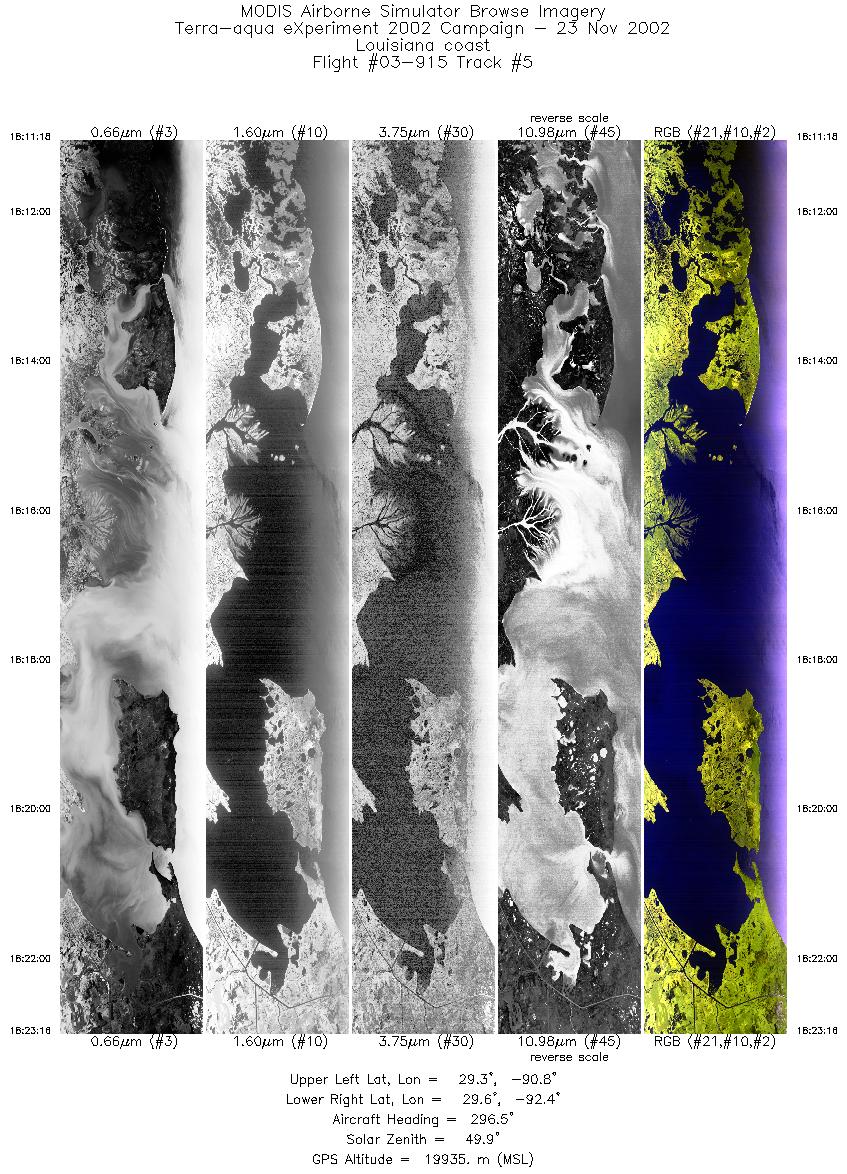
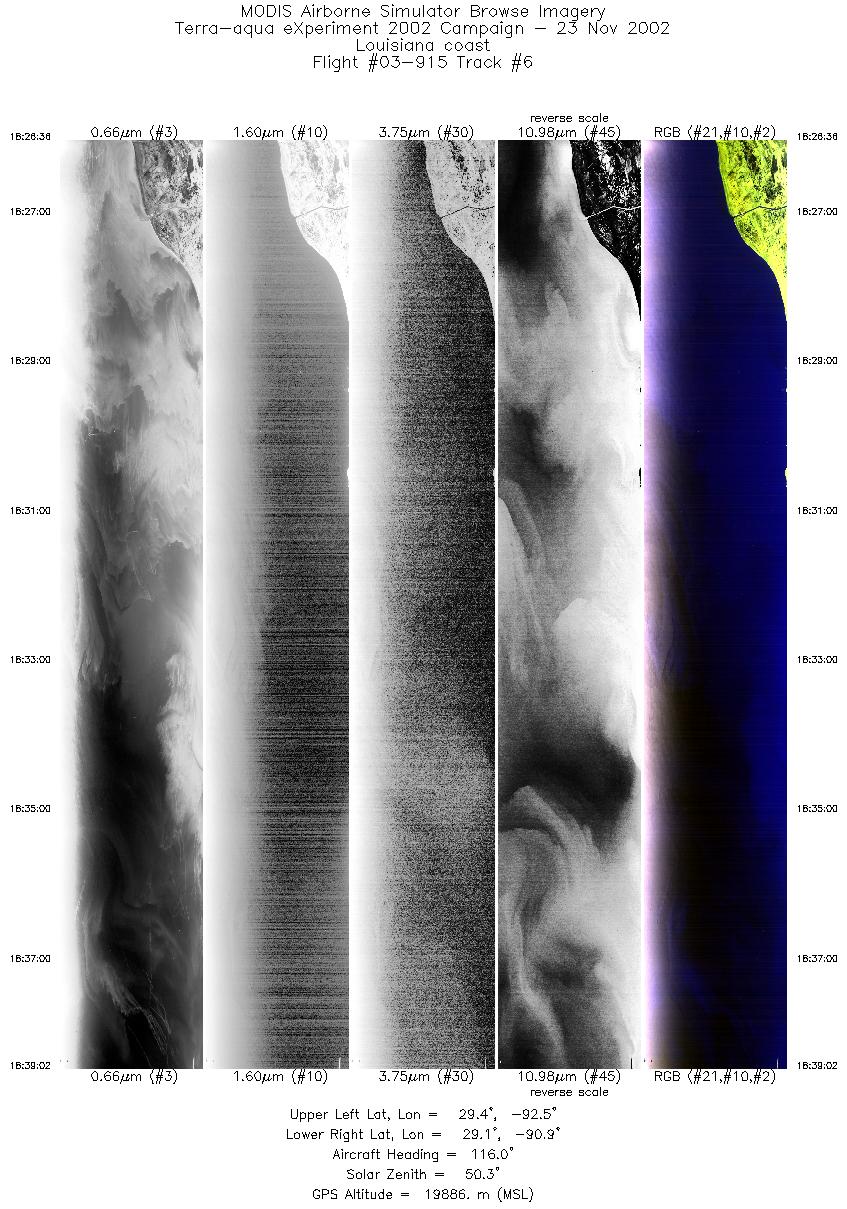
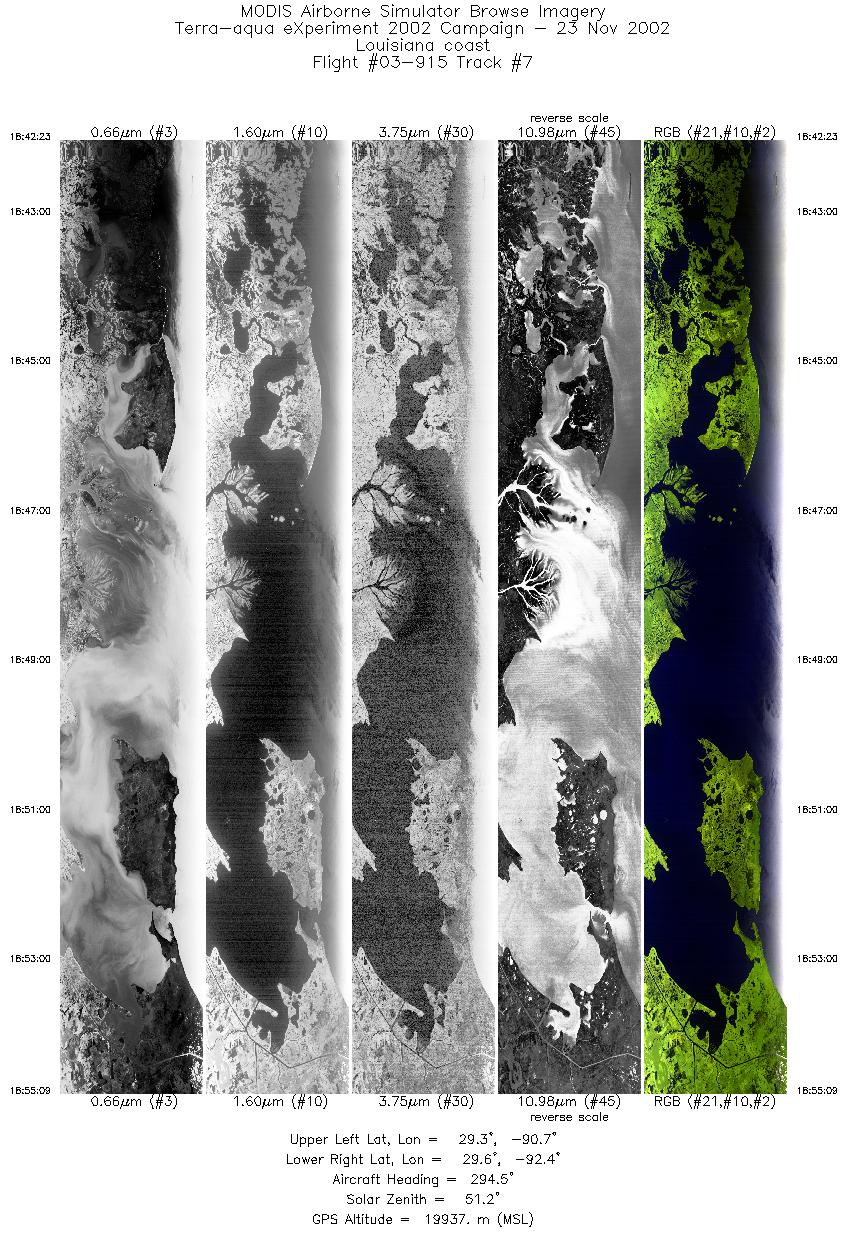
Browse Imagery Flight Tracks: 12 Scanlines: 63535 |
||||||||||||||||||||||||||||||||||||||||||||||||||||||||||||||||||||||||||||||||||||||||||||||||||||||||||||||||
|
||||||||||||||||||||||||||||||||||||||||||||||||||||||||||||||||||||||||||||||||||||||||||||||||||||||||||||||||
|
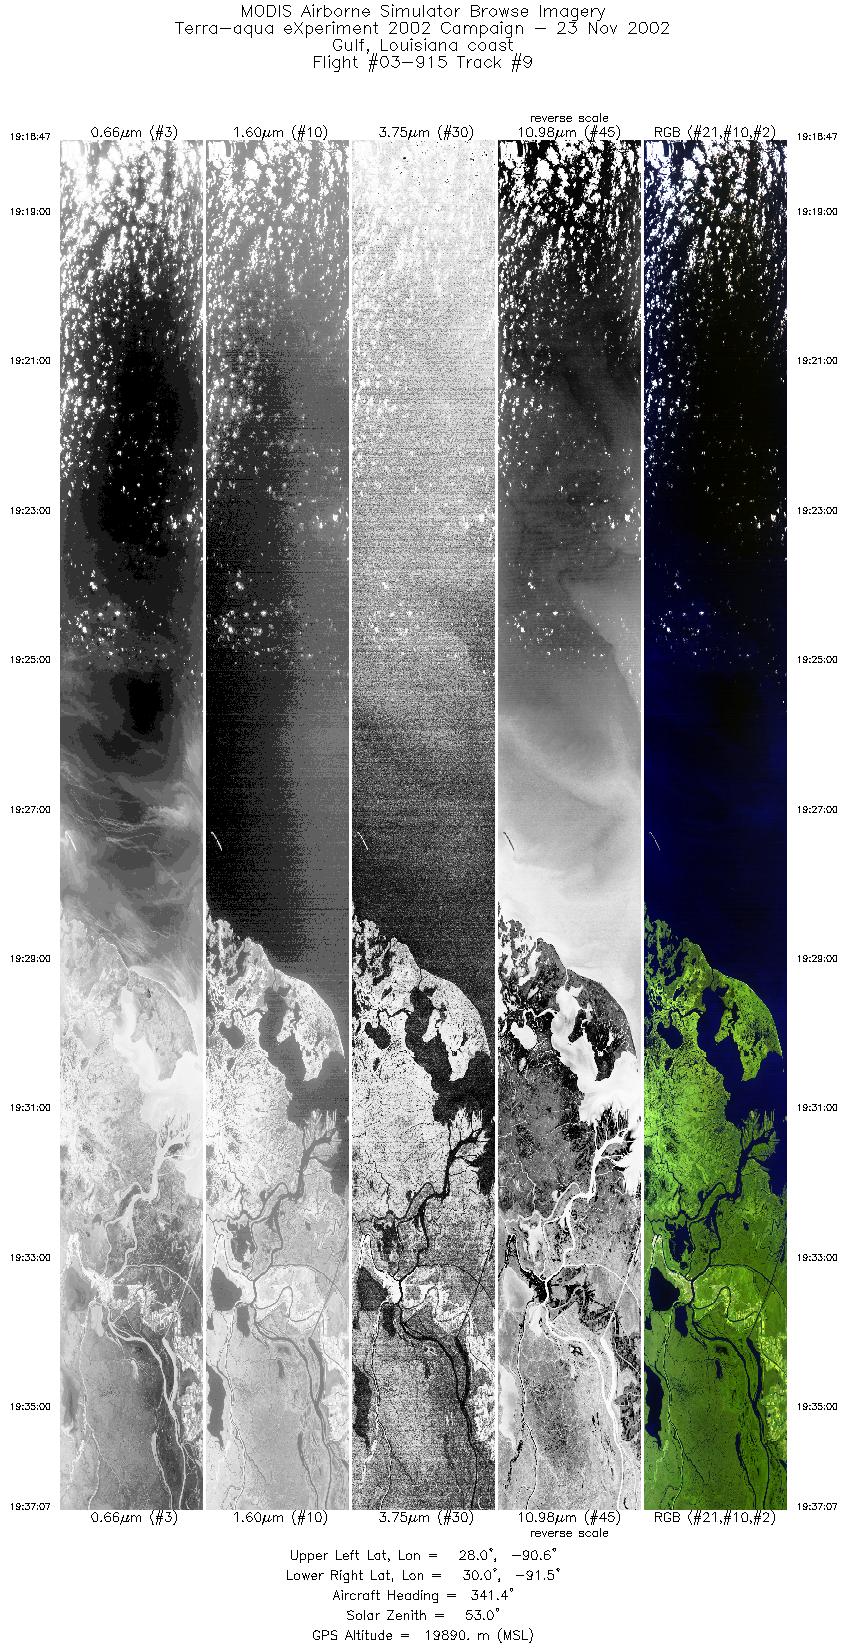
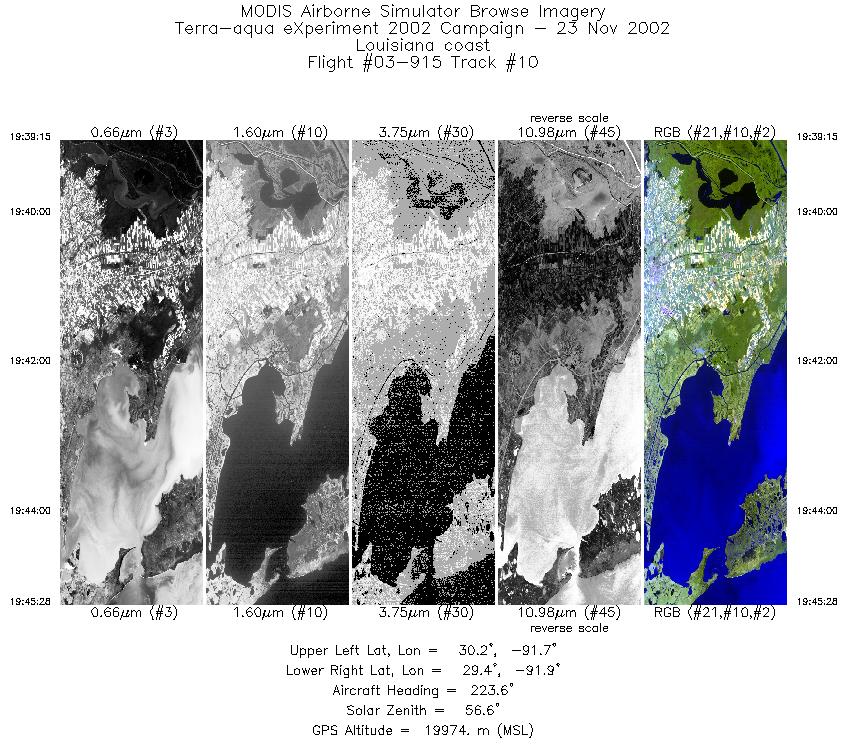
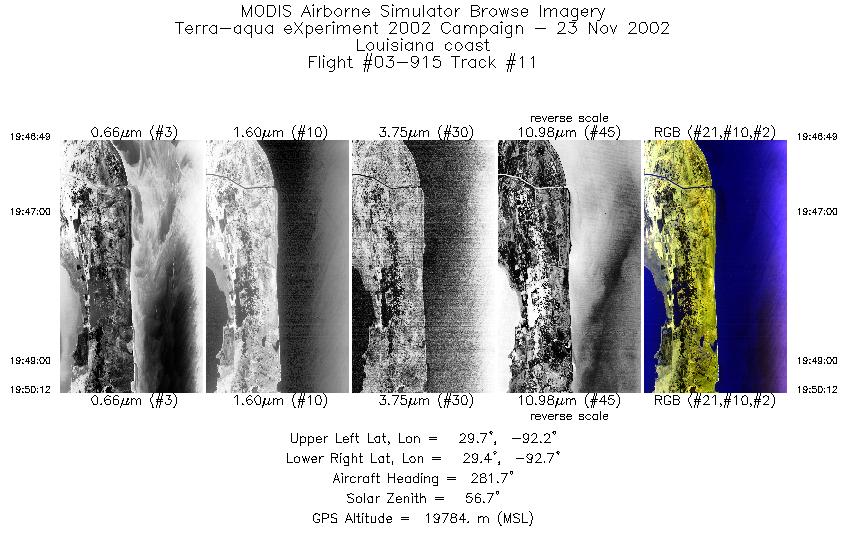
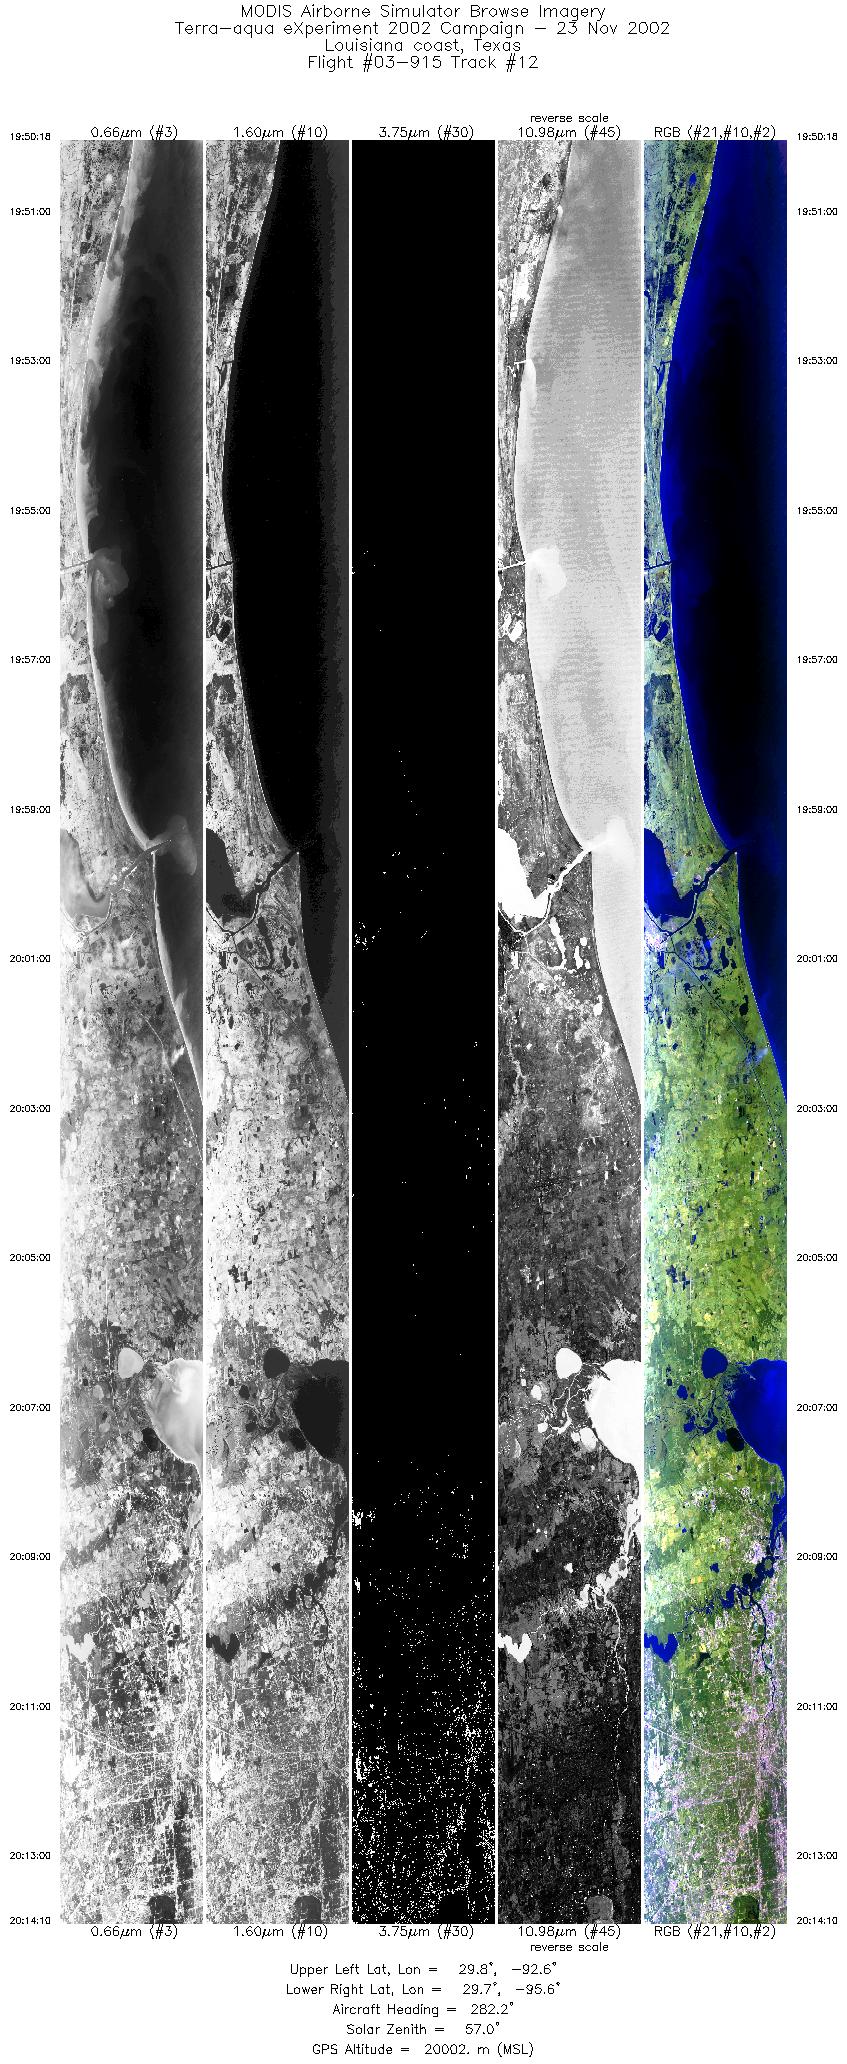
Flight Summary Report Mission Objectives Map and monitor turbid coastal water for sediment transport, underflying Aqua (1929 UTC) for transferring SSC algorithm to MODIS. Map western Louisiana muddy coast region for geomorphic measurement. Flight Summary:Take-off was at 1630 UTC. ER-2 landed at 2105 UTC. ER-2 flew towards LA coast from SAT to pick up on ESE bound seaward leg of racetrack covering Atchafalaya Bay turbid water zone. Flew 3 orbits of this racetrack (16 NM spacing between lines for overlap with MAS to reduce impact of sunglint on the data set), shooting RC-10 on final landward leg. Skies clear on all orbits. Then flew south to open water to pick up line parallel to Aqua orbital track (offset by 18 deg view angle) meeting the satellite at 1929 UTC midway along this 17 minute leg and continuing up over Fourleague Bay region (LSU in situ sites). Some cumulus just at southern extent of this line but skies clear elsewhere. Then proceeded to western Louisiana muddy coast for photo line (clear skies) and then brought the ER-2 back to SAT.. Highlights:Sediment monitoring with in situ water quality measurements. Co-incident Aqua MODIS and MAS over turbid water. Instrument Status:
Lots of shrimp boat tracks. NAST-I inadvertantly left off till 1931 UTC.  |
||||||||||||||||||||||||||||||||||||||||||||||||||||||||||||||||||||||||||||||||||||||||||||||||||||||||||||||||

Flight 03-915


| Sample Imagery |
| Click image for full resolution |
|
Track #09 Gulf of Mexico / Louisiana |


|
|
R: 2.15µm G: 1.64µm B: 0.55µm |
- NASA Official: Matt Fladeland
- Project Manager: James Jacobson
- Website Editor: Eric Fraim
- Last Updated: November 16, 2021


