


MODIS Airborne Simulator (MAS)
FLIGHT SUMMARY INFORMATION


|
Flight: 00-070 Date: 12 March 2000 Location: Oklahoma (CART-ARM) Deployment: WISC T2000 Principal Investigator: Moeller (UWisc) / Liou (UCLA) / Bruegge (JPL) Additional Sensors: AirMISR, CLS, RC-10 (6" BW), SHIS, VIS |
|||||||||||||||||||||||||||||||||||||||||||||||||||||||||||||||||||||||||||||||||||||||||||||||||||||||||||||||||||||||||||||||||||||||||||||||||||||||||||||||||||||||||||||||
|
Data Evaluation Overall quality is good |
|||||||||||||||||||||||||||||||||||||||||||||||||||||||||||||||||||||||||||||||||||||||||||||||||||||||||||||||||||||||||||||||||||||||||||||||||||||||||||||||||||||||||||||||
|
Processing Information Level-1B Data in HDF format is available Flight Line Summary Spectral Band Configuration Spectral Response Function Table |
|||||||||||||||||||||||||||||||||||||||||||||||||||||||||||||||||||||||||||||||||||||||||||||||||||||||||||||||||||||||||||||||||||||||||||||||||||||||||||||||||||||||||||||||
|
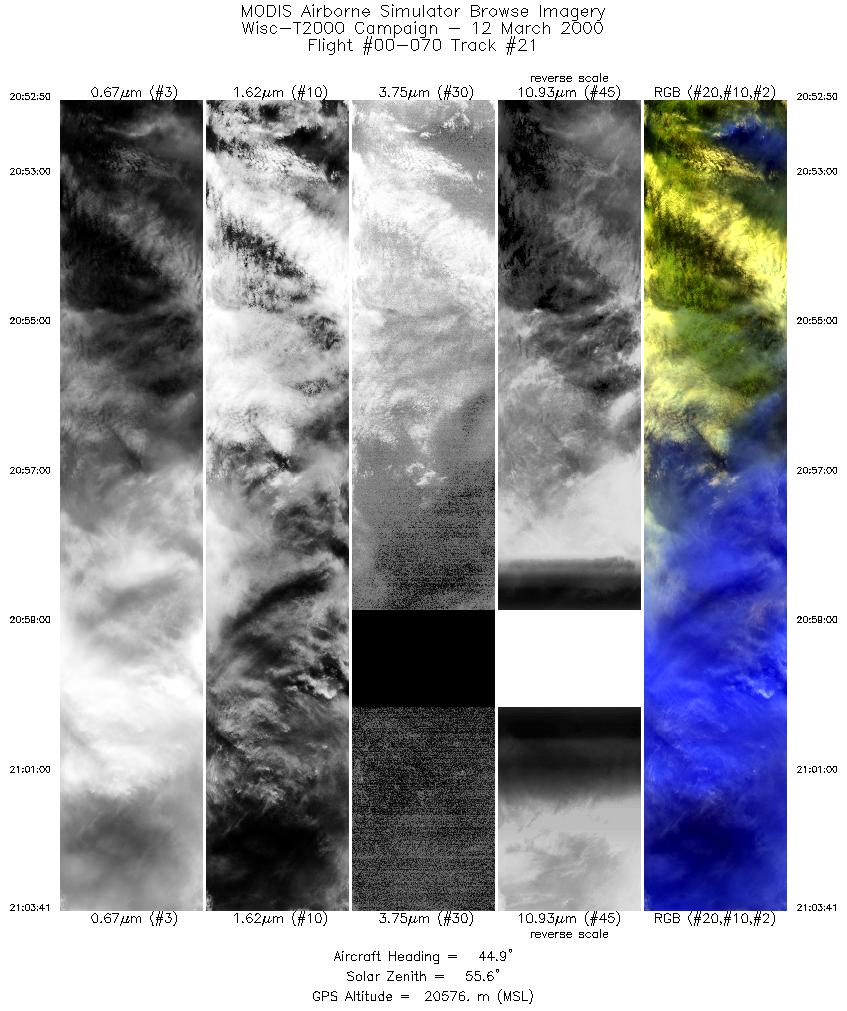
Browse Imagery Flight Tracks: 21 Scanlines: 89179 |
|||||||||||||||||||||||||||||||||||||||||||||||||||||||||||||||||||||||||||||||||||||||||||||||||||||||||||||||||||||||||||||||||||||||||||||||||||||||||||||||||||||||||||||||
|
|||||||||||||||||||||||||||||||||||||||||||||||||||||||||||||||||||||||||||||||||||||||||||||||||||||||||||||||||||||||||||||||||||||||||||||||||||||||||||||||||||||||||||||||
|
Objective and Summary:
Take-off at 1545 UTC. ER-2 landed at 2145 UTC.
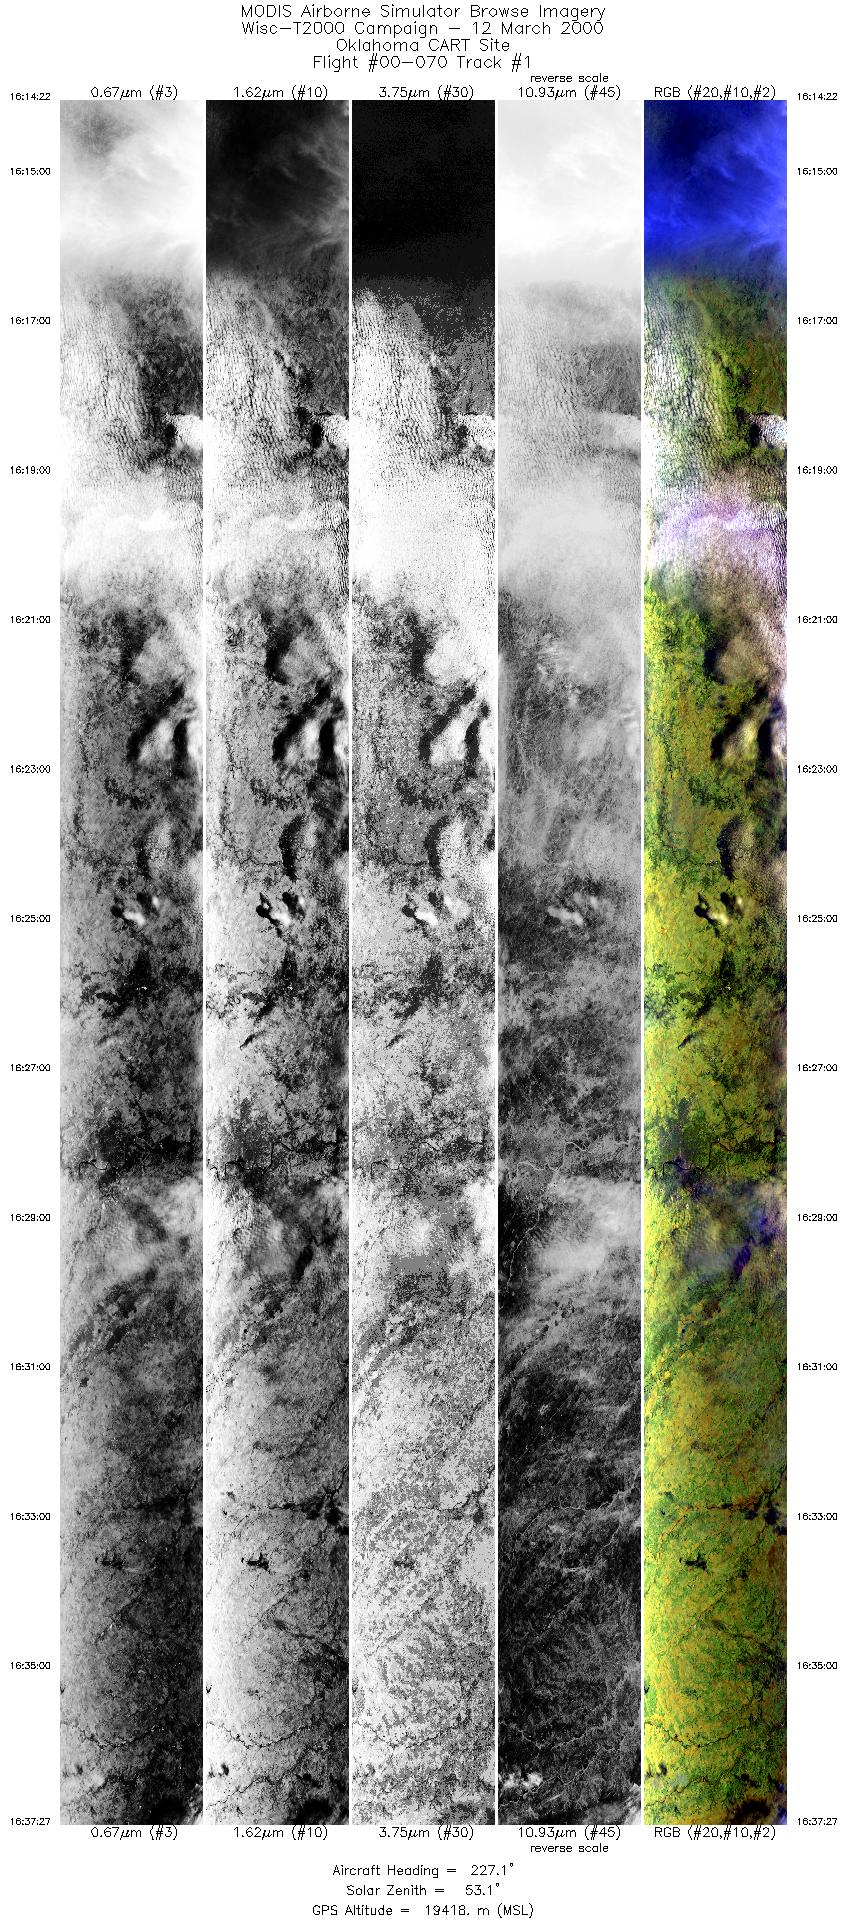
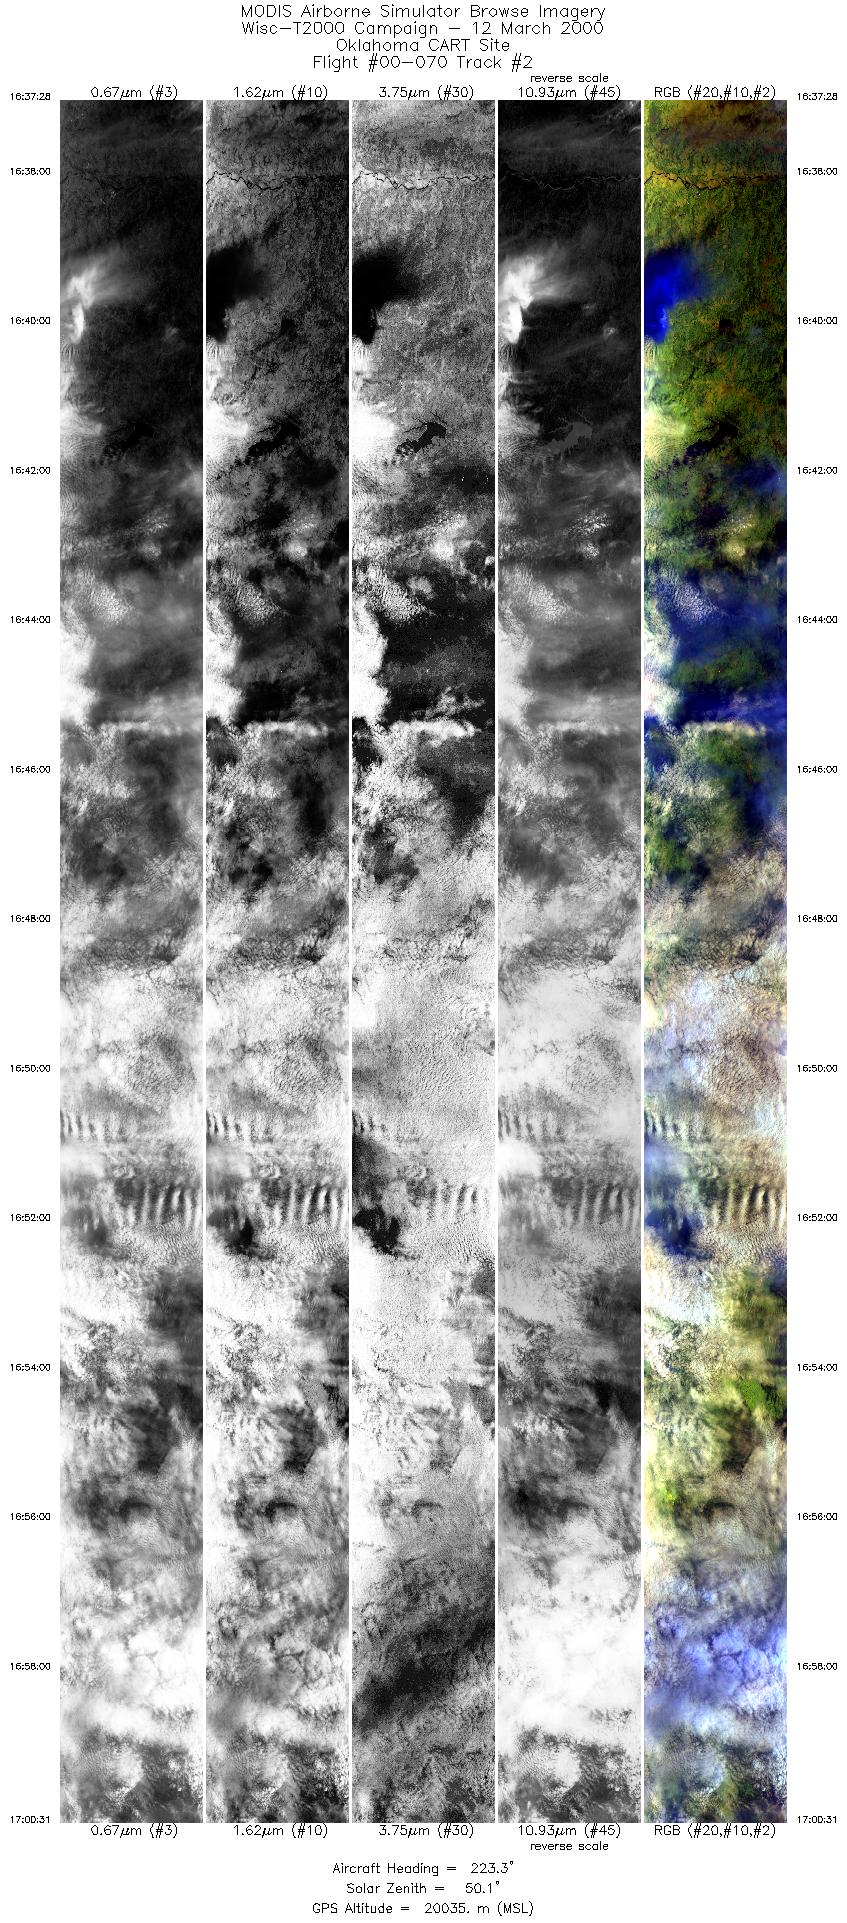
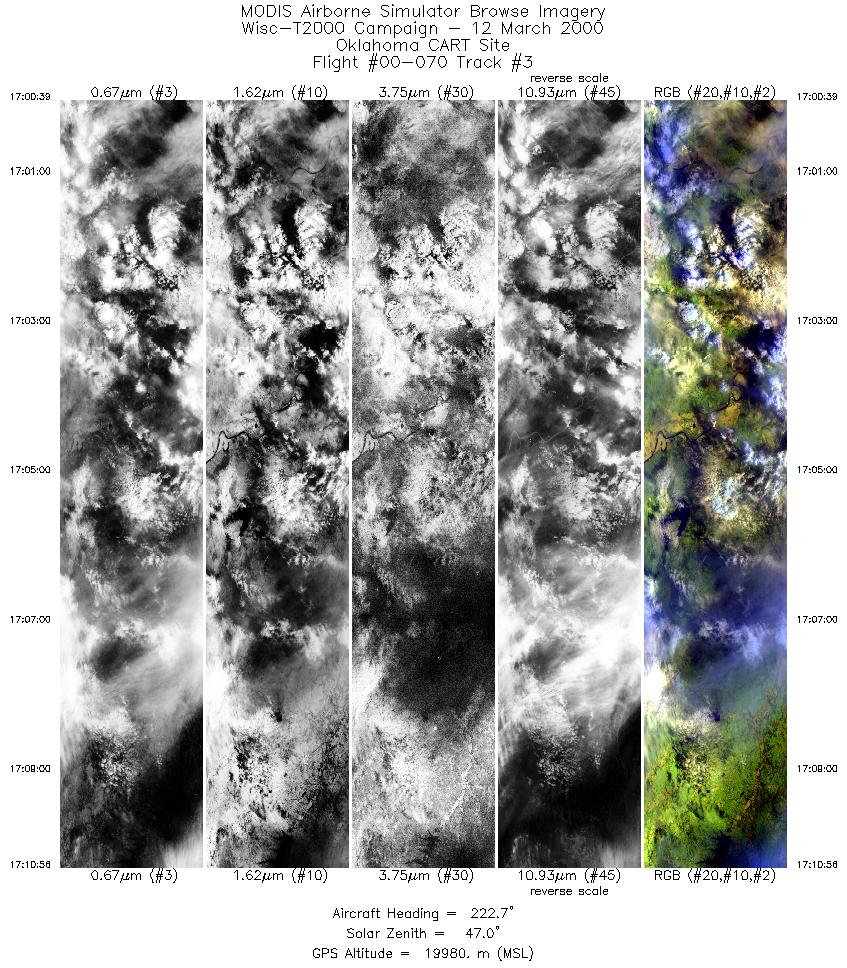
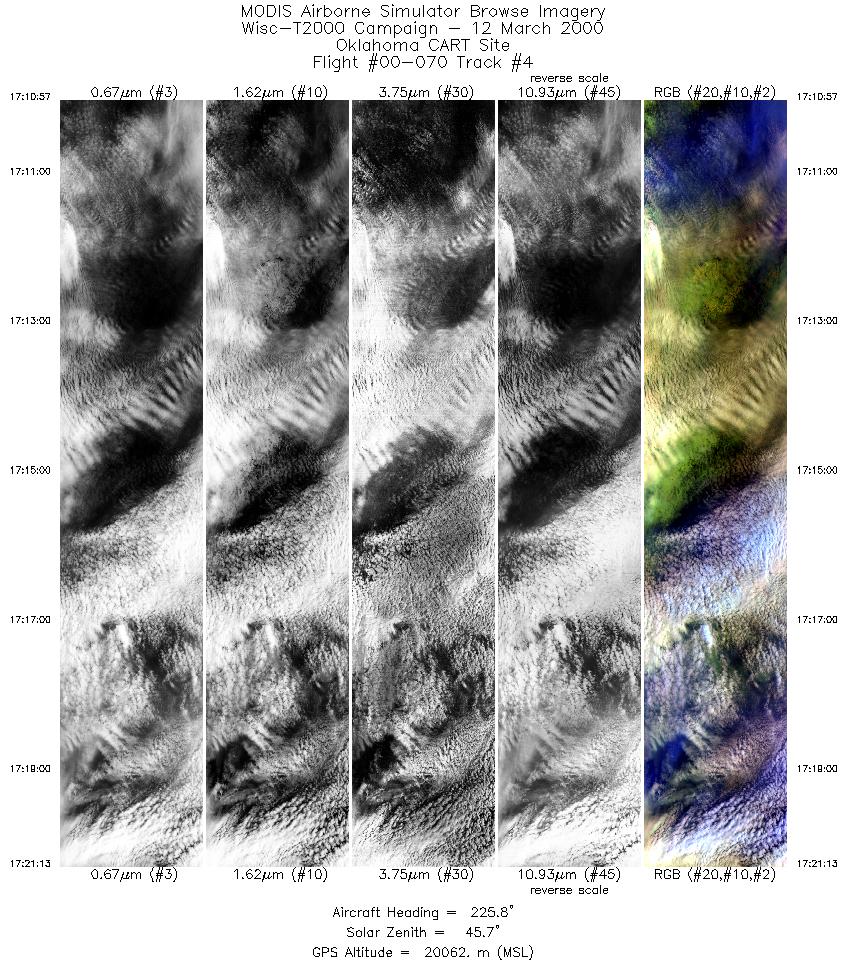
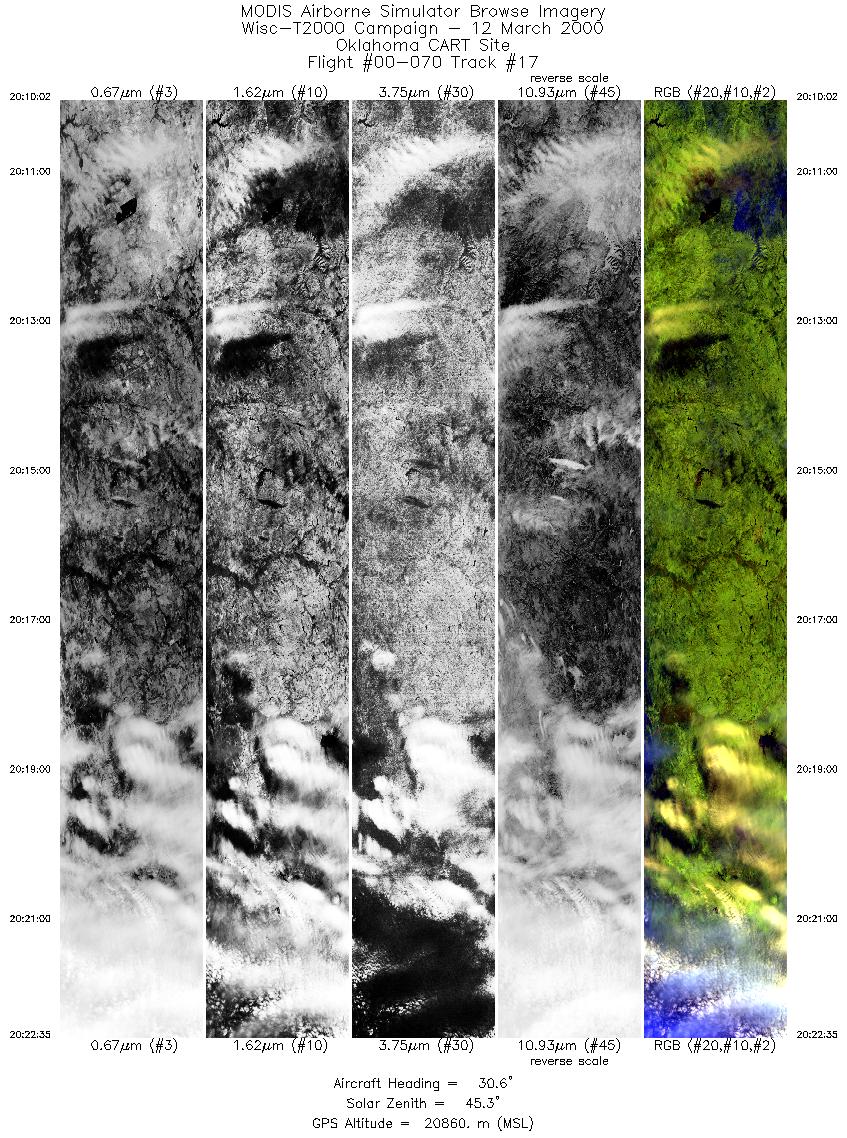
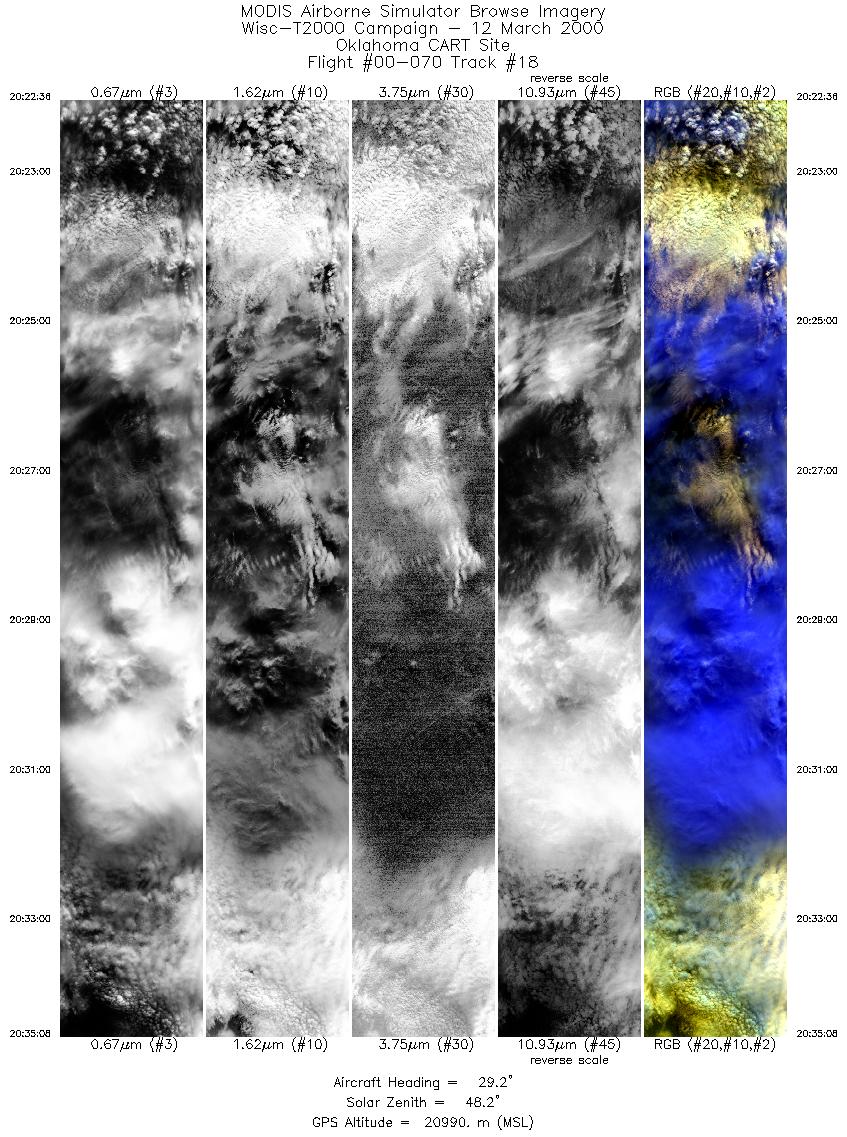
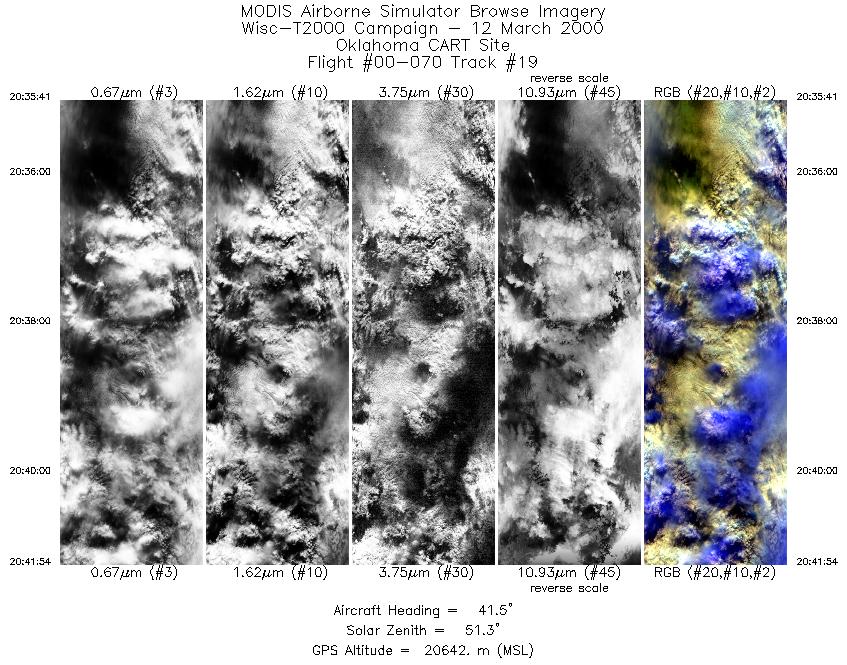
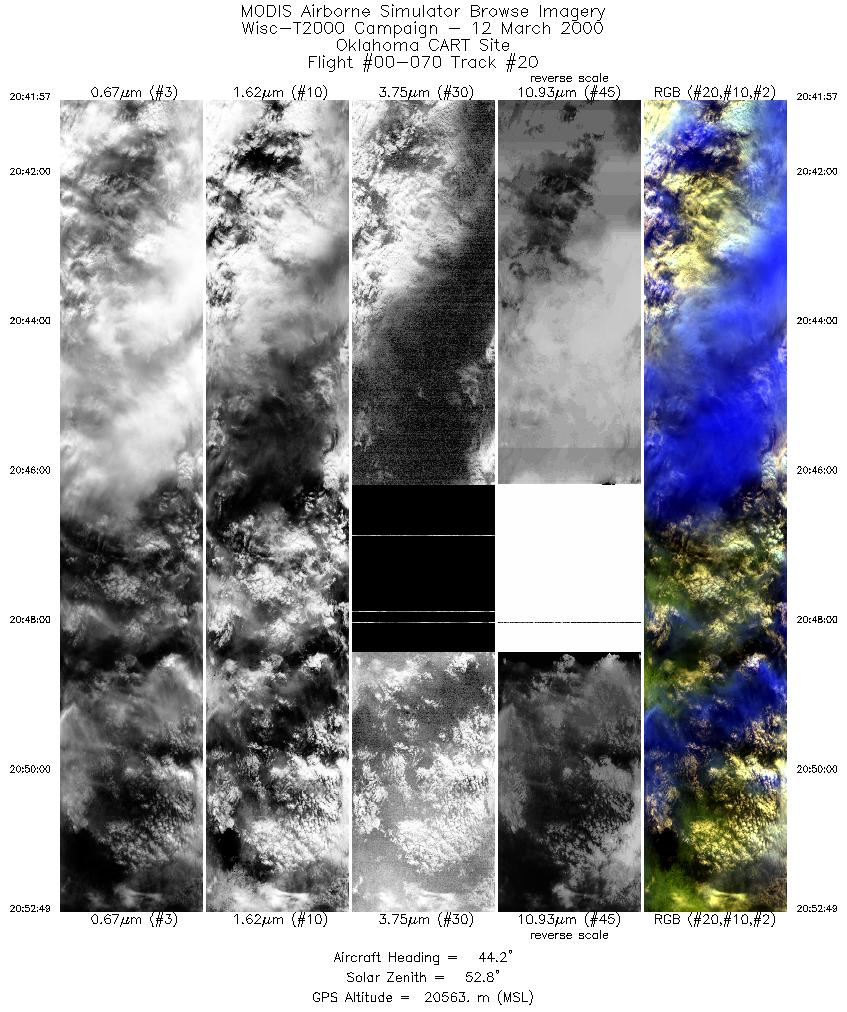
Coincident ER-2 and MISR data in mostly clear (some thin cirrus?) conditions over CART Central Facility. Much MAS data of clouds
advecting over CF ground based instruments. Coincident measurements by ER-2 and Citation of cirrus cloud. |
|||||||||||||||||||||||||||||||||||||||||||||||||||||||||||||||||||||||||||||||||||||||||||||||||||||||||||||||||||||||||||||||||||||||||||||||||||||||||||||||||||||||||||||||

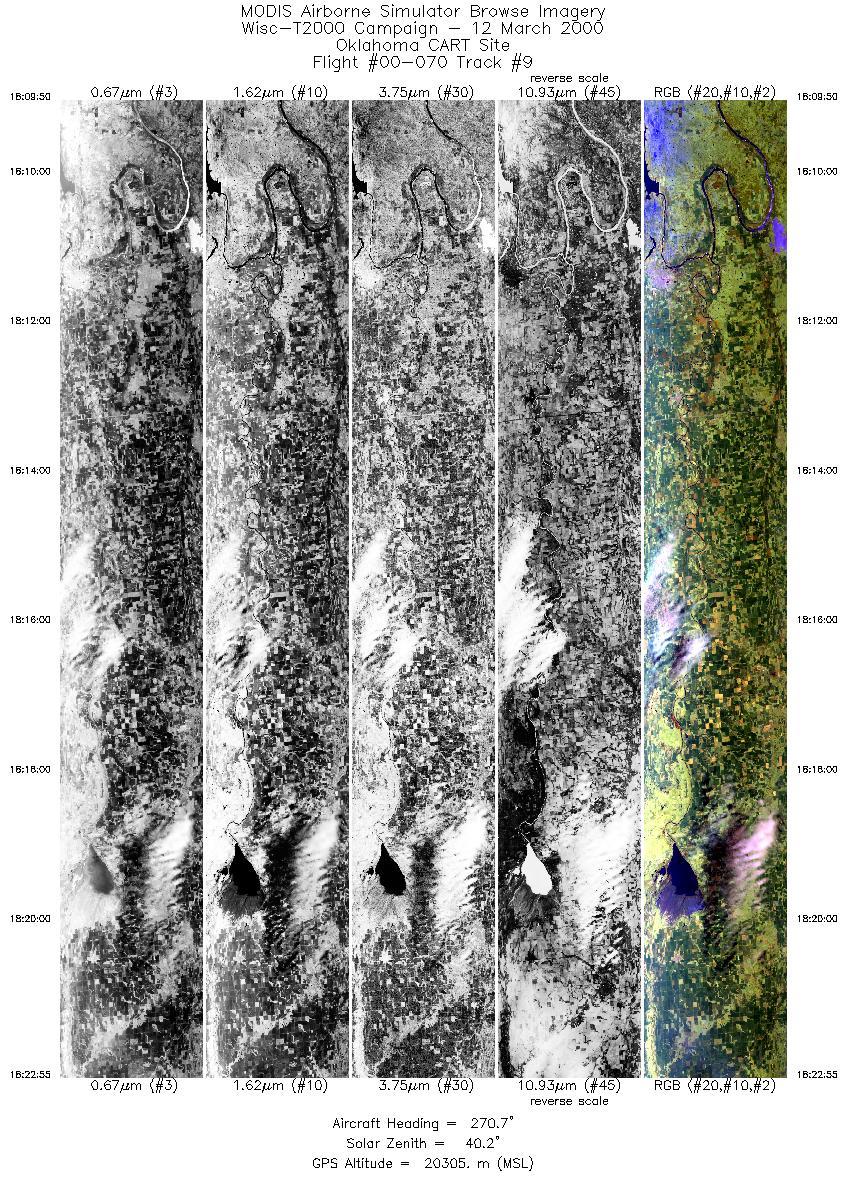
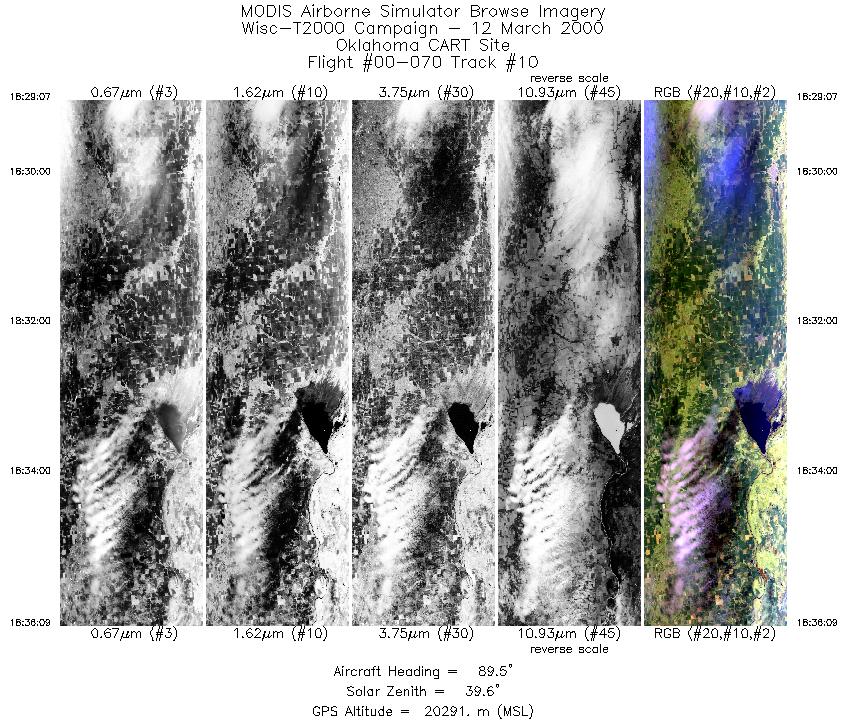
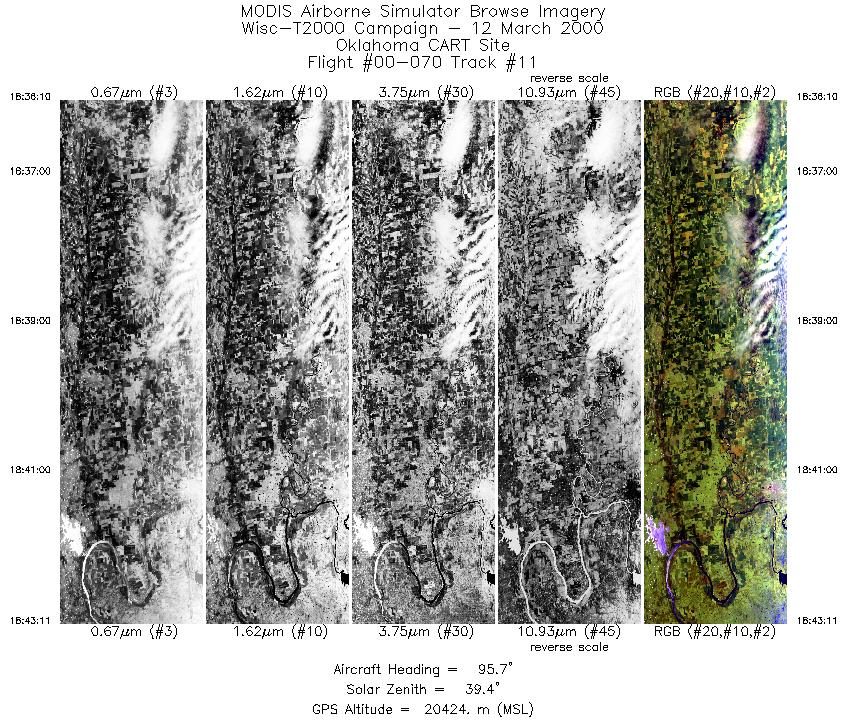
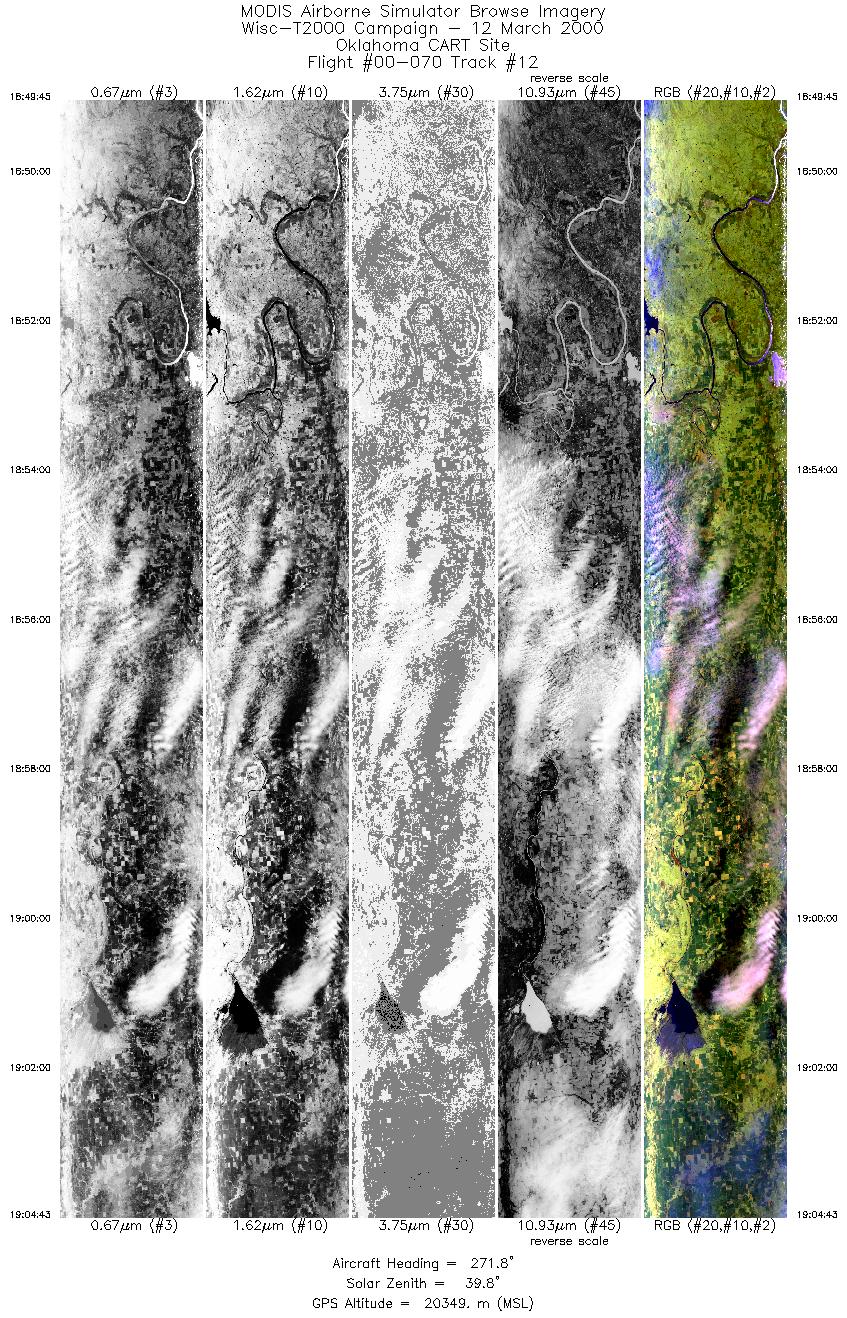
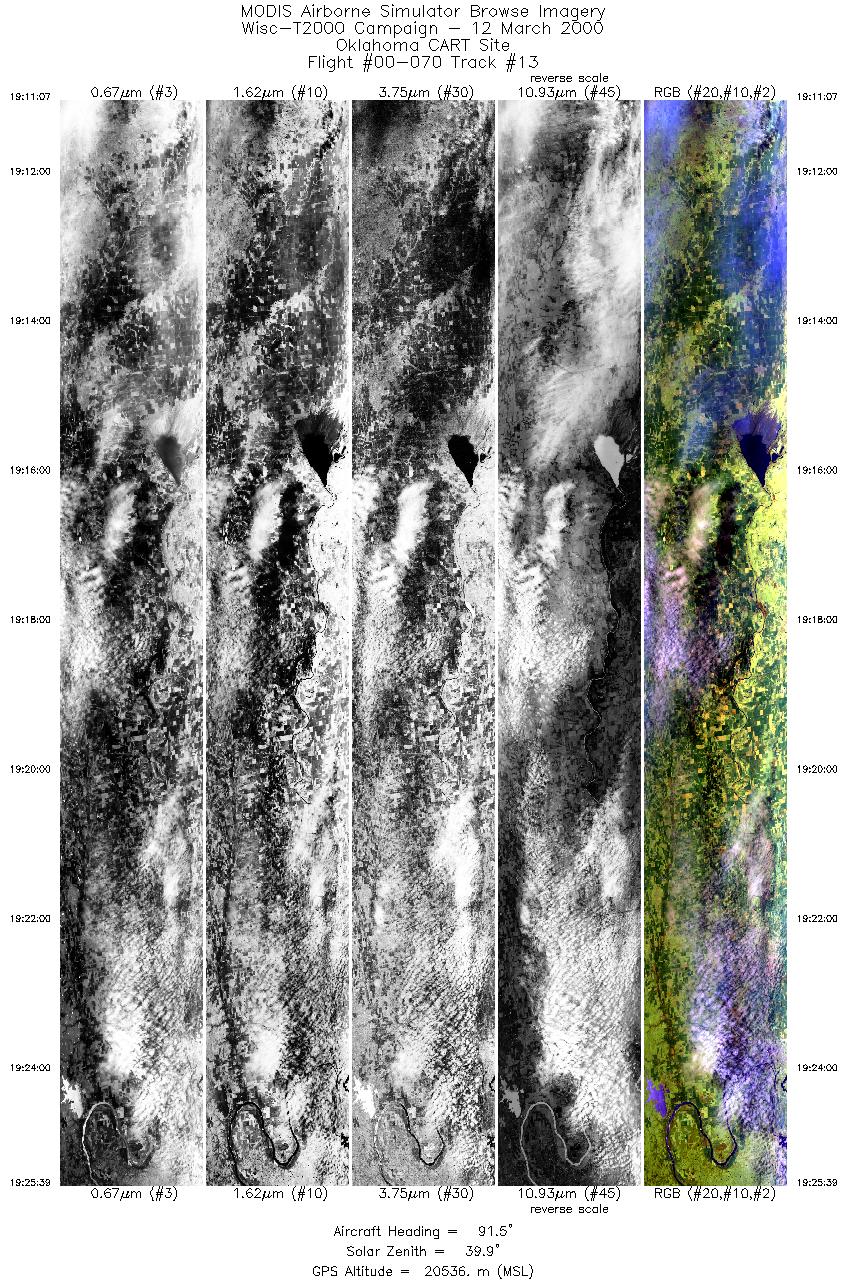
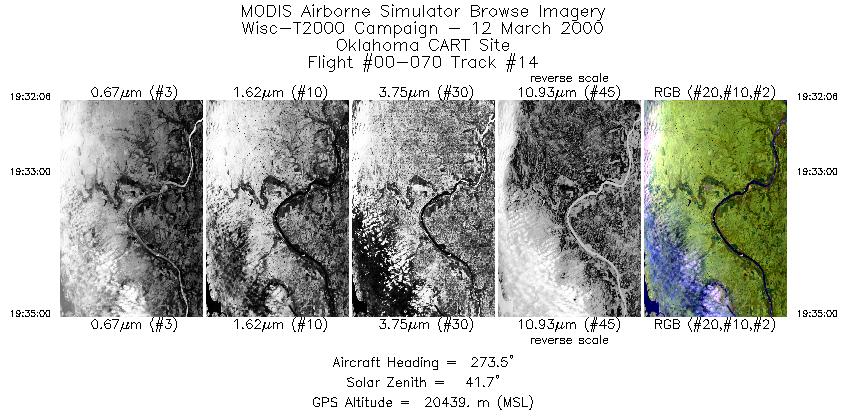
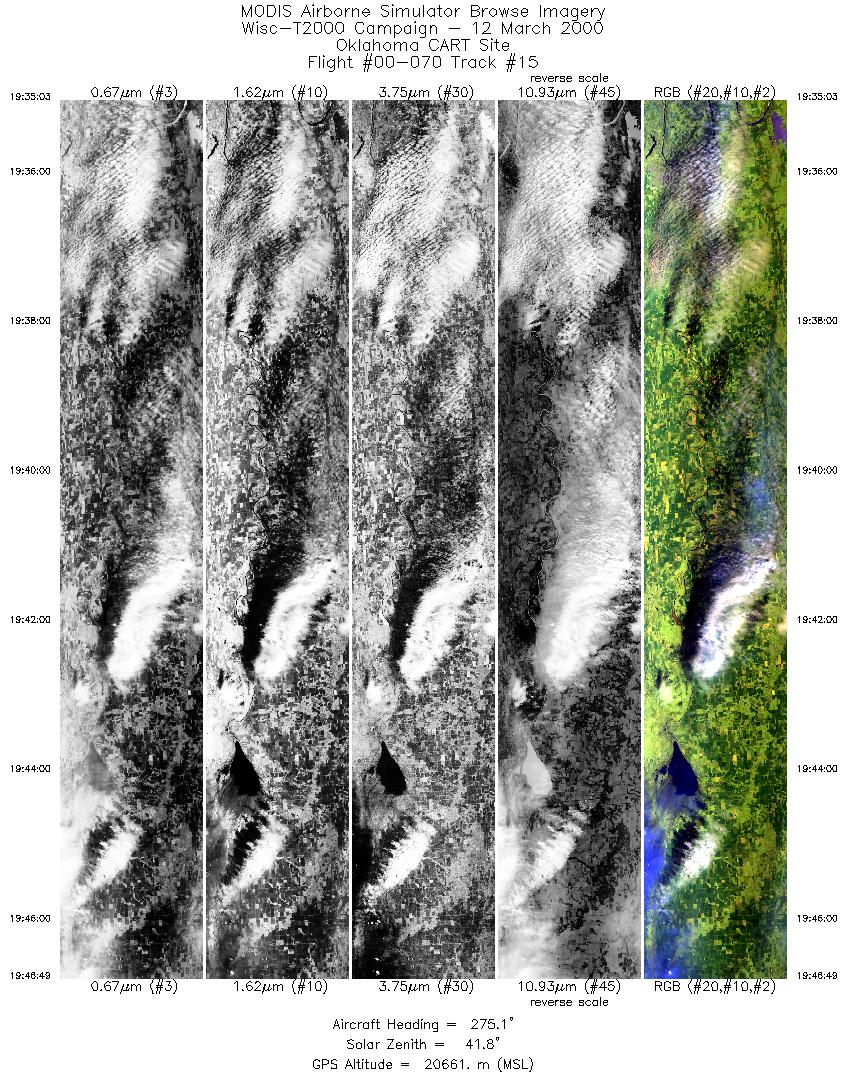
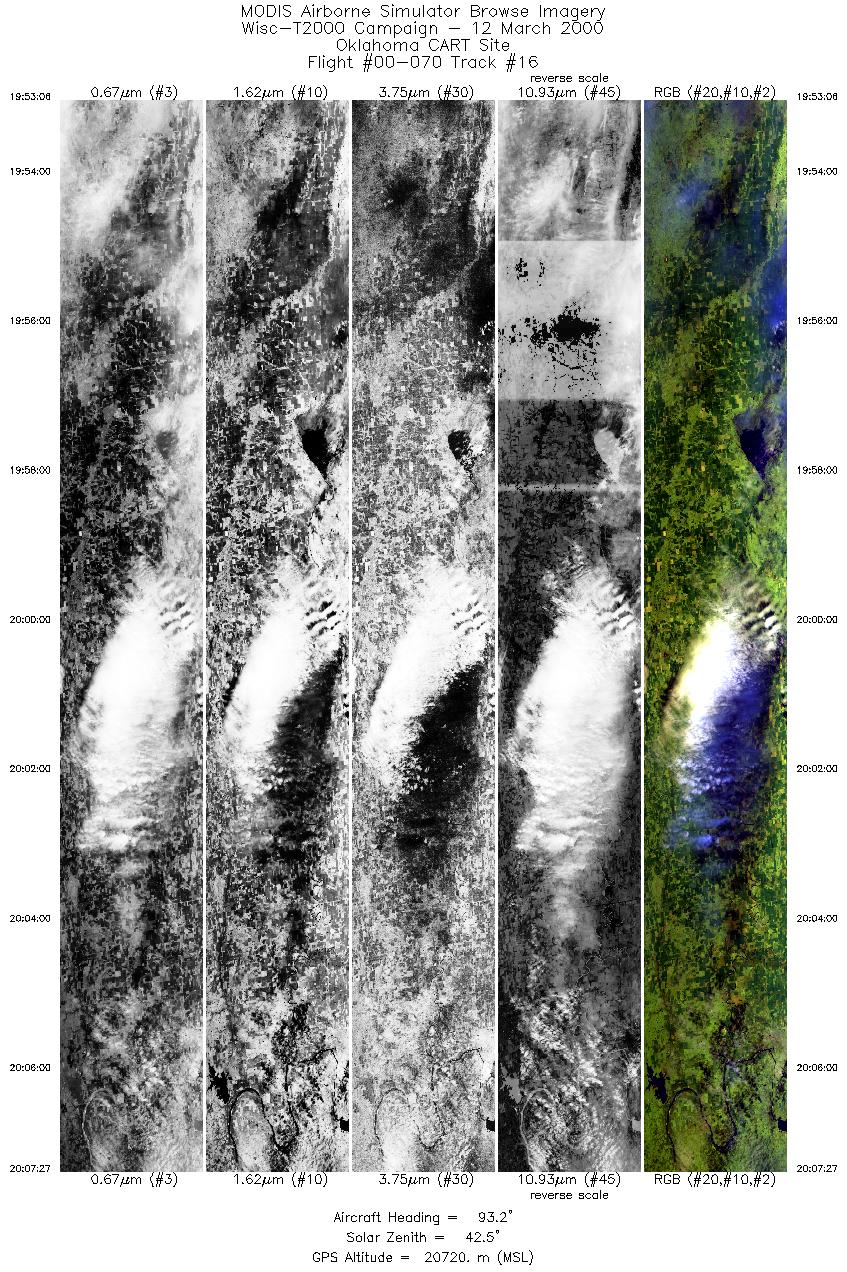
Flight 00-070


| Sample Imagery |
| Click image for full resolution |
|
Track #12 Oklahoma CART Site |


|
|
R: 2.13µm G: 1.62µm B: 0.55µm |
- NASA Official: Matt Fladeland
- Project Manager: James Jacobson
- Website Editor: Eric Fraim
- Last Updated: November 16, 2021


