


MODIS Airborne Simulator (MAS)
FLIGHT SUMMARY INFORMATION


|
Flight: 00-065 Date: 1 March 2000 Location: Oklahoma CART Site Deployment: WISC T2000 Principal Investigator: Moeller (UWisc) Additional Sensors: AirMISR, CLS, RC-10 (6" BW), SHIS, VIS |
|||||||||||||||||||||||||||||||||||||||||||||||||||||||||||||||||||||||||||||||||||||||||||||||||||||||||||||||||||||||||||||||||||||
|
Data Evaluation Overall quality is good |
|||||||||||||||||||||||||||||||||||||||||||||||||||||||||||||||||||||||||||||||||||||||||||||||||||||||||||||||||||||||||||||||||||||
|
Processing Information Level-1B Data in HDF format is available Flight Line Summary Spectral Band Configuration Spectral Response Function Table |
|||||||||||||||||||||||||||||||||||||||||||||||||||||||||||||||||||||||||||||||||||||||||||||||||||||||||||||||||||||||||||||||||||||
|
Browse Imagery Flight Tracks: 15 Scanlines: 75078 |
|||||||||||||||||||||||||||||||||||||||||||||||||||||||||||||||||||||||||||||||||||||||||||||||||||||||||||||||||||||||||||||||||||||
|
|||||||||||||||||||||||||||||||||||||||||||||||||||||||||||||||||||||||||||||||||||||||||||||||||||||||||||||||||||||||||||||||||||||
|
Objective and Summary:
Take-off was at 1543 UTC. ER-2 landed at 2052 UTC.
Learjet flew short (~25km) legs attempting to sample cirrus. ATC prevented them from getting much of the data they wished to obtain.
Reportedly they were sampling cloud at 1900 UTC.
Coincident TERRA/ER-2 data at 1752 UTC (20° view angle) about 15nm south of CF. Coincident ER-2 and Learjet measurements.
CLS data suggests that ice particles from the cirrus was seeding the development of water cloud below. |
|||||||||||||||||||||||||||||||||||||||||||||||||||||||||||||||||||||||||||||||||||||||||||||||||||||||||||||||||||||||||||||||||||||

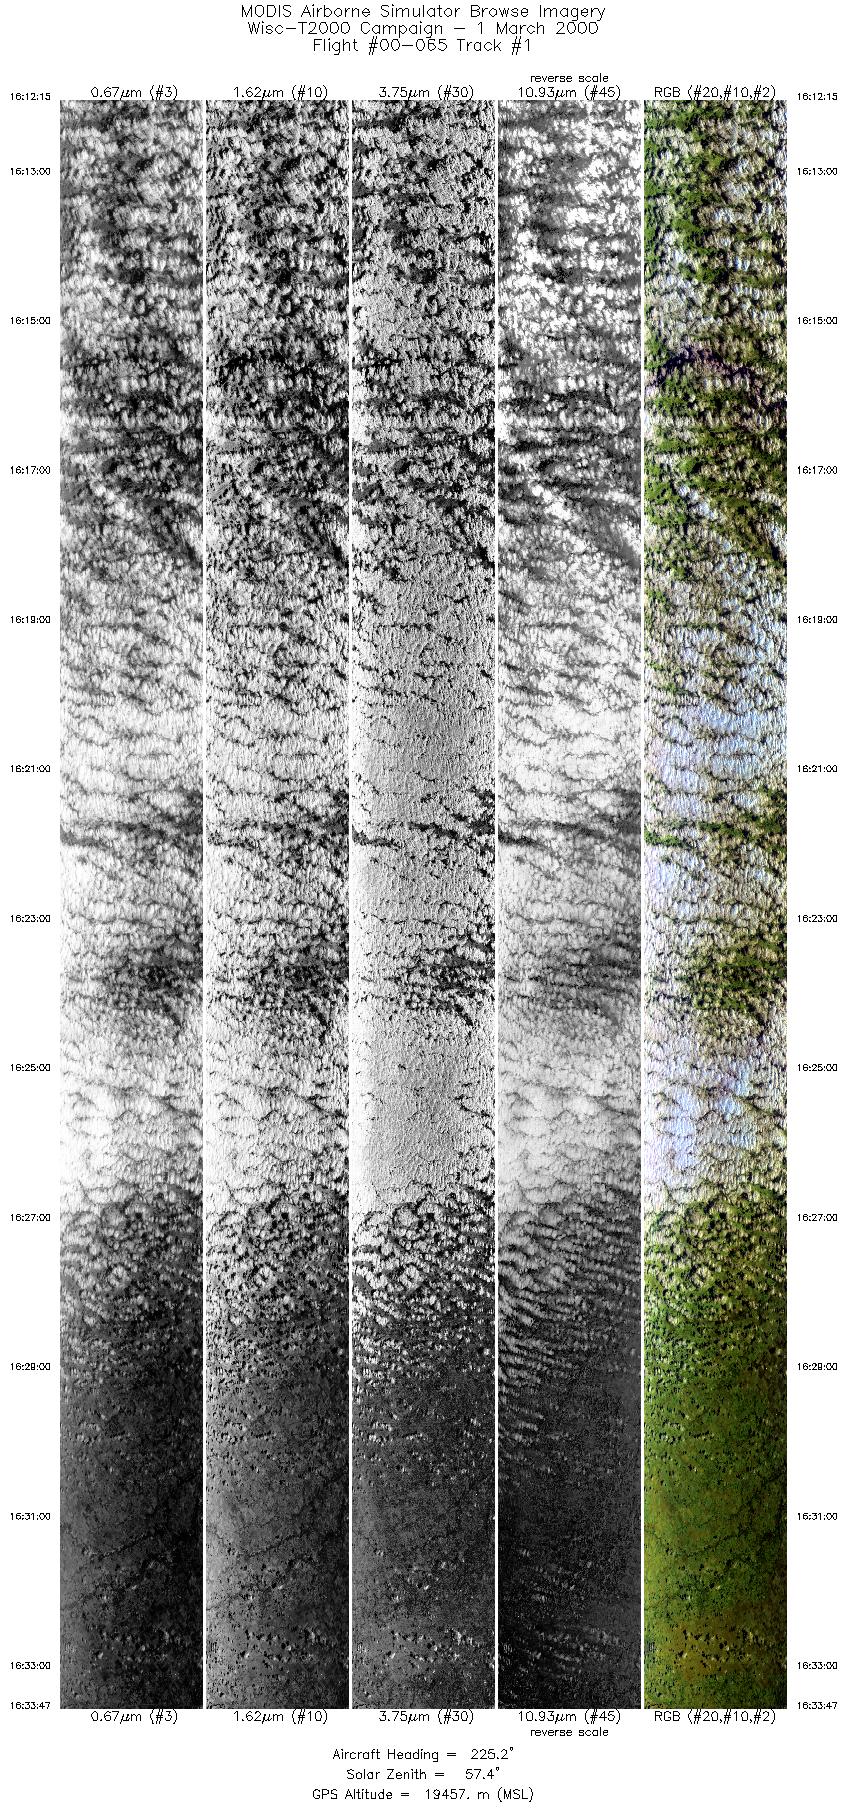
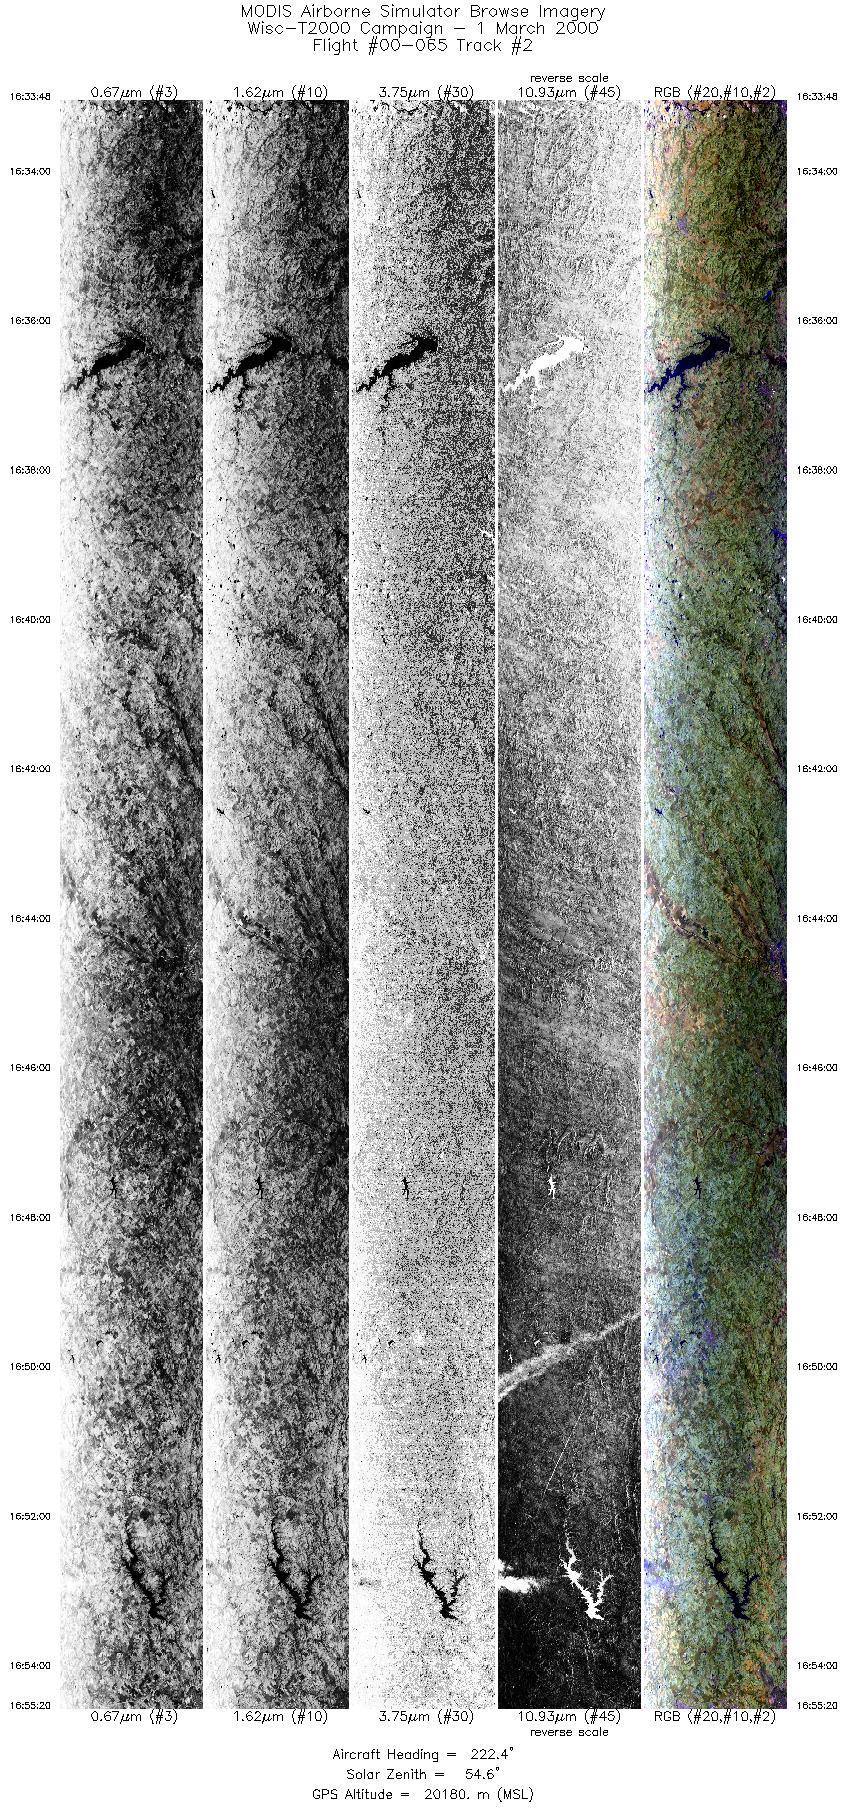
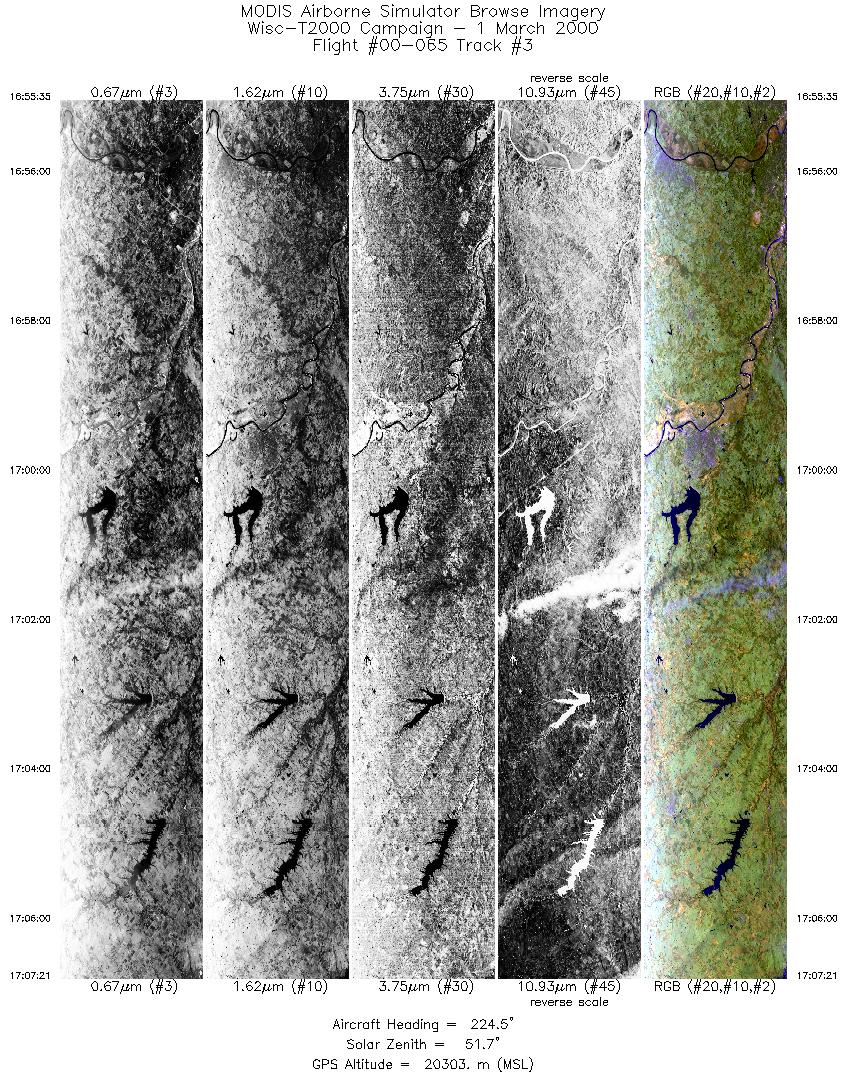
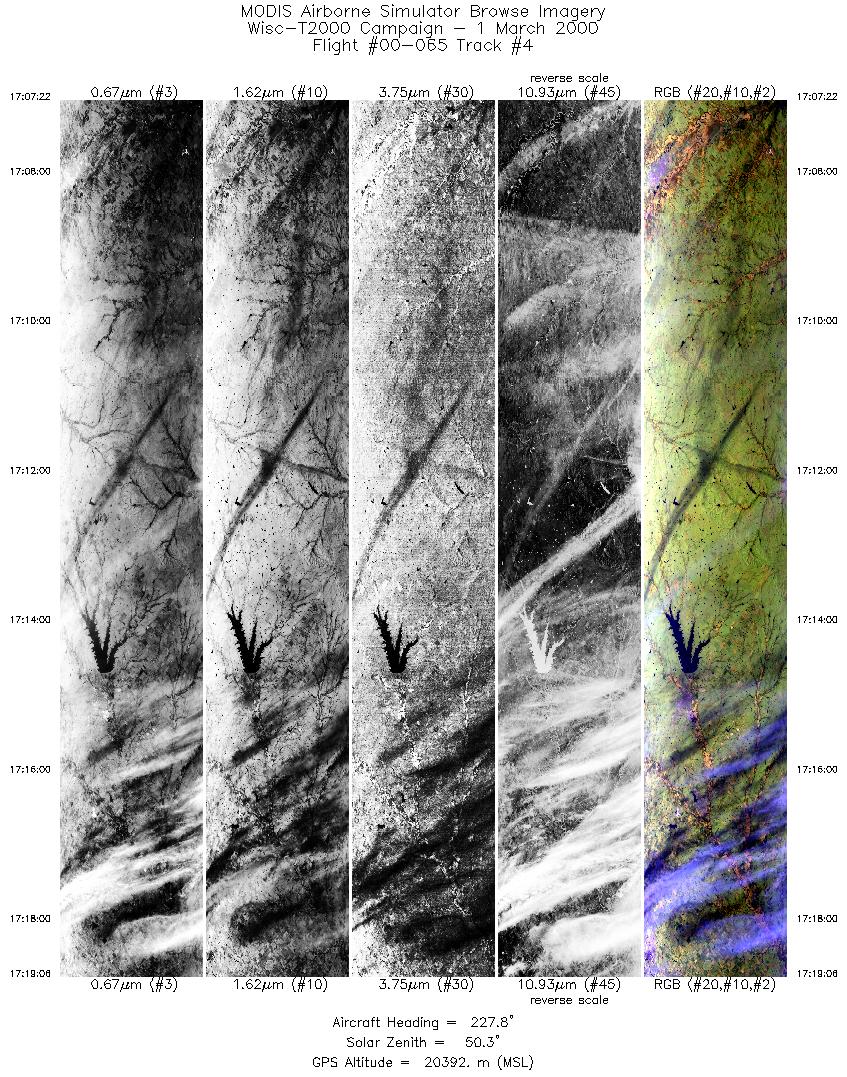
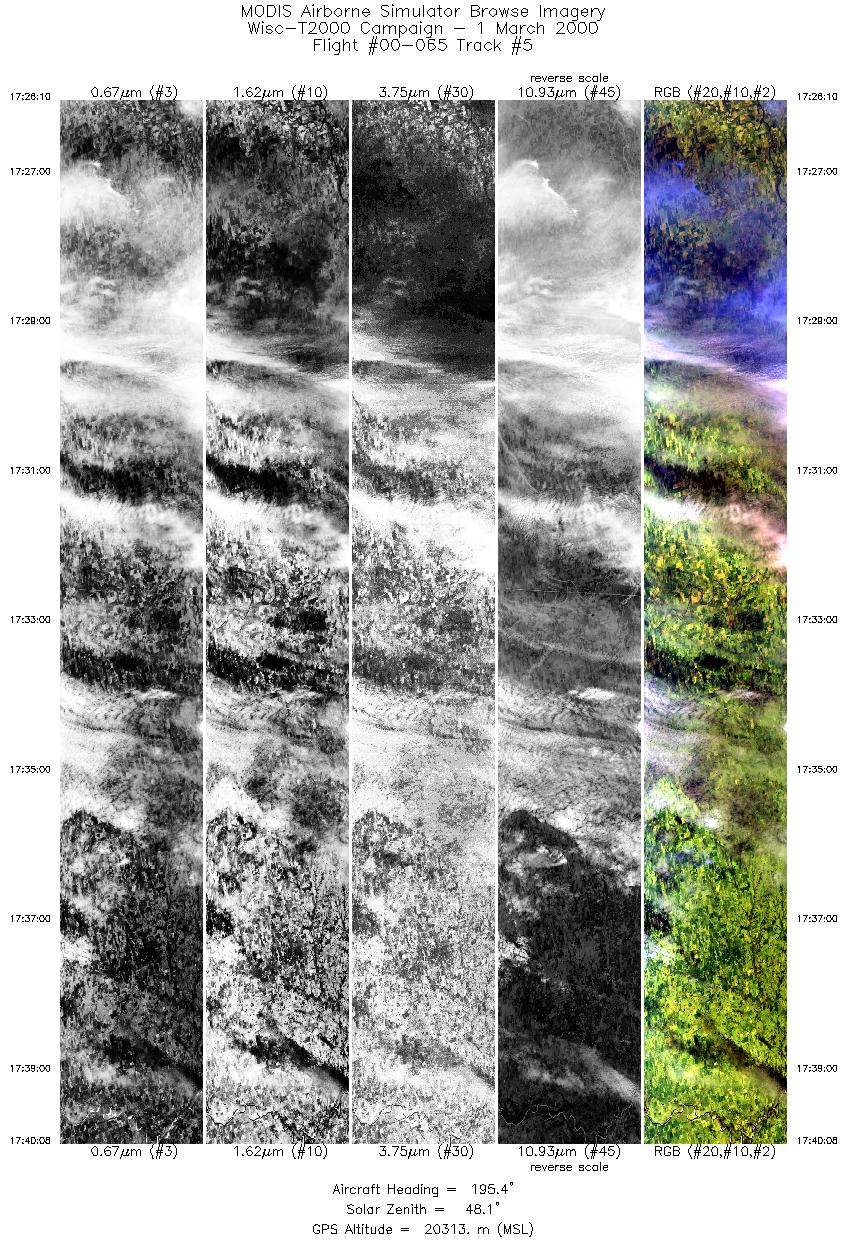
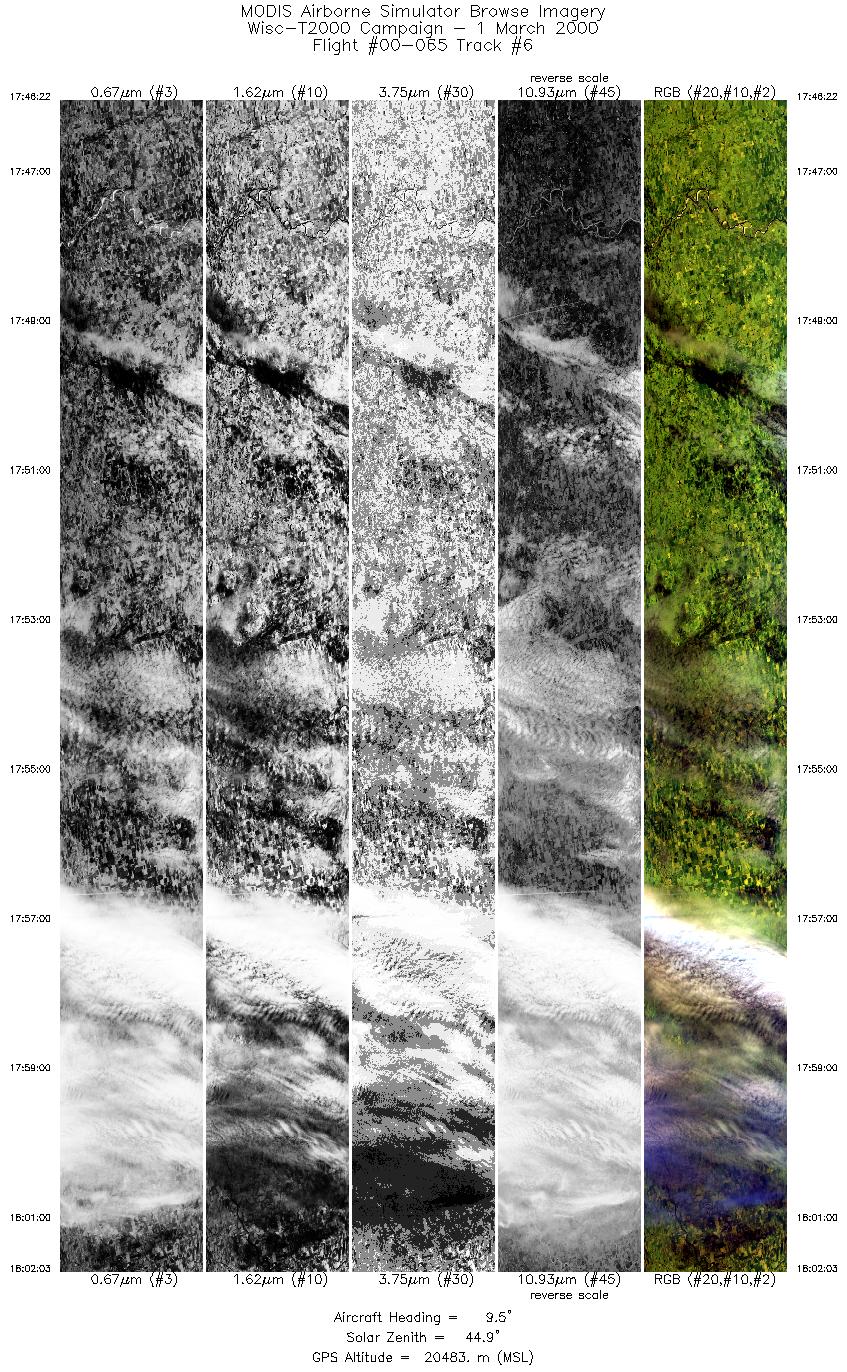
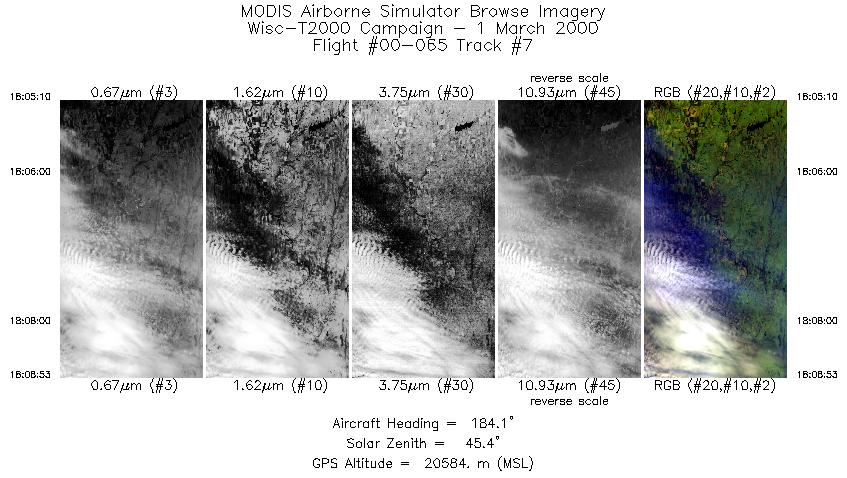
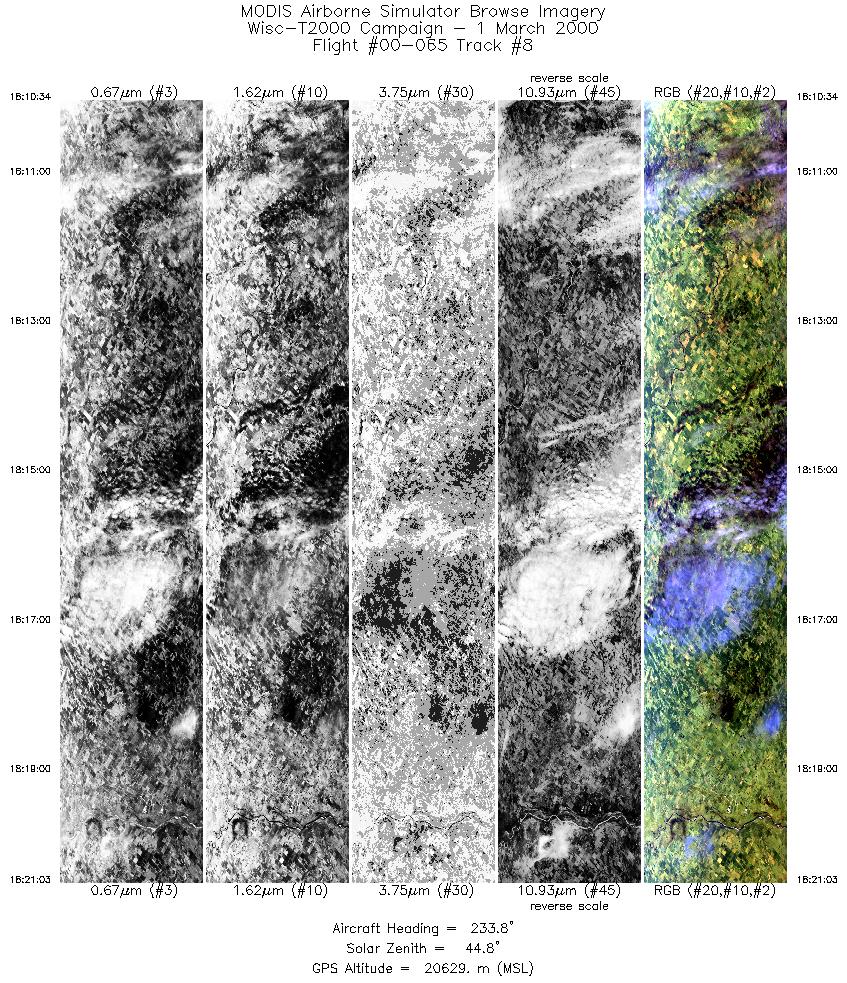
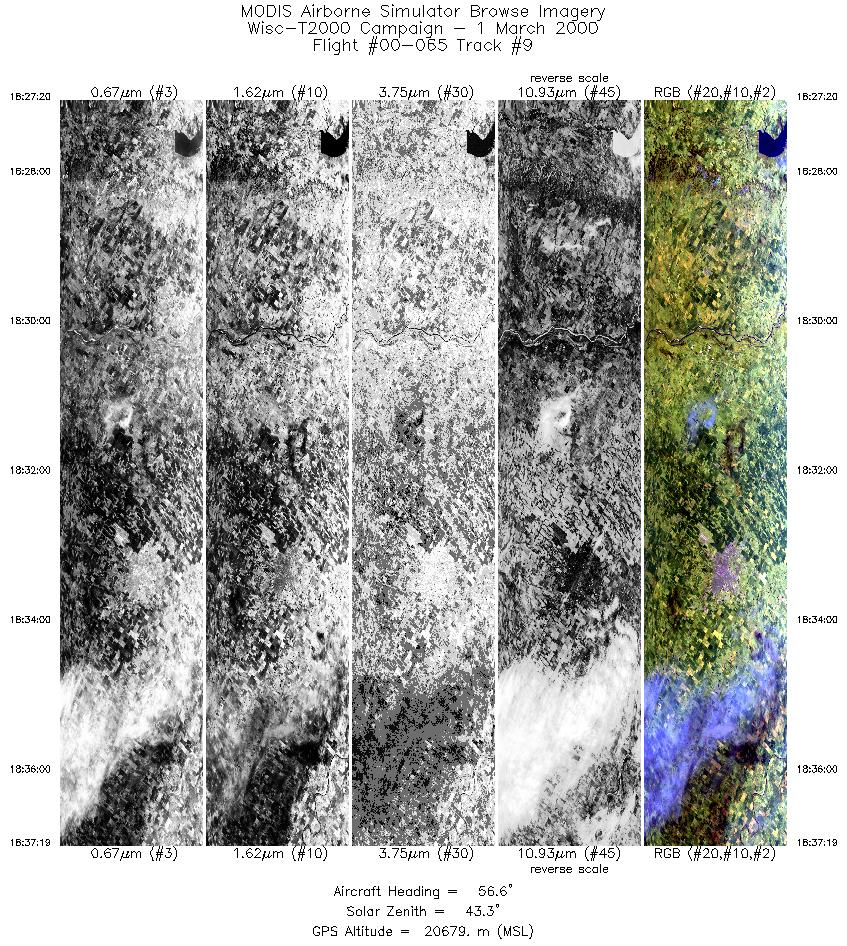
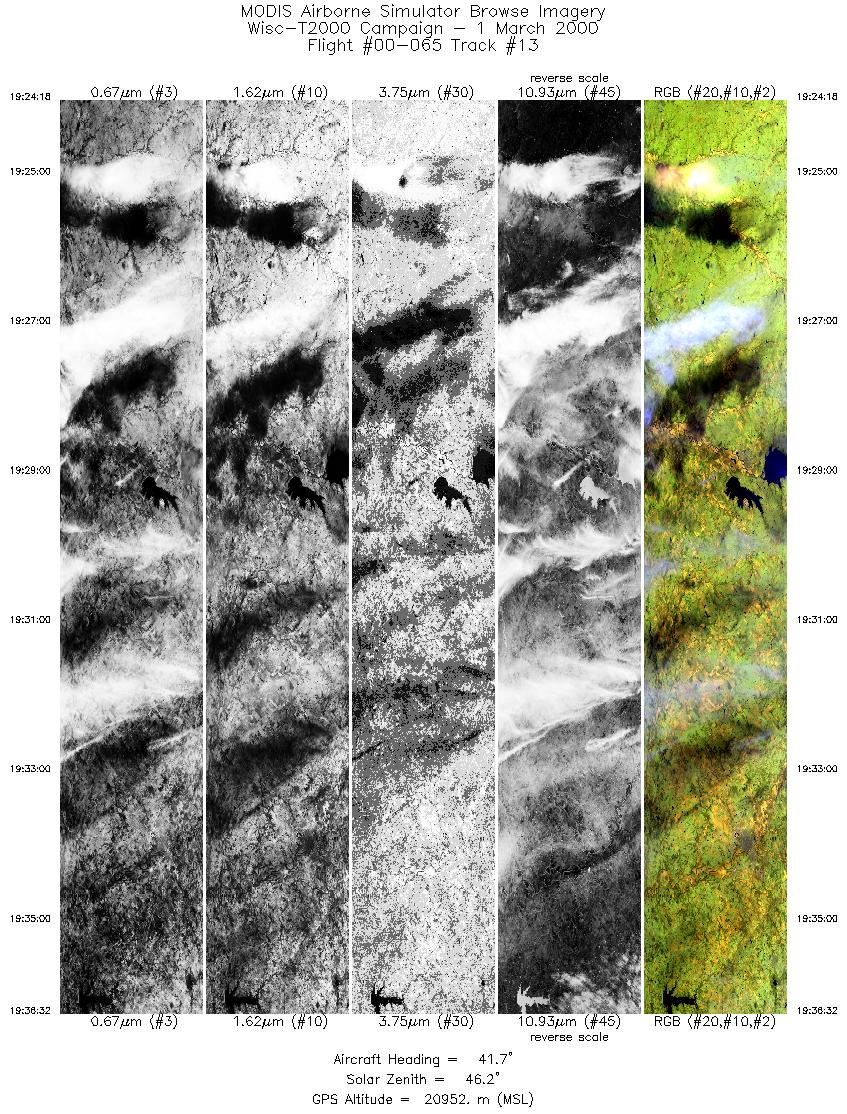
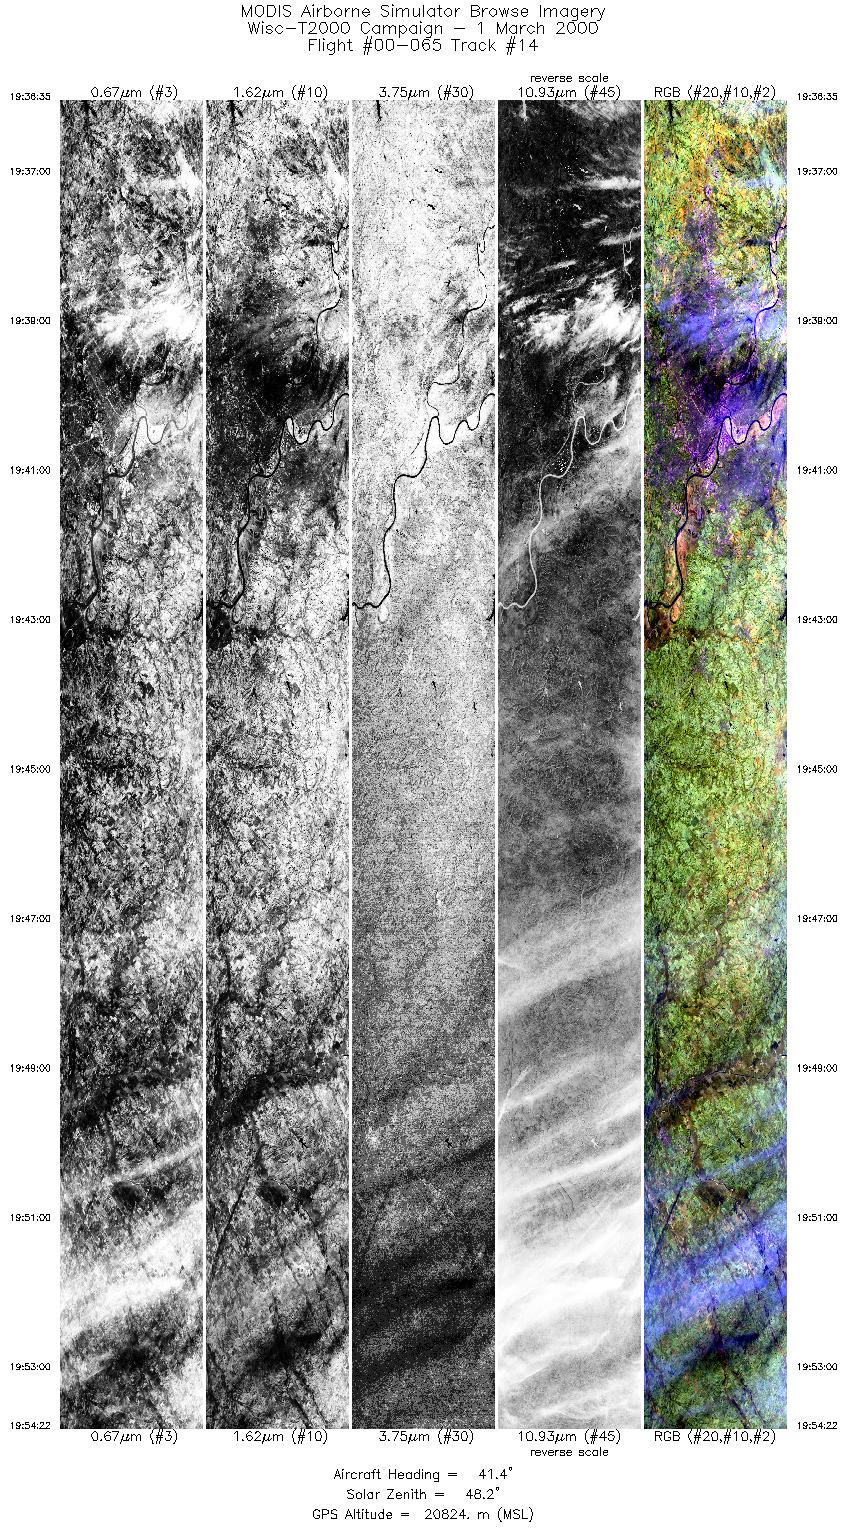
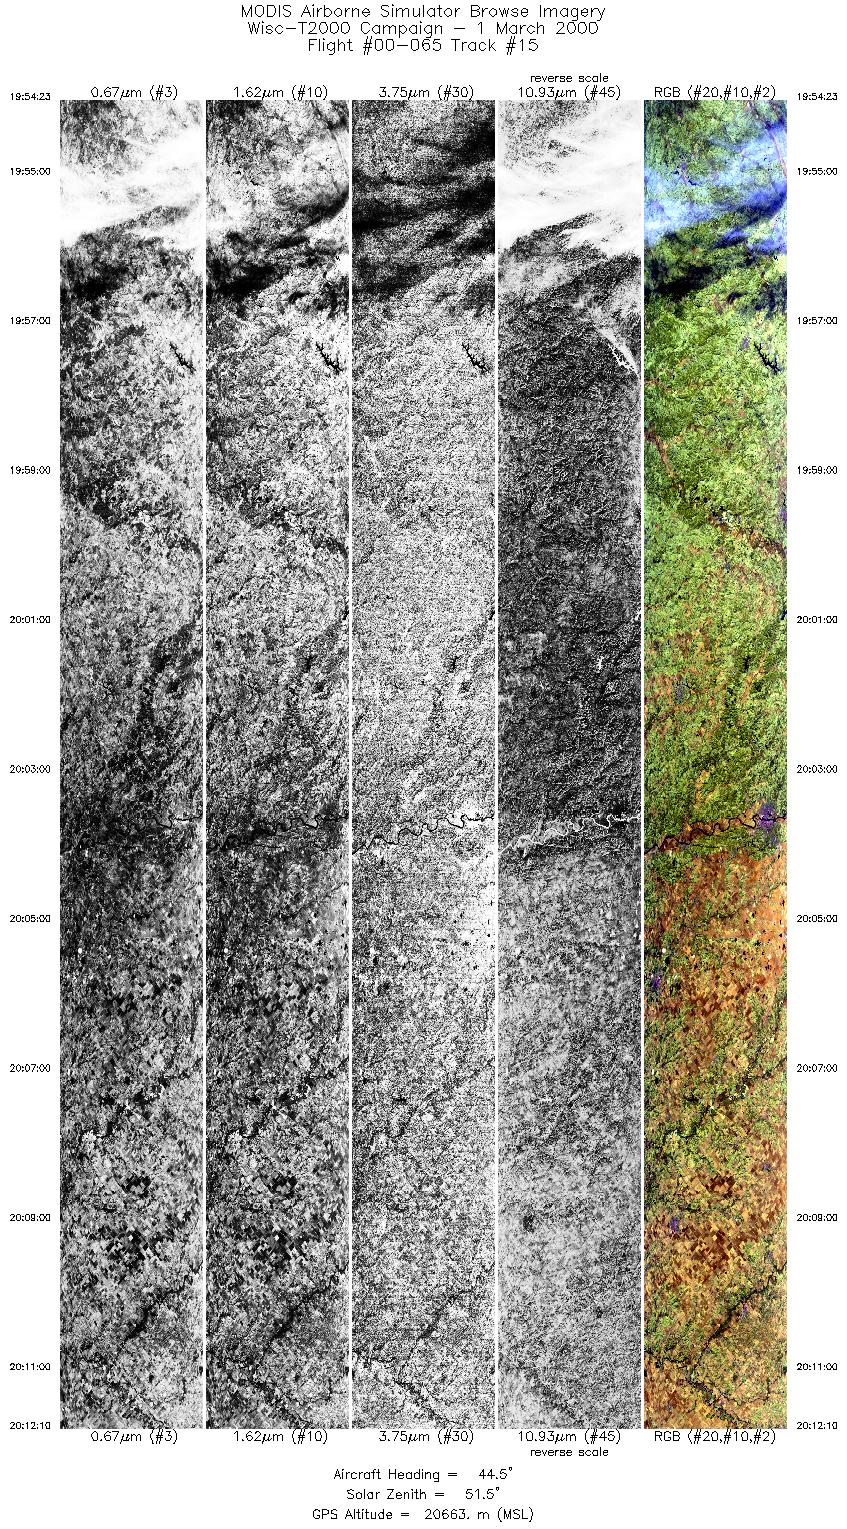
Flight 00-065


| Sample Imagery |
| Click image for full resolution |
|
Track #3 Kansas |


|
|
R: 2.13µm G: 1.62µm B: 0.55µm |
- NASA Official: Matt Fladeland
- Project Manager: James Jacobson
- Website Editor: Eric Fraim
- Last Updated: November 16, 2021


