


FLIGHT SUMMARY INFORMATION
Flight Track Map


|
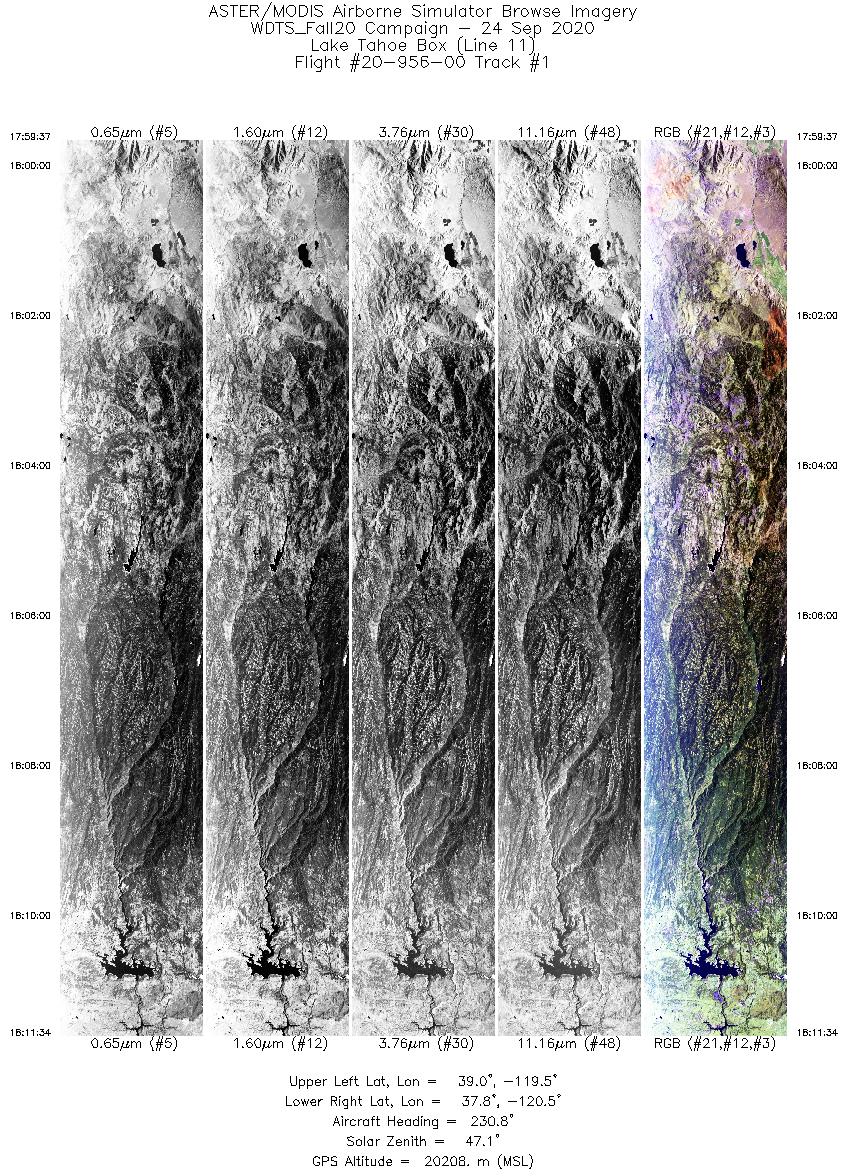
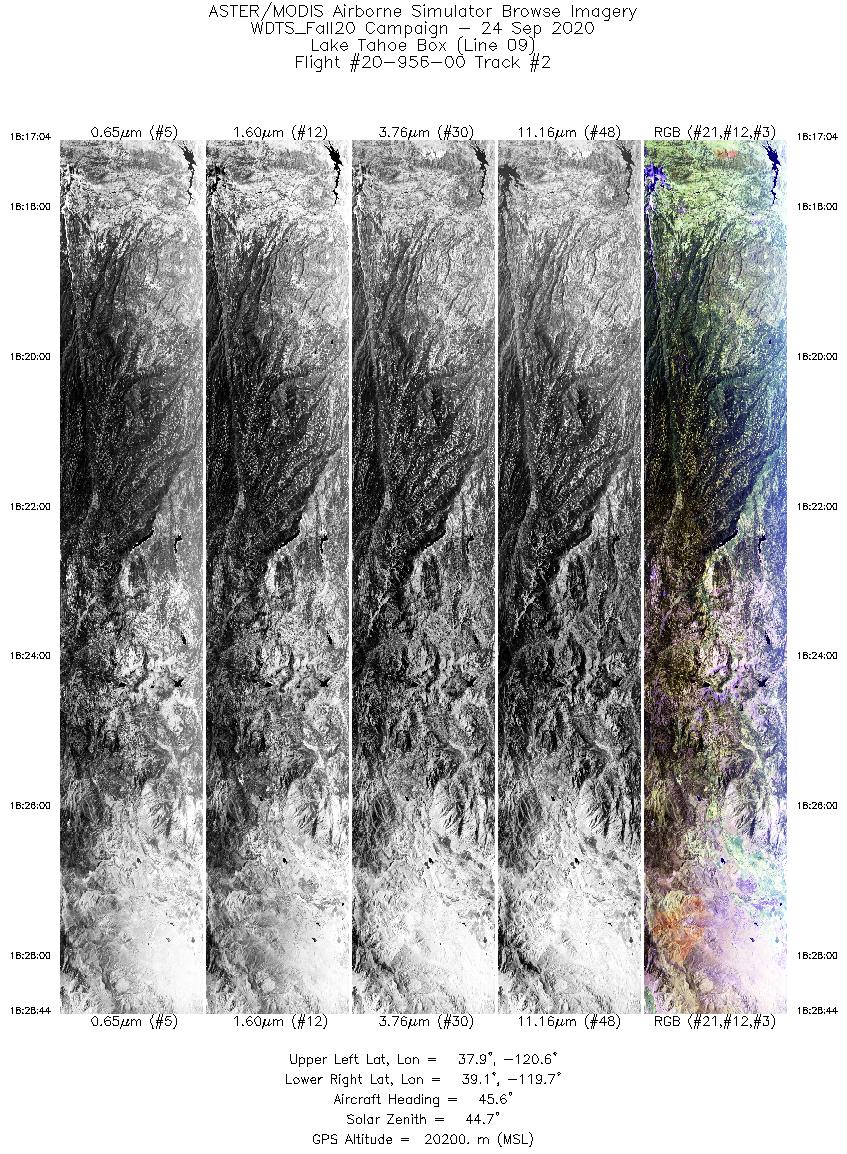
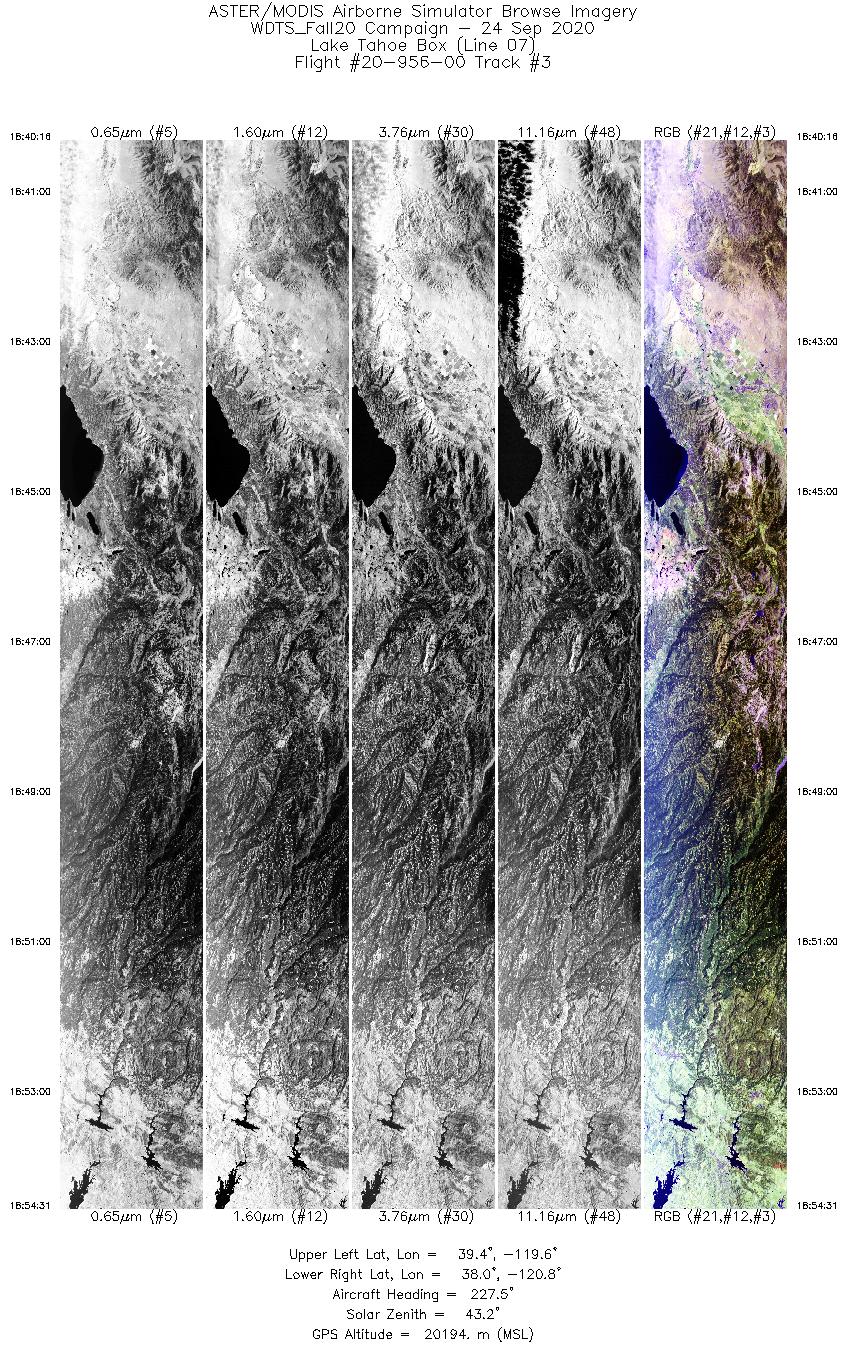
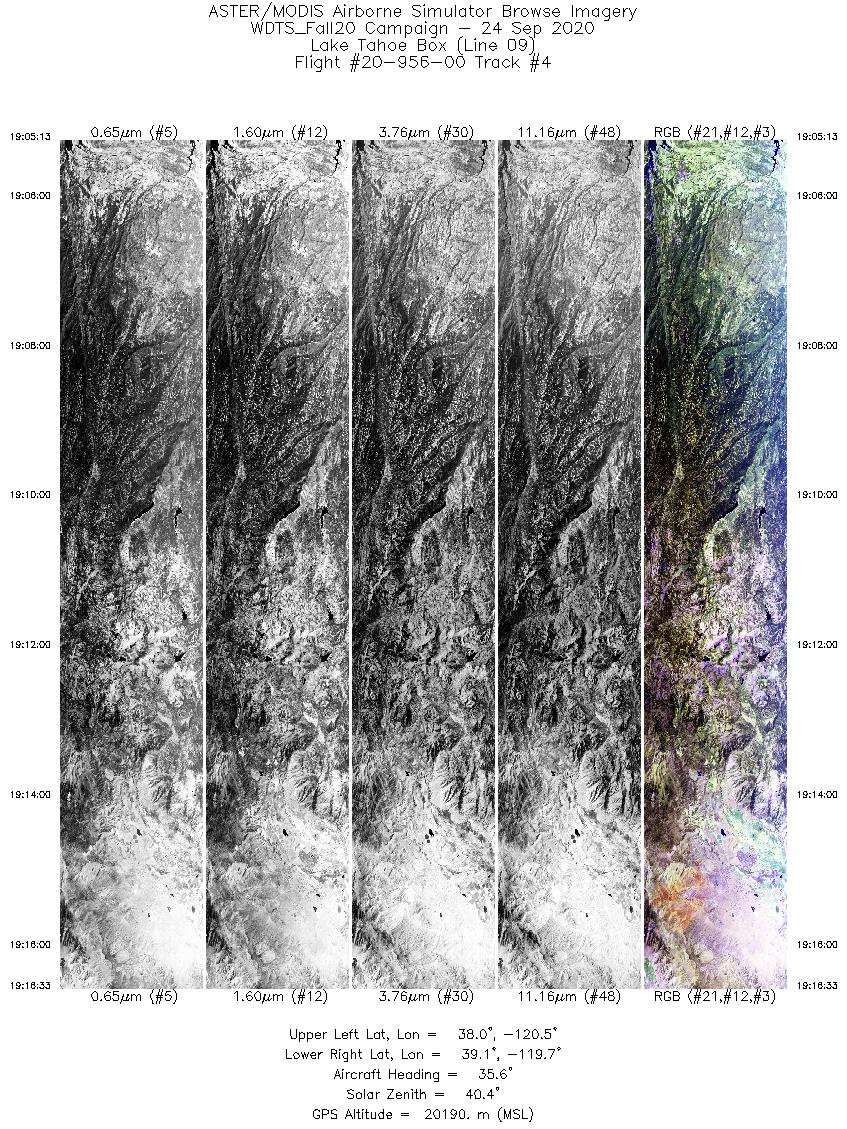
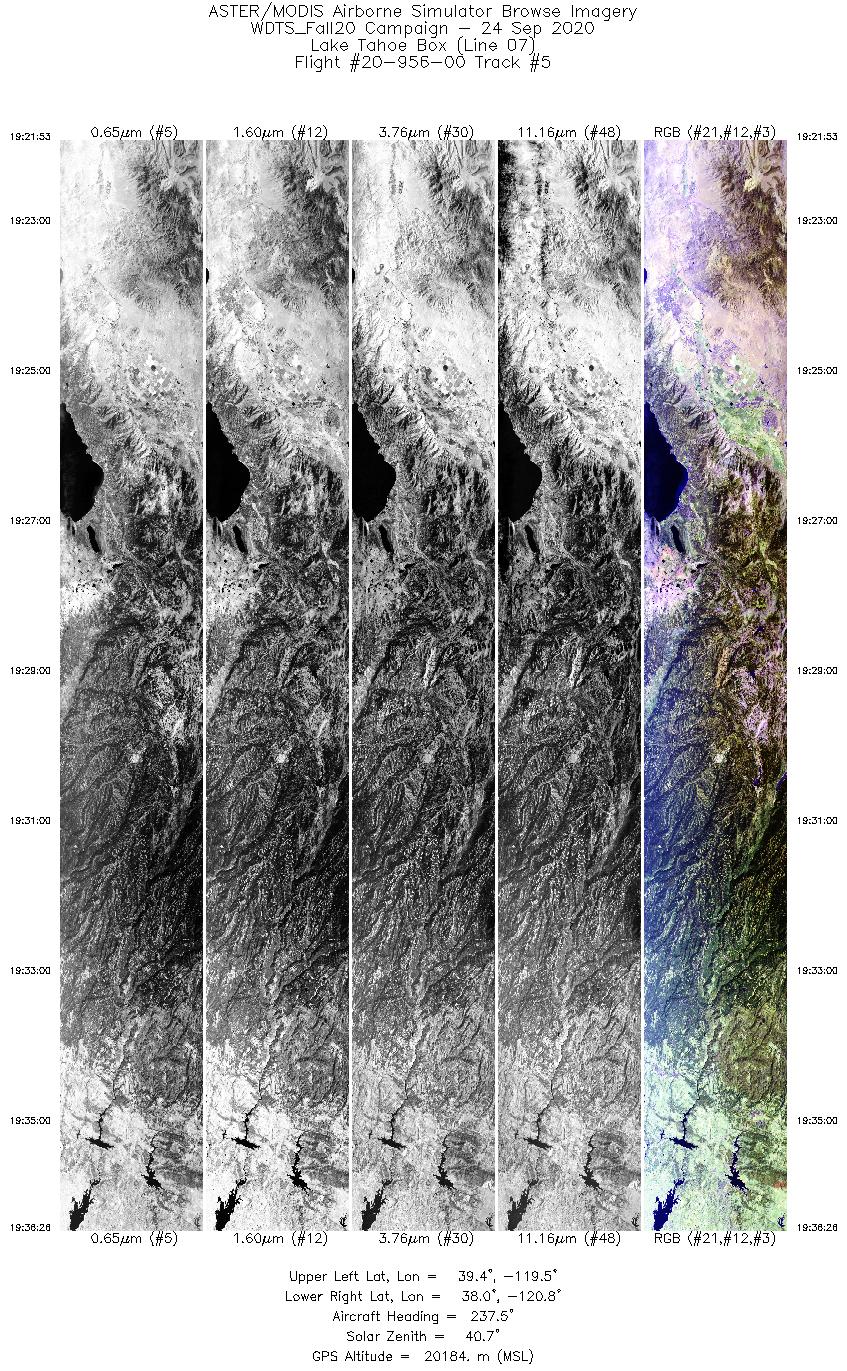
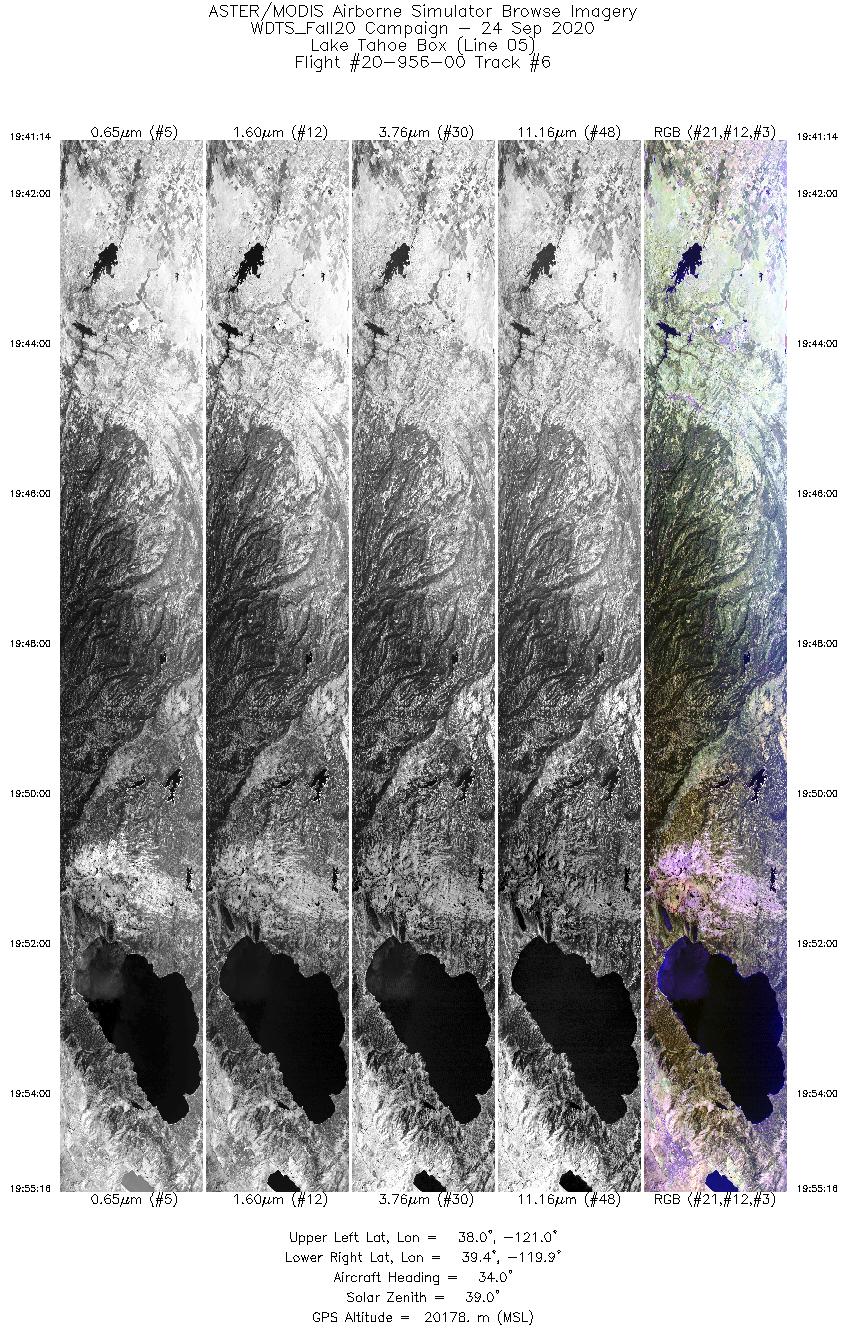
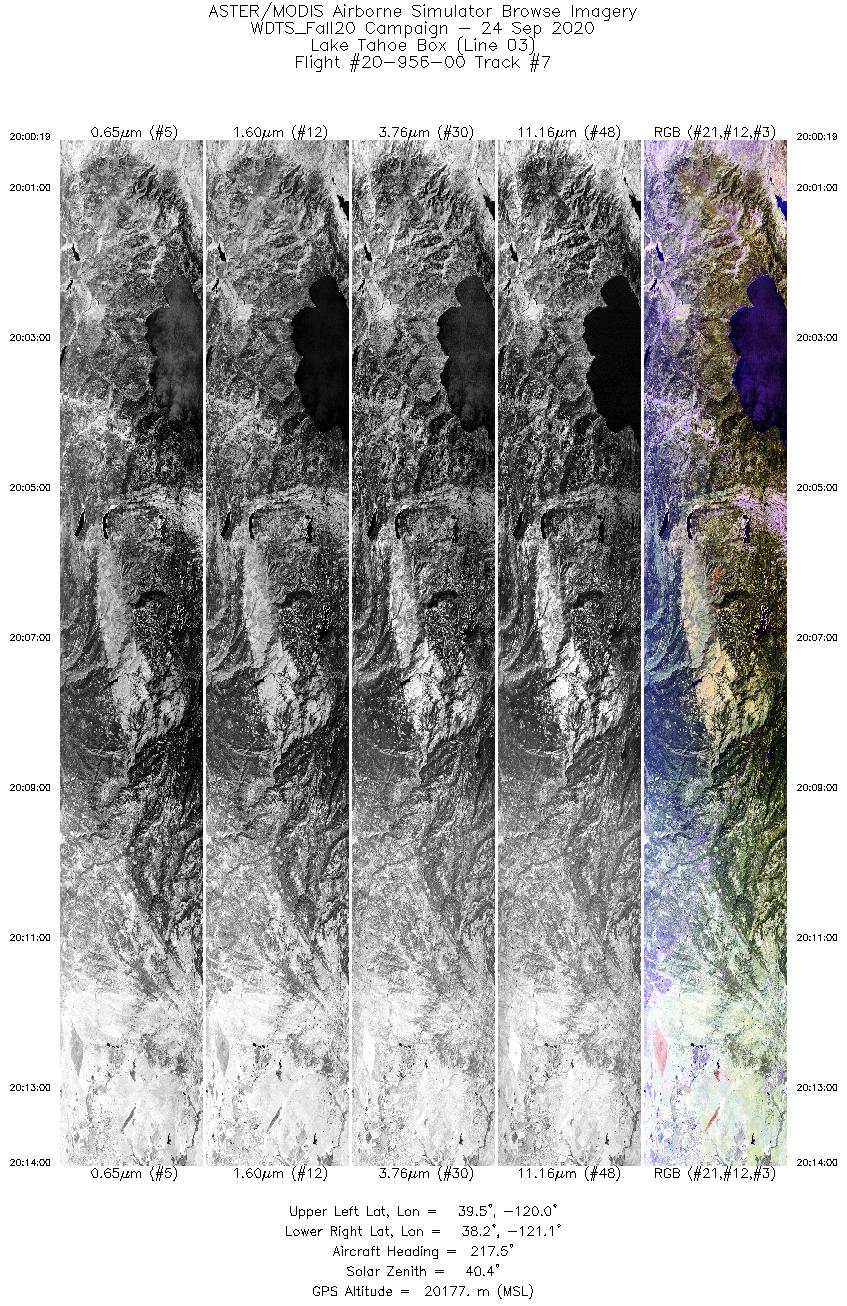
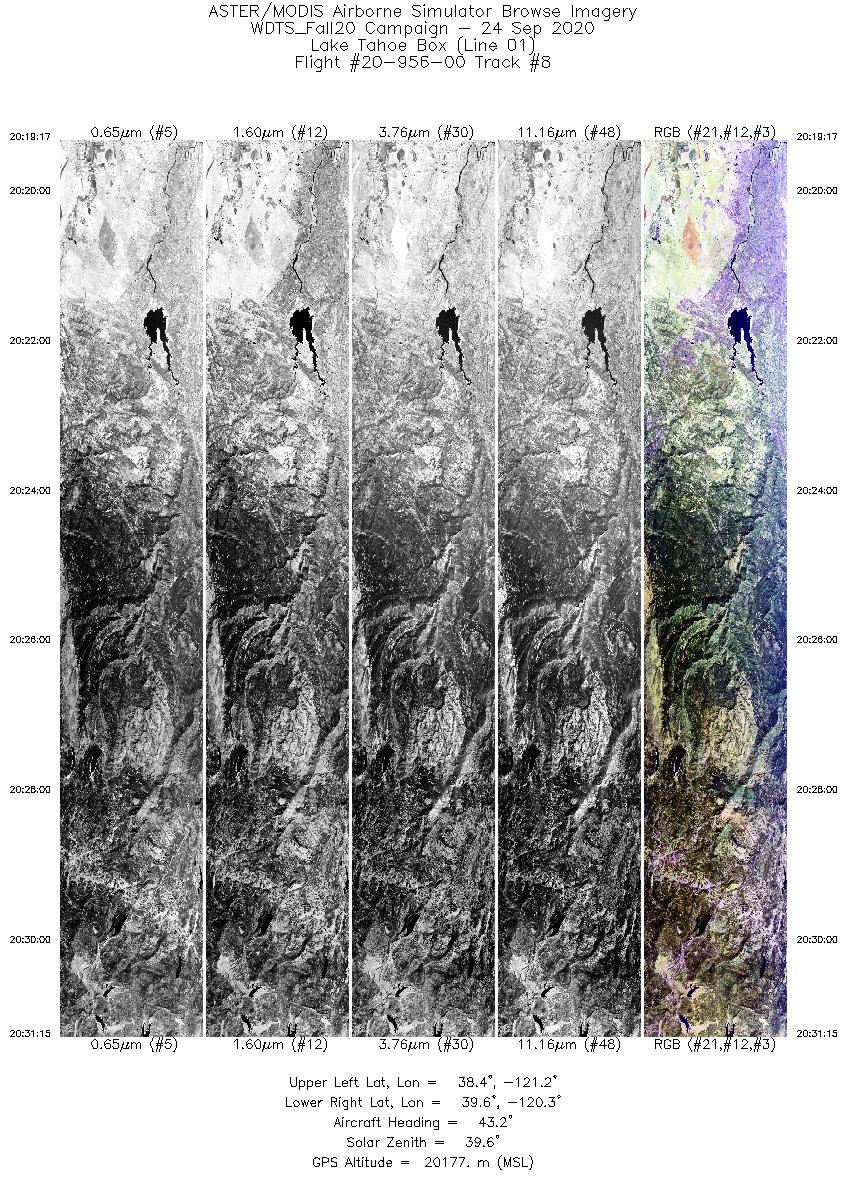
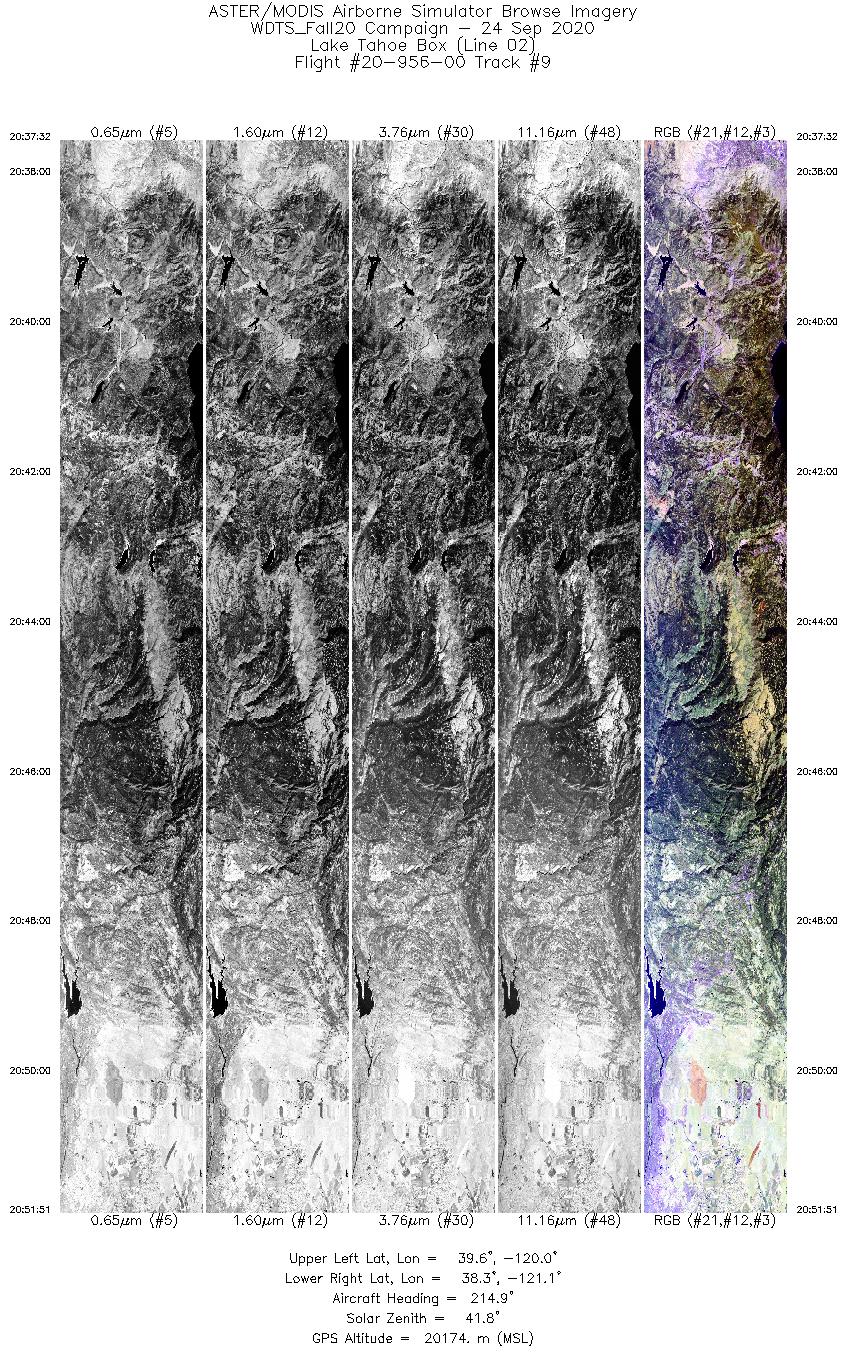
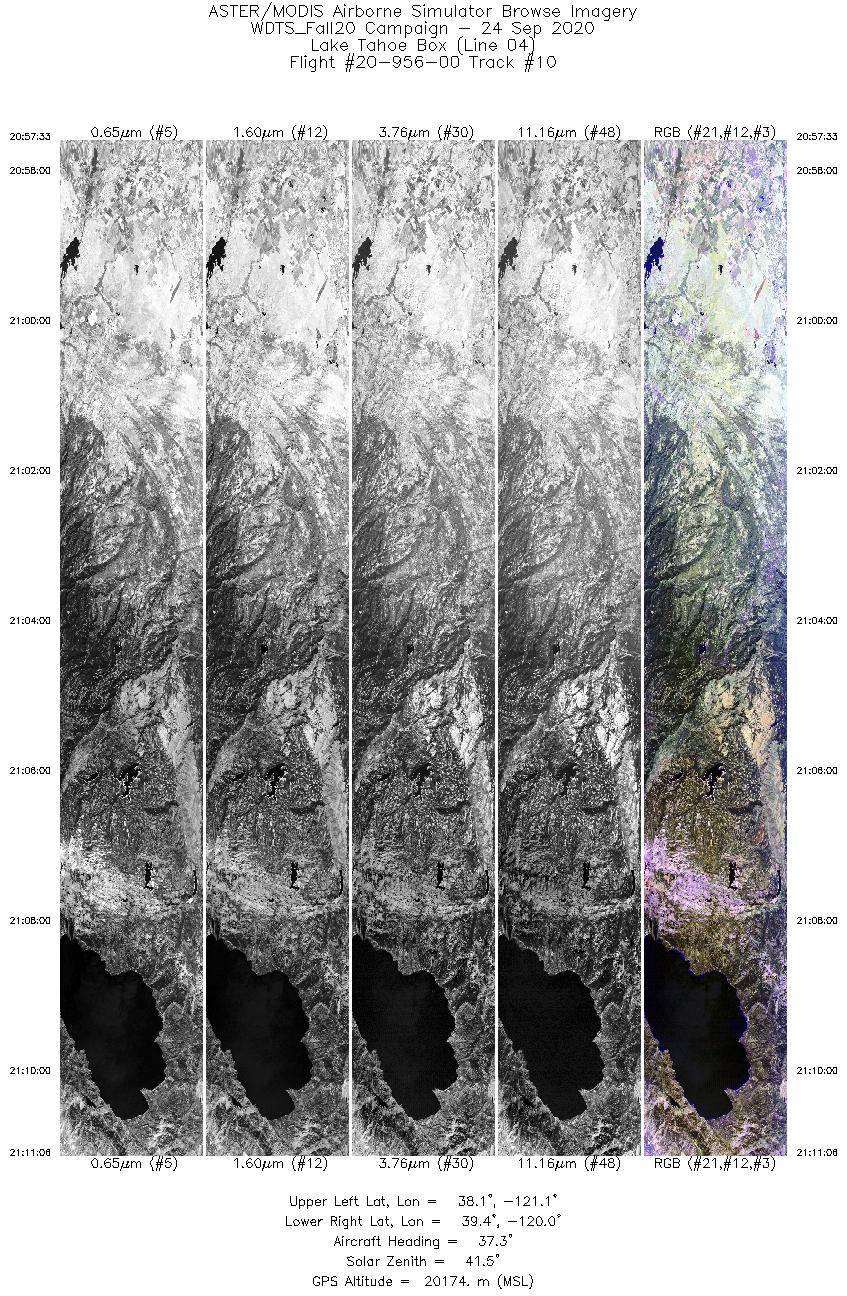
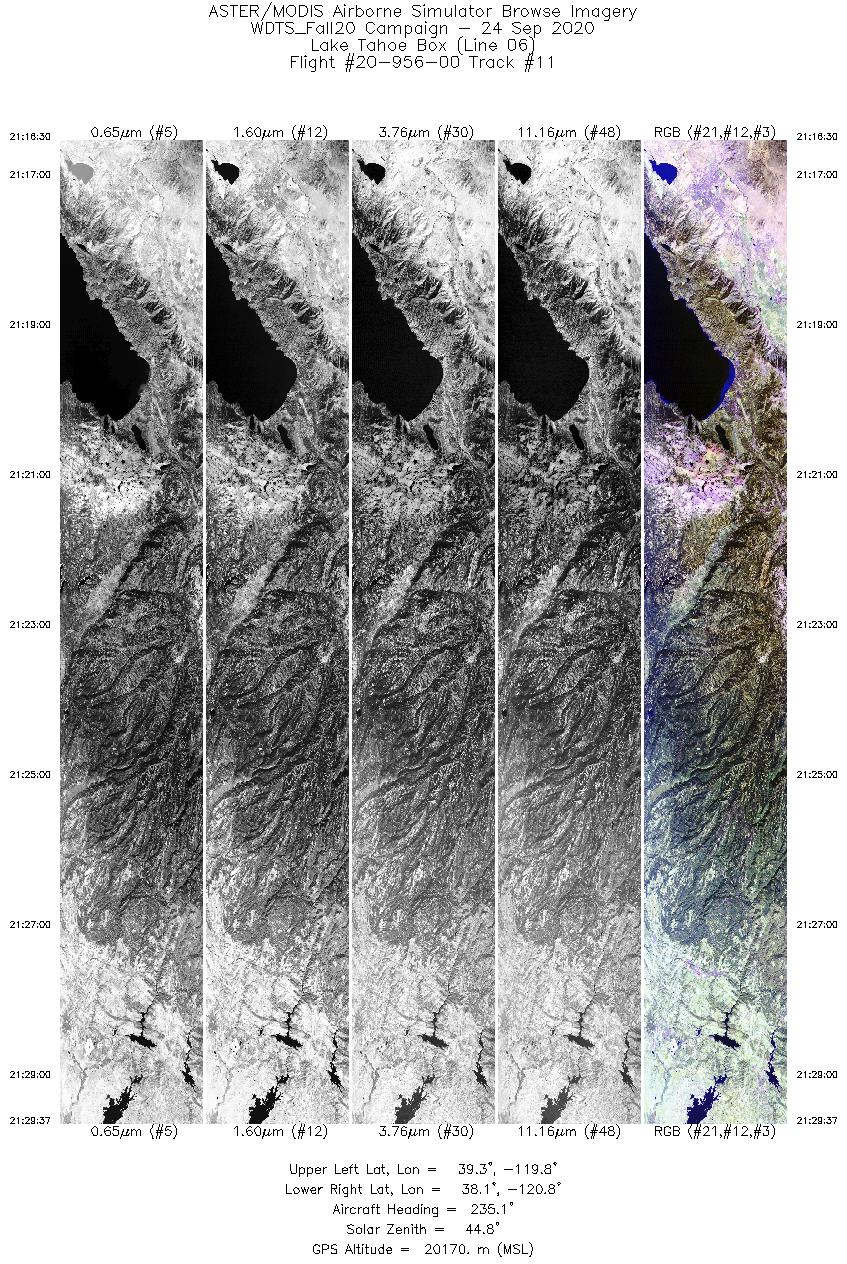
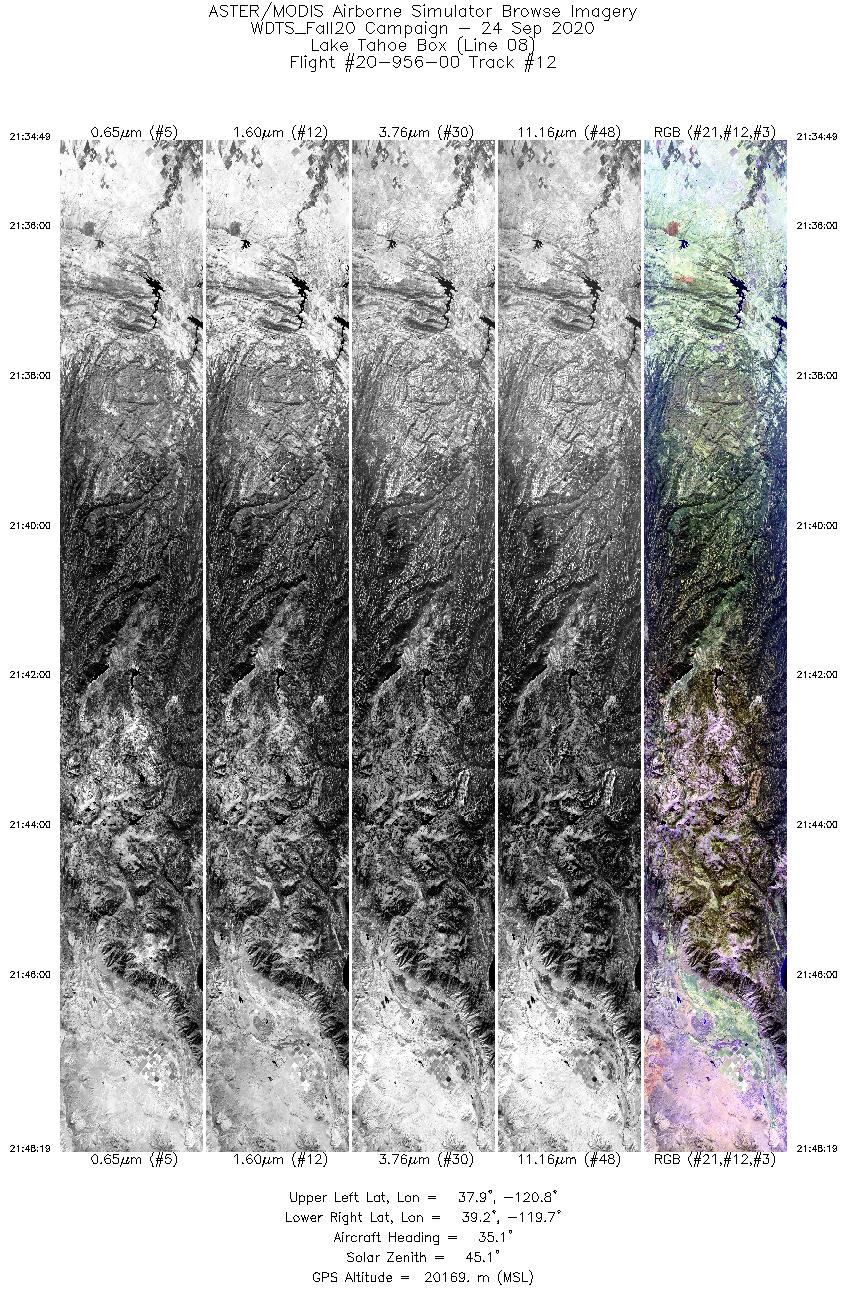
Flight: 20-956-00 Date: 24 Sep 2020 Aircraft: NASA ER-2, #809 Deployment: WDTS Fall 2020 Flight Location: Lake Tahoe / Soda Straw / Creek Fire, CA Principal Investigators: Hook / Green (JPL) Additional Sensors: PICARD / AVIRIS |
||||||||||||||||||||||||||||||||||||||||||||||||||||||||||||||||||||||||||||||||||||||||||||||||||||||||||||||||||||||||||||||
|
Data Evaluation Overall quality is good LN2 loss affected TIR bands during last flight line |
||||||||||||||||||||||||||||||||||||||||||||||||||||||||||||||||||||||||||||||||||||||||||||||||||||||||||||||||||||||||||||||
|
Processing Information Level-1B Data in HDF format is available Flight Line Summary Spectral Band Configuration Spectral Response Function Table Spectral Response Function (text) |
||||||||||||||||||||||||||||||||||||||||||||||||||||||||||||||||||||||||||||||||||||||||||||||||||||||||||||||||||||||||||||||
|
Browse Imagery Flight Tracks: 14 Scanlines: 76662 |
||||||||||||||||||||||||||||||||||||||||||||||||||||||||||||||||||||||||||||||||||||||||||||||||||||||||||||||||||||||||||||||
|
||||||||||||||||||||||||||||||||||||||||||||||||||||||||||||||||||||||||||||||||||||||||||||||||||||||||||||||||||||||||||||||

Flight 20-956-00


| Sample Imagery |
| Click image for full resolution |
|
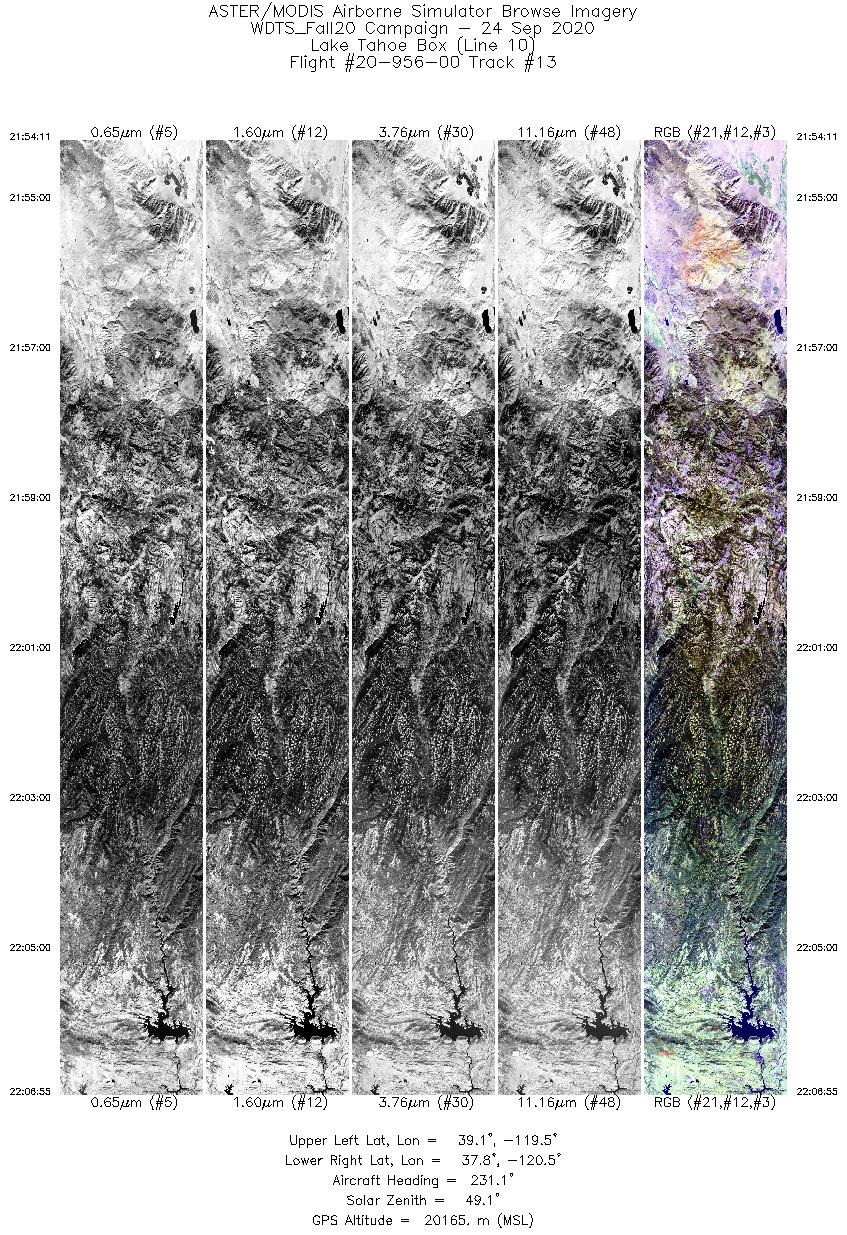
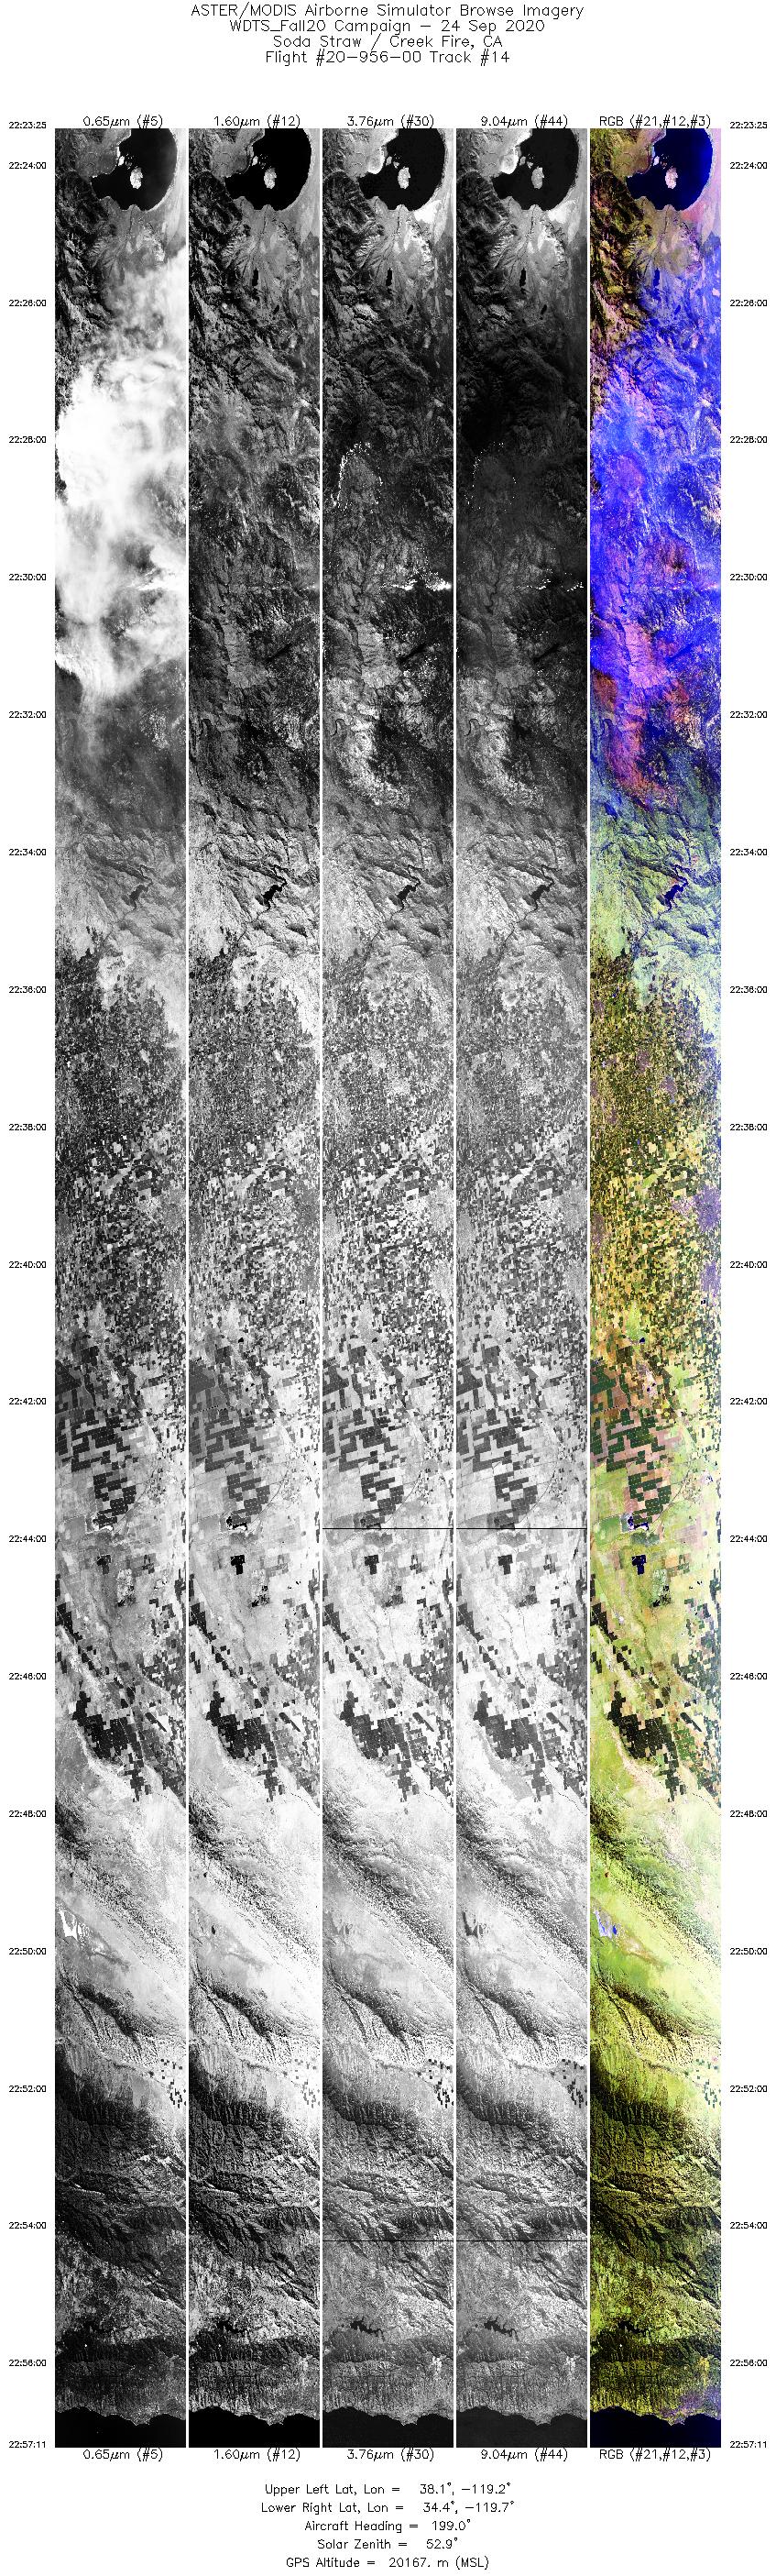
Track #14 Creek Fire, CA |


|
|
R: 2.1µm G: 1.6µm B: 0.5µm |


