


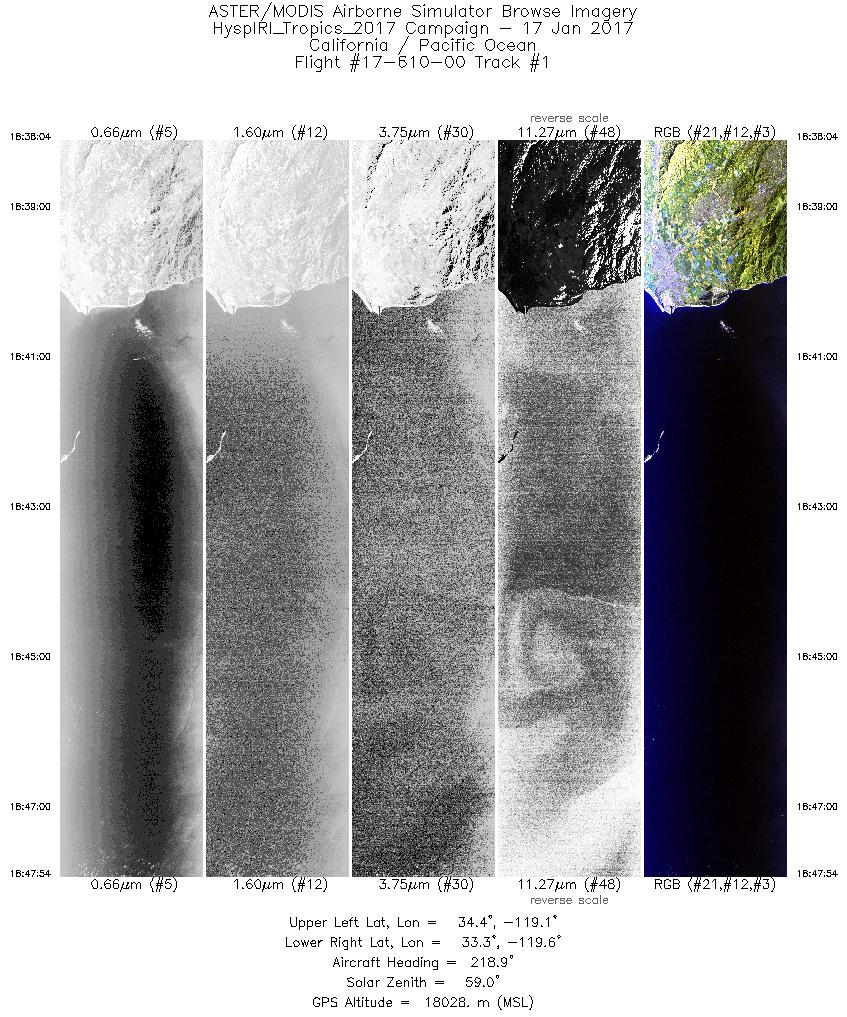
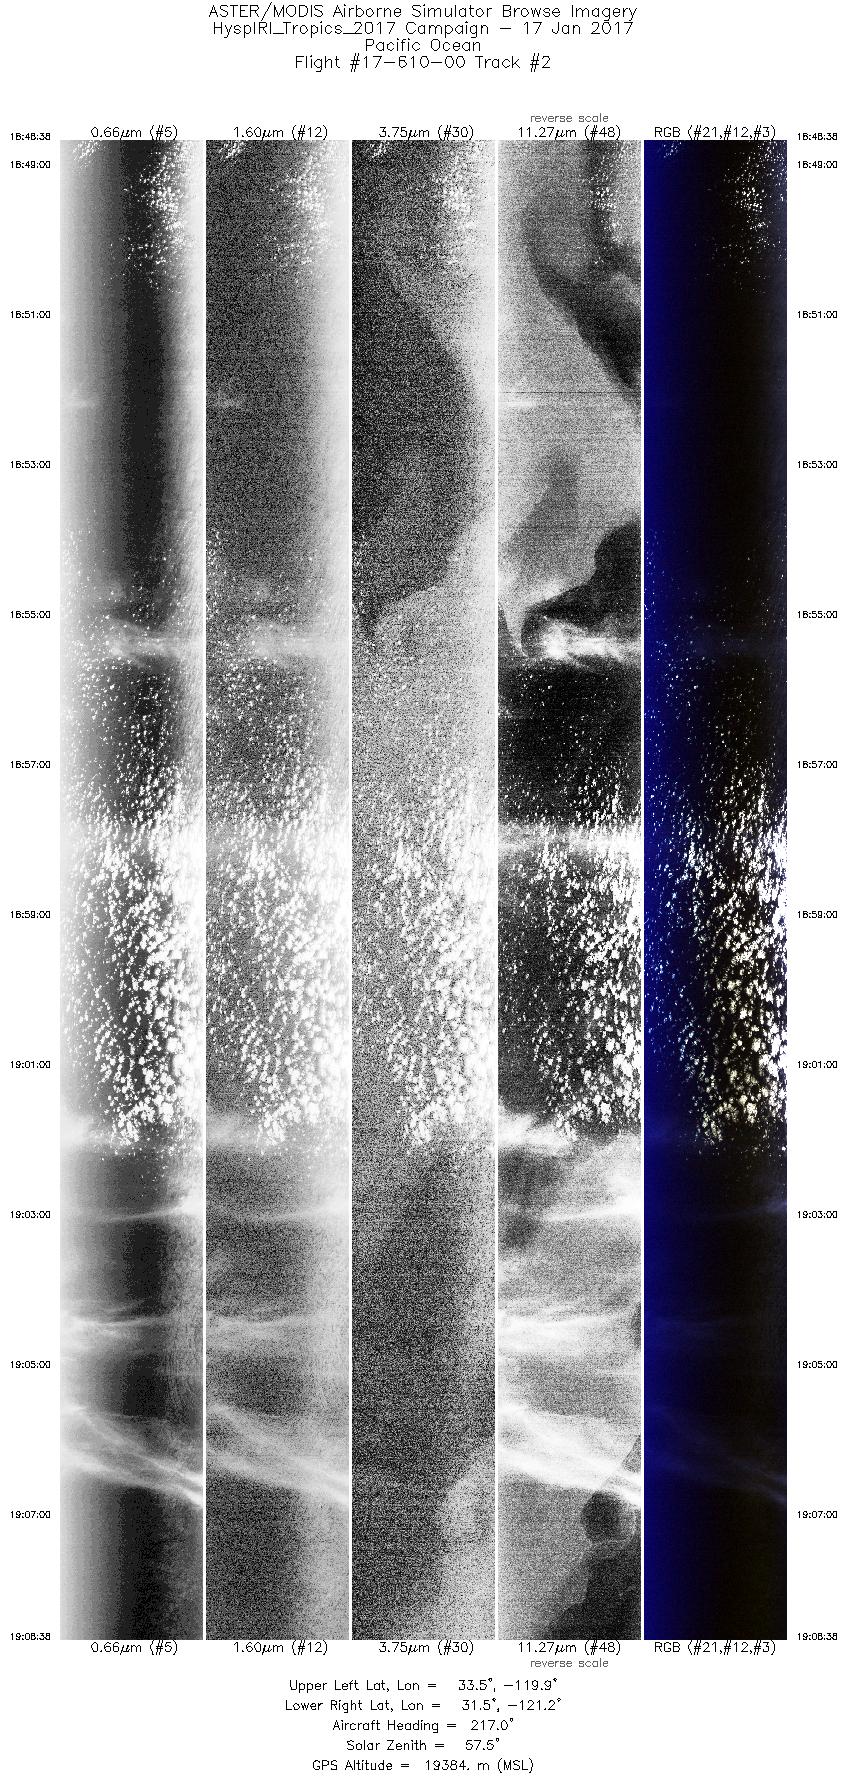
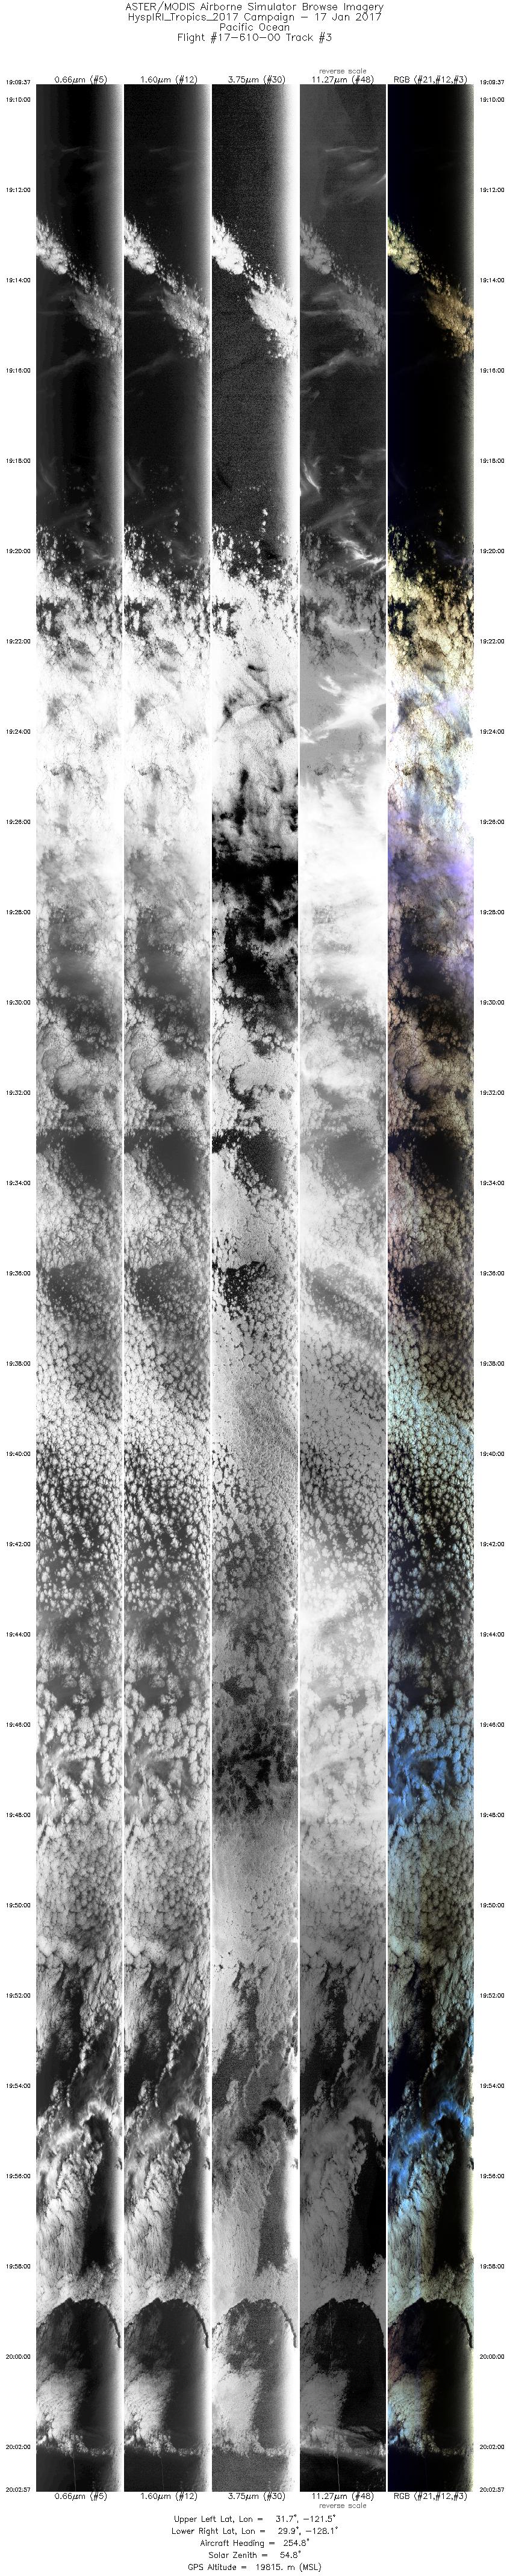
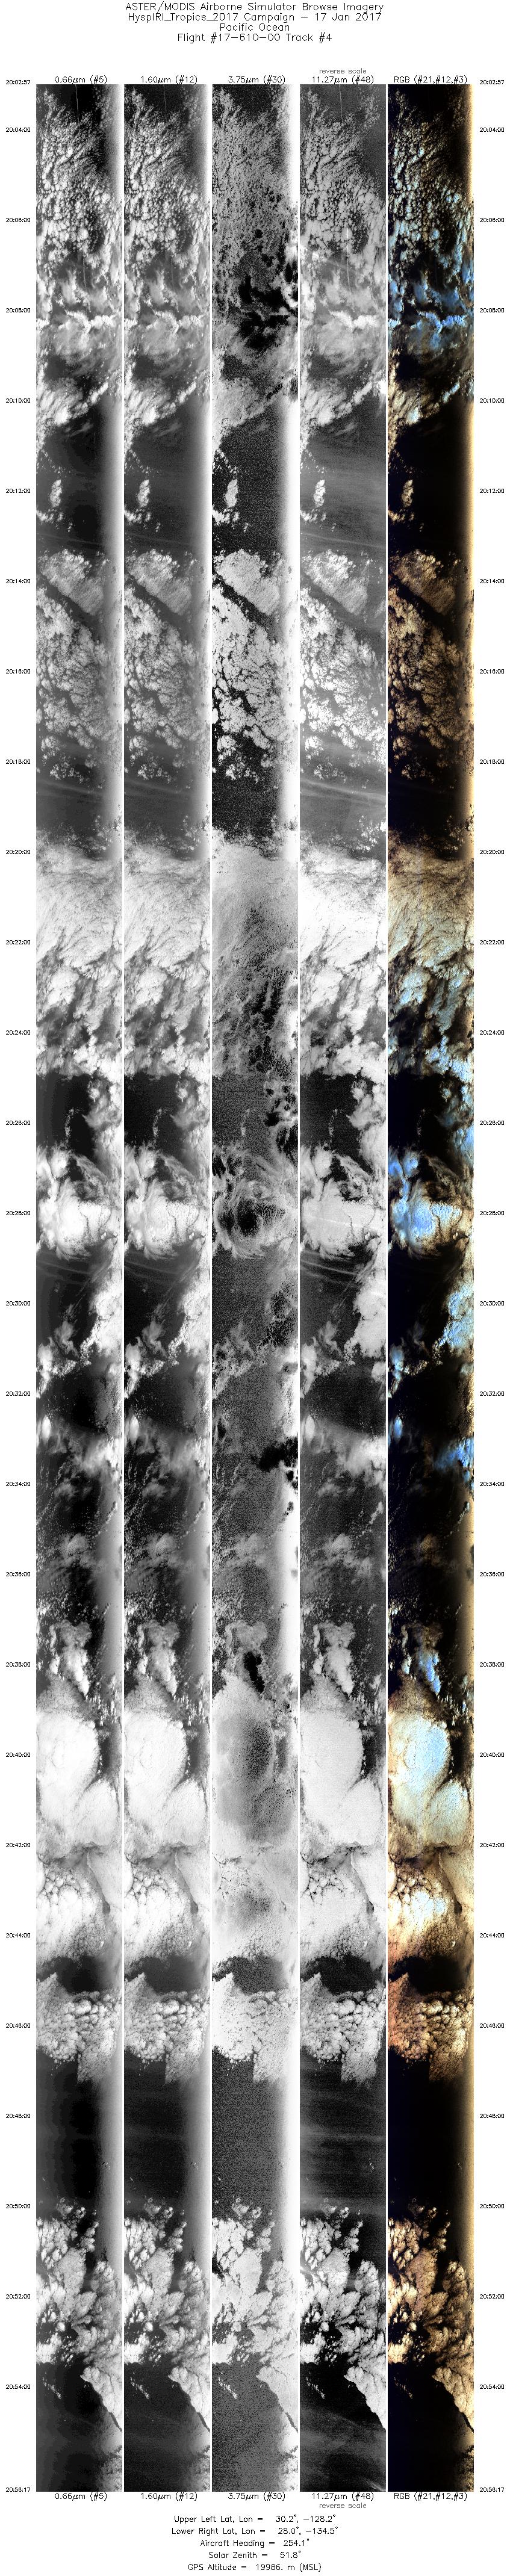
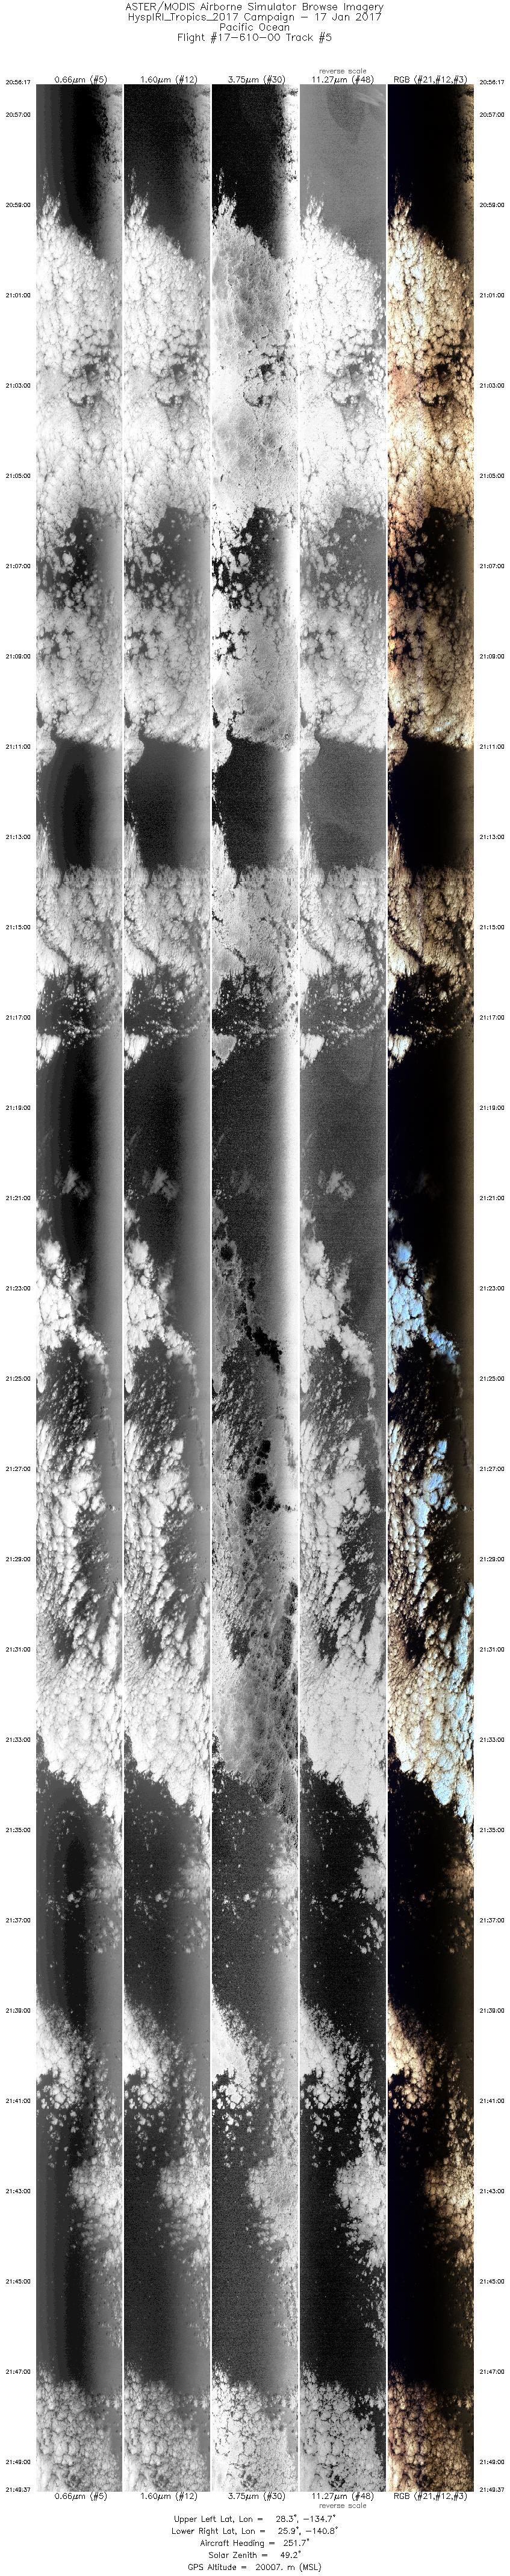
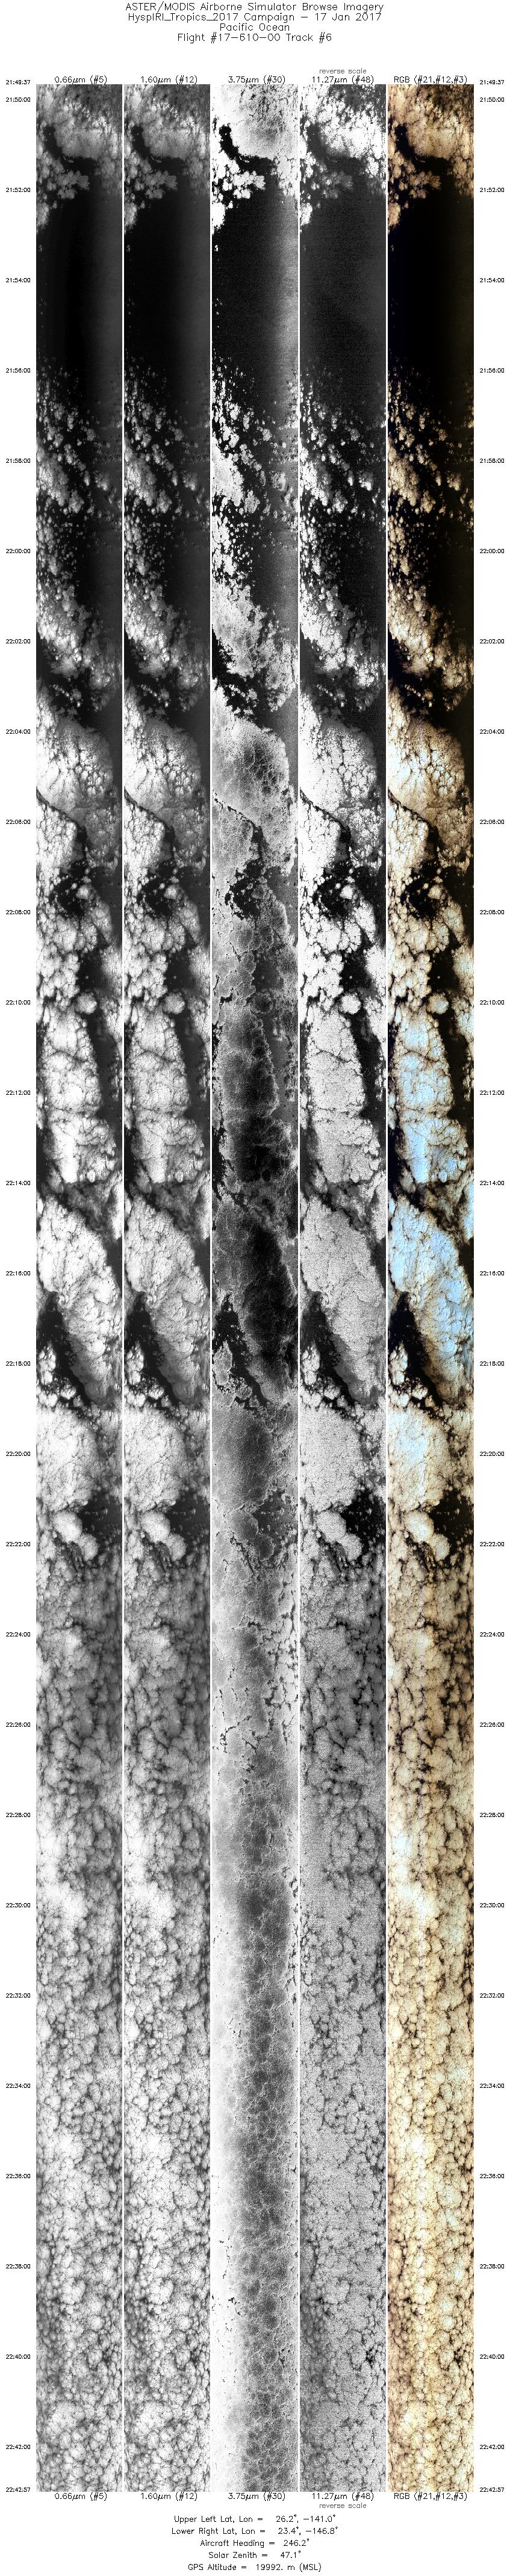
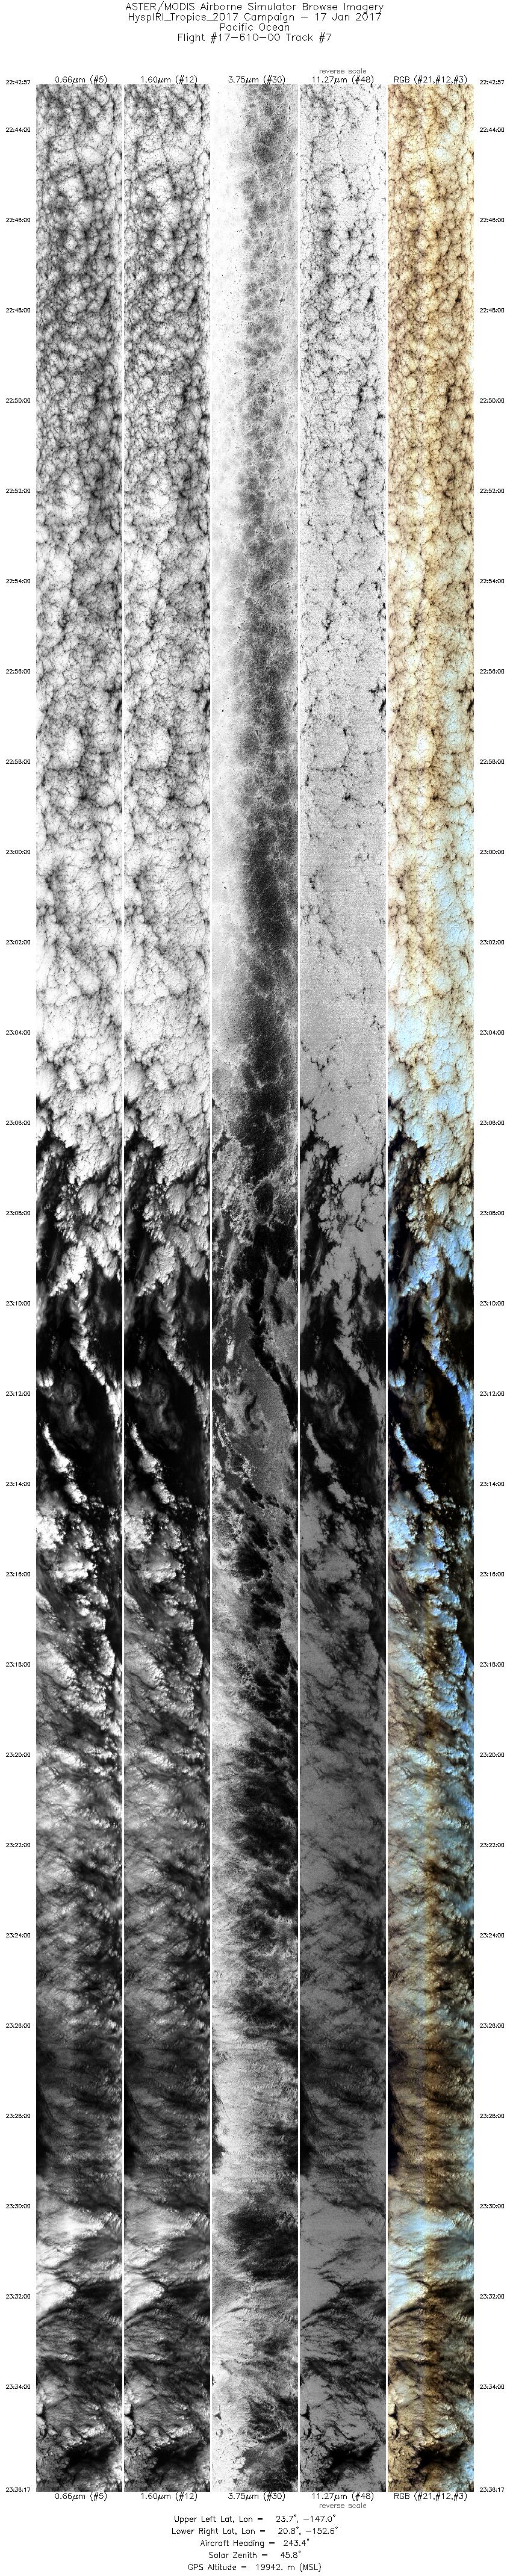
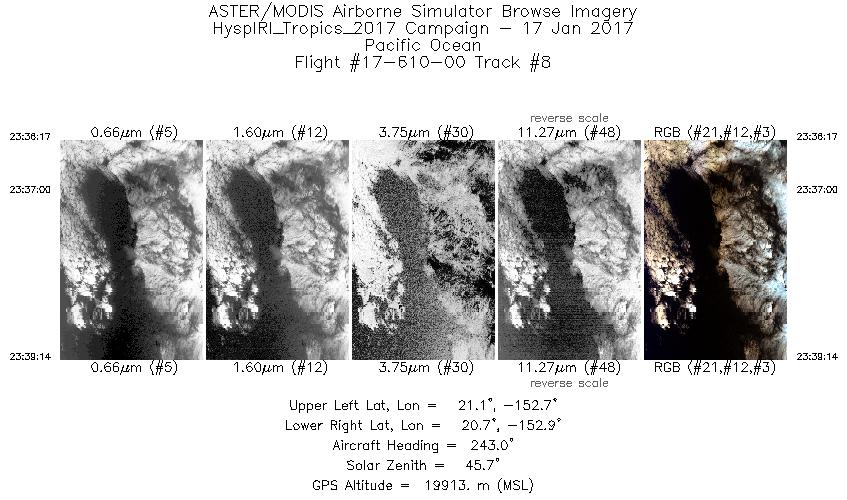
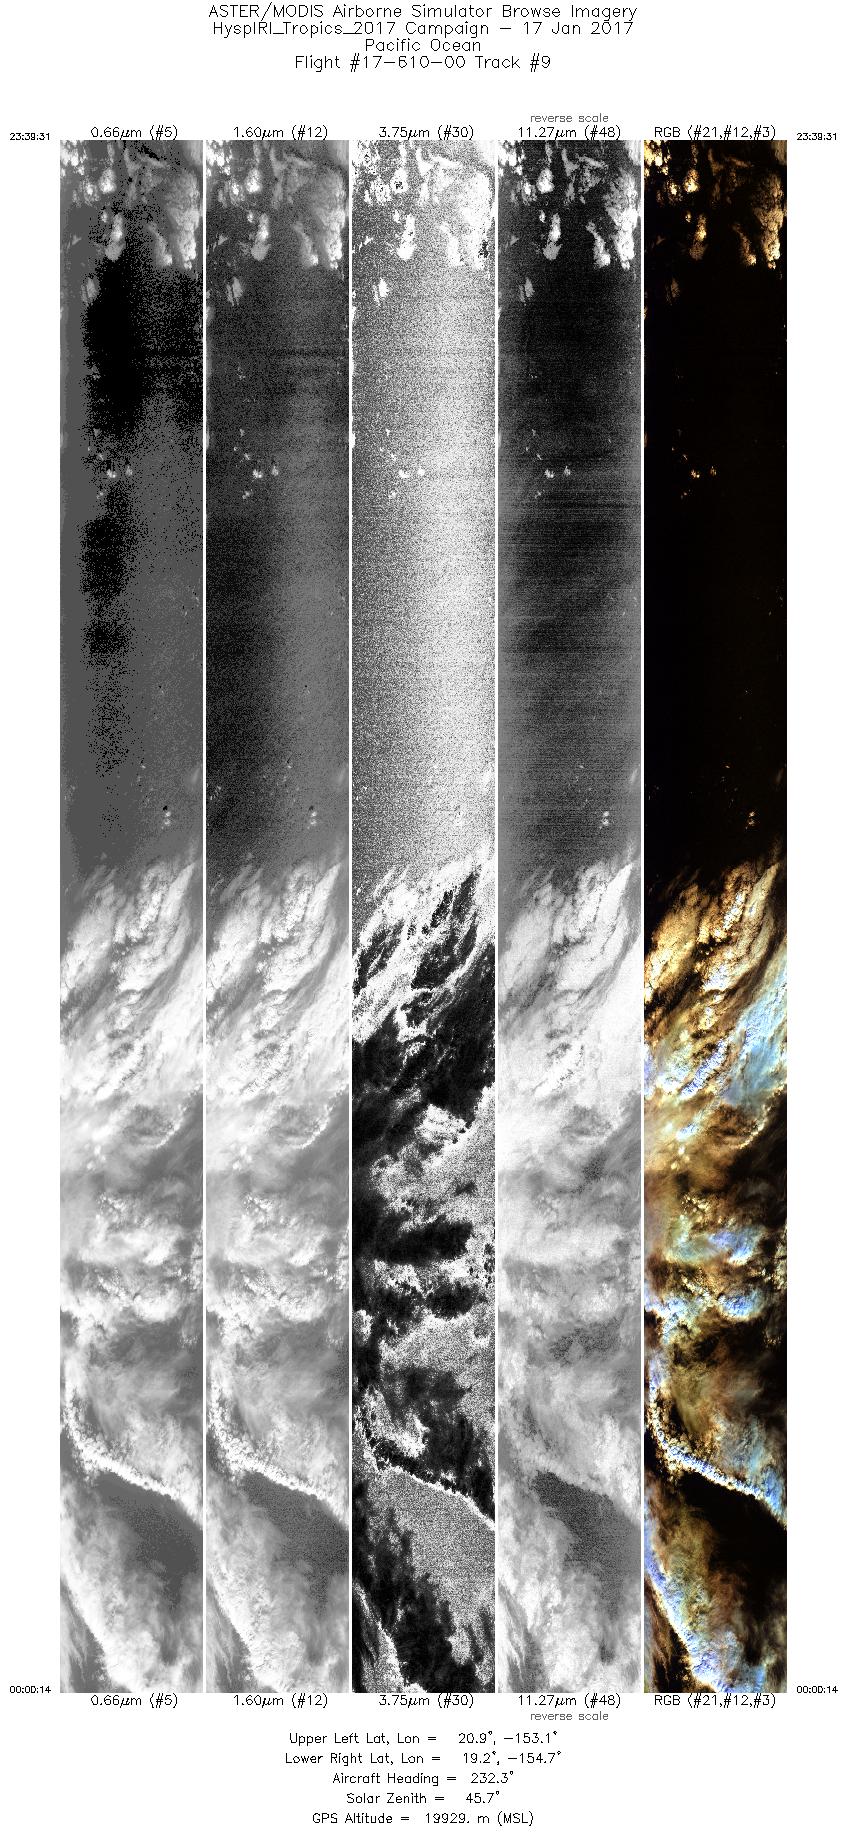
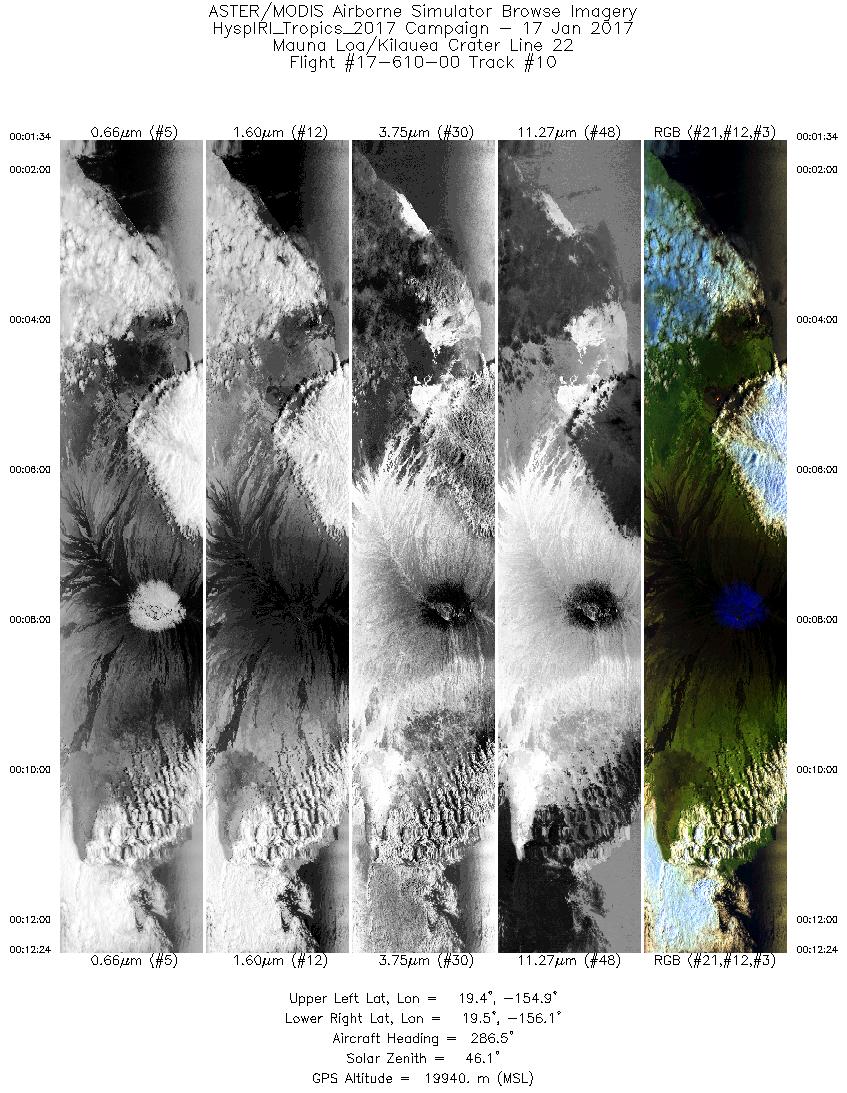
FLIGHT SUMMARY INFORMATION
Flight Track Map


|
Flight: 17-610-00 Date: January 17, 2017 Aircraft: NASA ER-2, #806 Deployment: HyspIRI Hawaii Flight Location: Ferry California to Hawaii Principal Investigator: Hook / Green (JPL) Additional Sensors: AVIRIS / HyTES |
||||||||||||||||||||||||||||||||||||||||||||||||||||||||||||||||||||||||||||||||||||||||||||||||||
|
Data Evaluation New Optics and Blackbody Controller TIR Bands in low-gain mode Overall data quality is good; saturated lava pixels. |
||||||||||||||||||||||||||||||||||||||||||||||||||||||||||||||||||||||||||||||||||||||||||||||||||
|
Processing Information Level-1B Data in HDF format is available Flight Line Summary Spectral Band Configuration Spectral Response Function Table Spectral Response Function (text) |
||||||||||||||||||||||||||||||||||||||||||||||||||||||||||||||||||||||||||||||||||||||||||||||||||
|
Browse Imagery Flight Tracks: 10 Scanlines: 124123 |
||||||||||||||||||||||||||||||||||||||||||||||||||||||||||||||||||||||||||||||||||||||||||||||||||
|
||||||||||||||||||||||||||||||||||||||||||||||||||||||||||||||||||||||||||||||||||||||||||||||||||


