


MODIS Airborne Simulator (MAS)
FLIGHT SUMMARY INFORMATION
Flight Track Map


|
Flight: 99-075 Date: 23 May 1999 Location: Louisiana / Gulf of Mexico Deployment: Patrick May 1999 Principal Investigator: Miller (NASA Stennis) Additional Sensors: AVIRIS, RC-10 (12" CIR) |
|||||||||||||||||||||||||||||||||||||||||||||||||||||||||||||||||||||||||||||||||||||||||||||||||||||||||||||||||||||||||||||||||||||
|
Data Evaluation MAS performed extremely well during the Patrick 1999 deployment. No problems were noted in the data from this flight. |
|||||||||||||||||||||||||||||||||||||||||||||||||||||||||||||||||||||||||||||||||||||||||||||||||||||||||||||||||||||||||||||||||||||
|
Processing Information Level-1B Data in HDF format is available Flight Line Summary Spectral Band Configuration Spectral Response Function Table |
|||||||||||||||||||||||||||||||||||||||||||||||||||||||||||||||||||||||||||||||||||||||||||||||||||||||||||||||||||||||||||||||||||||
|
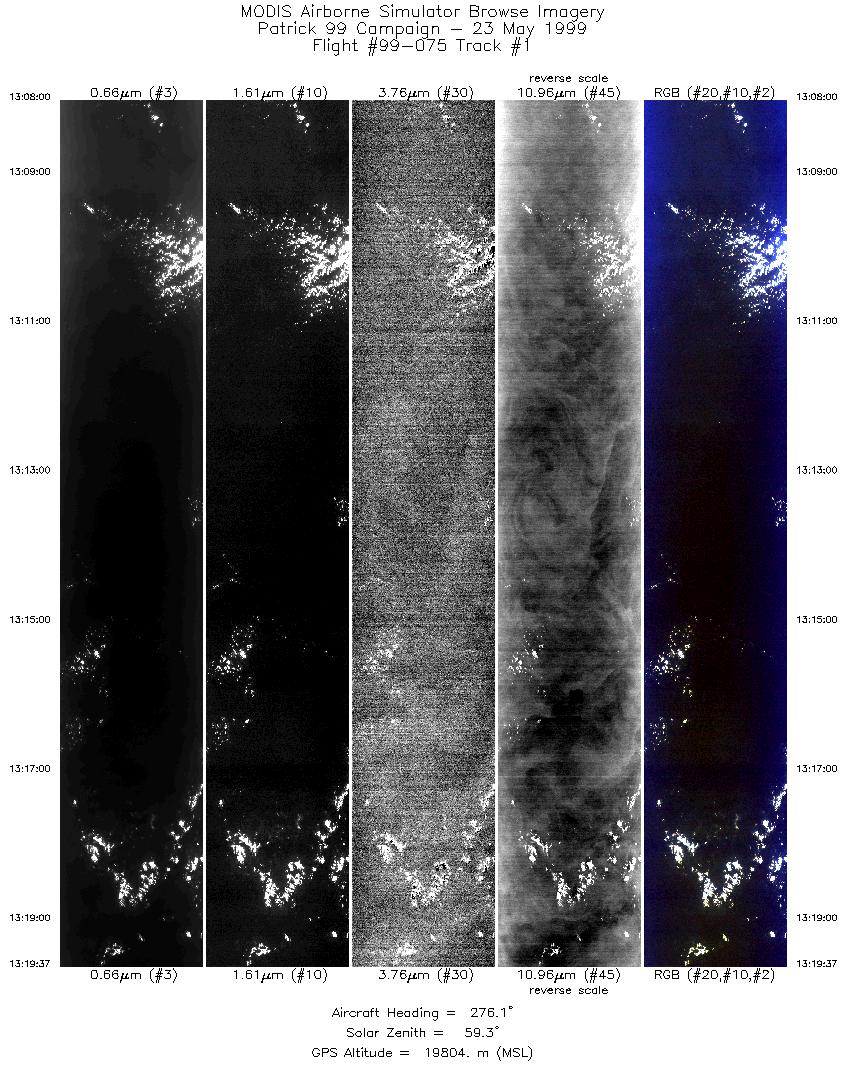
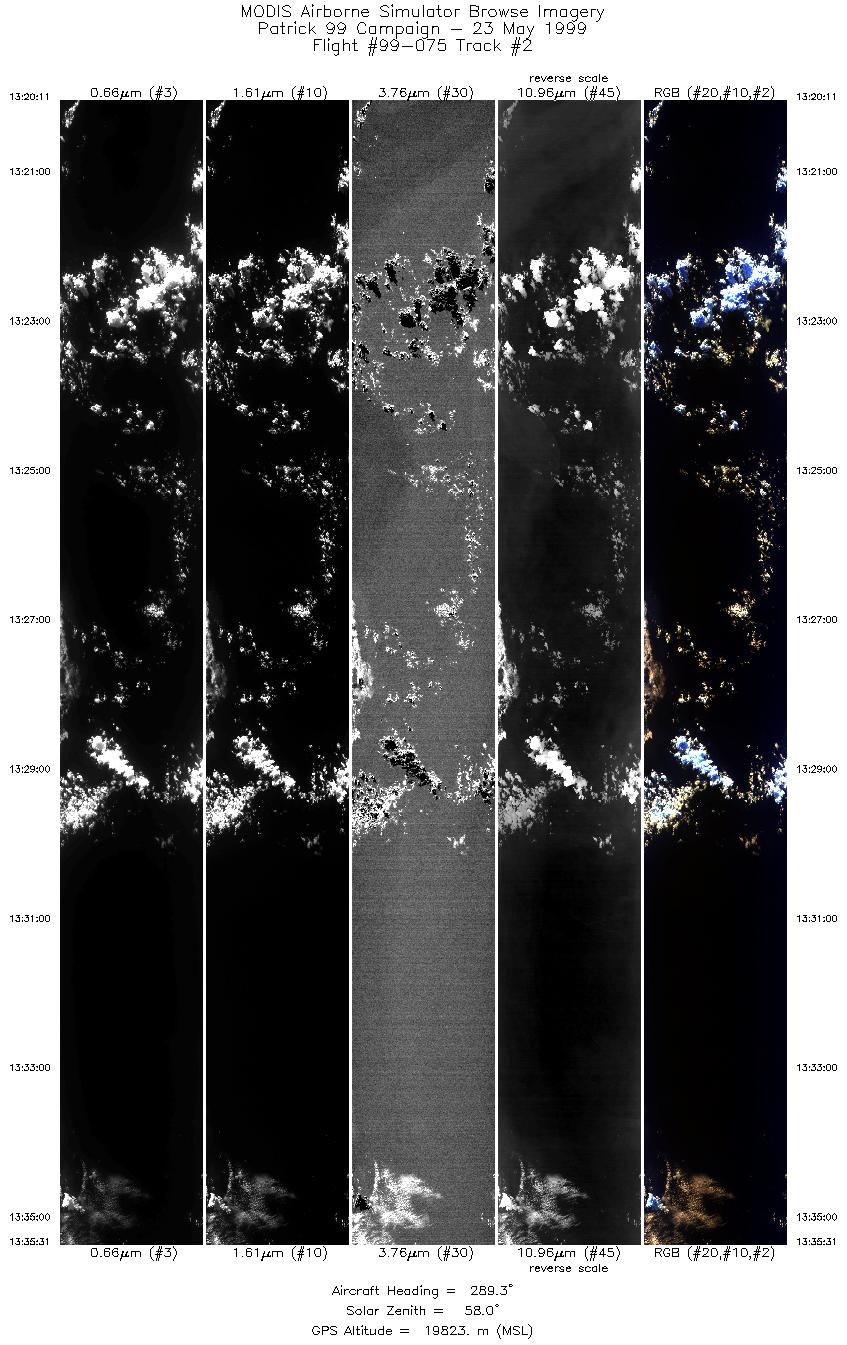
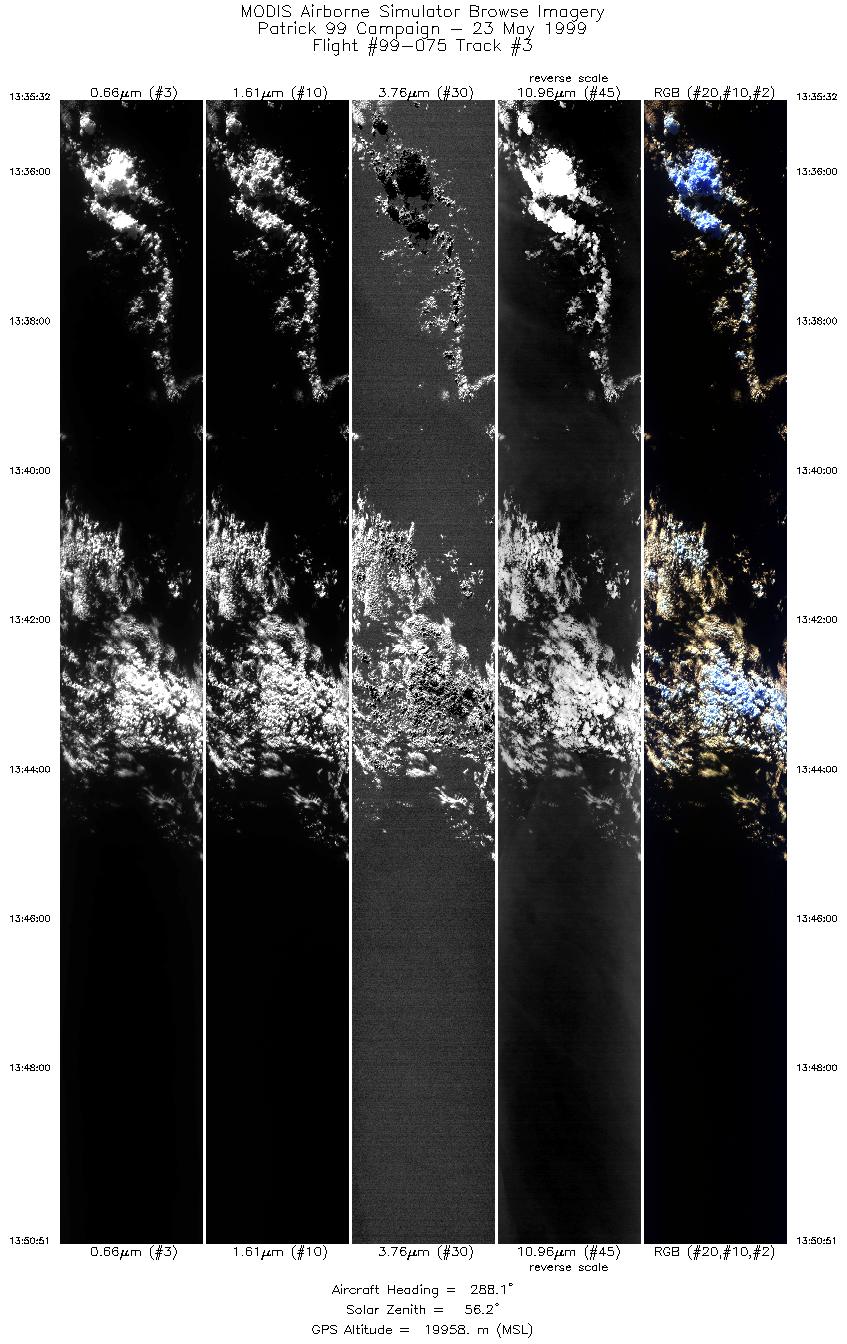
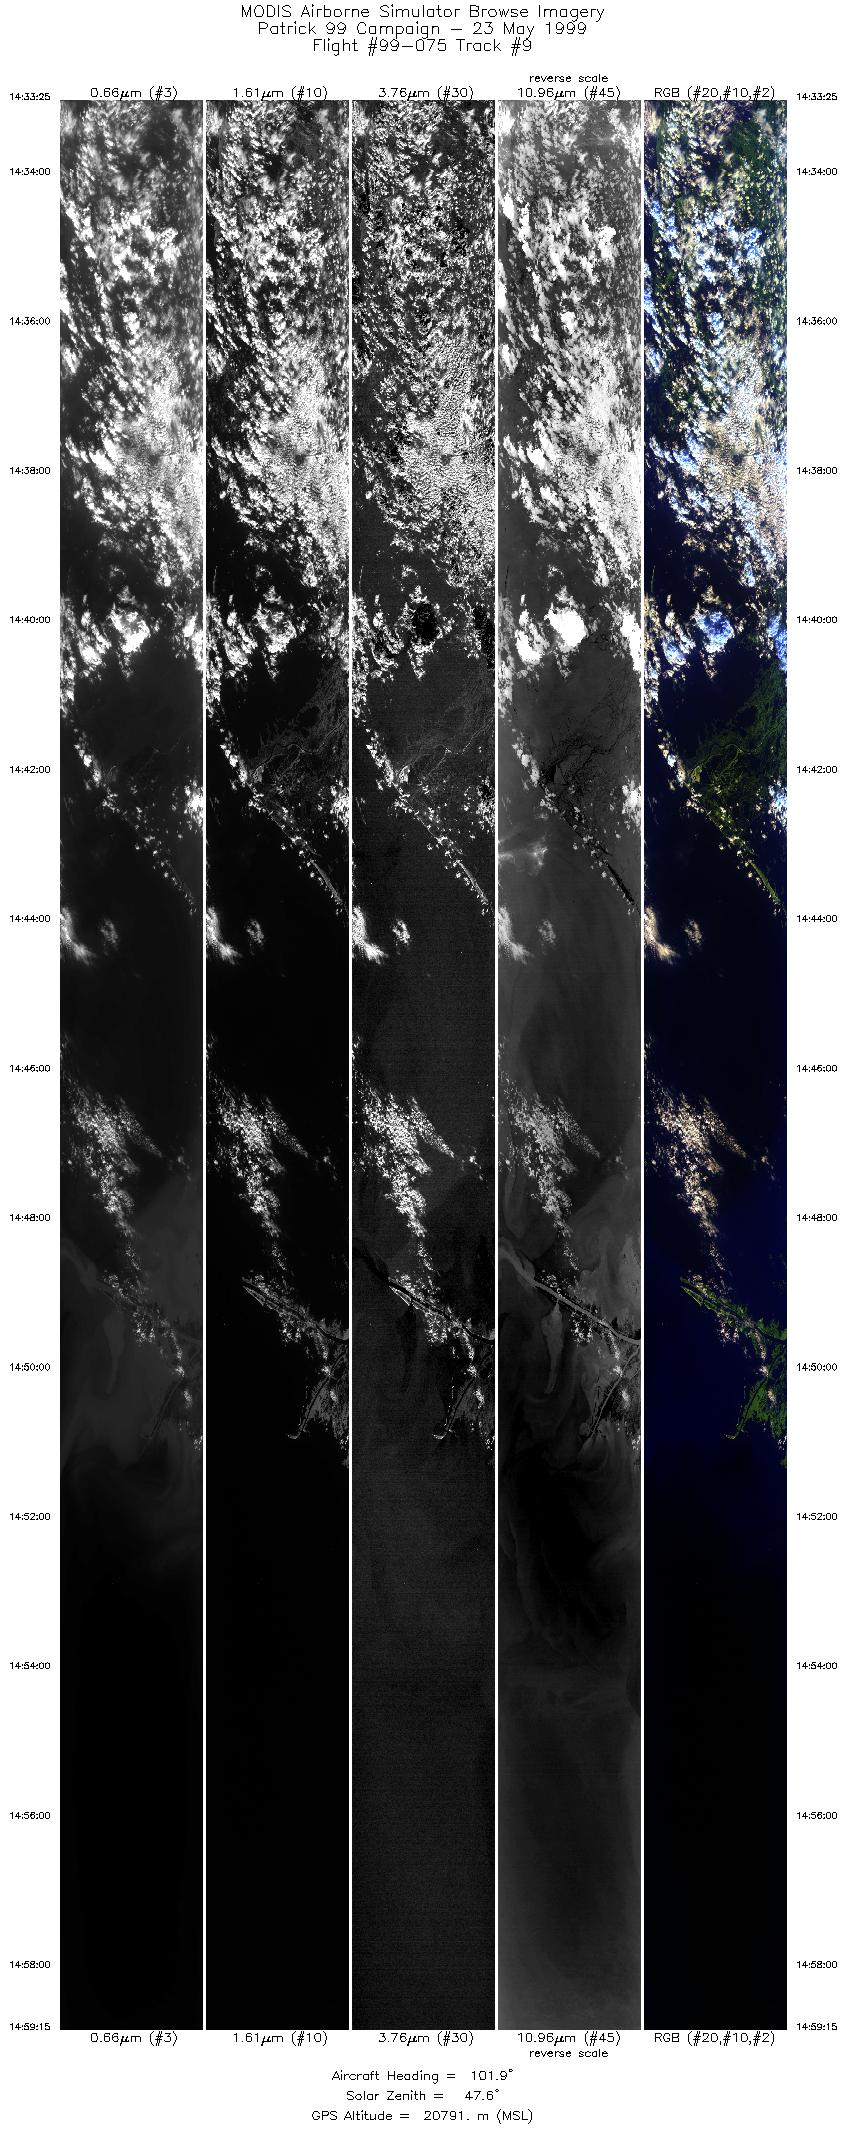
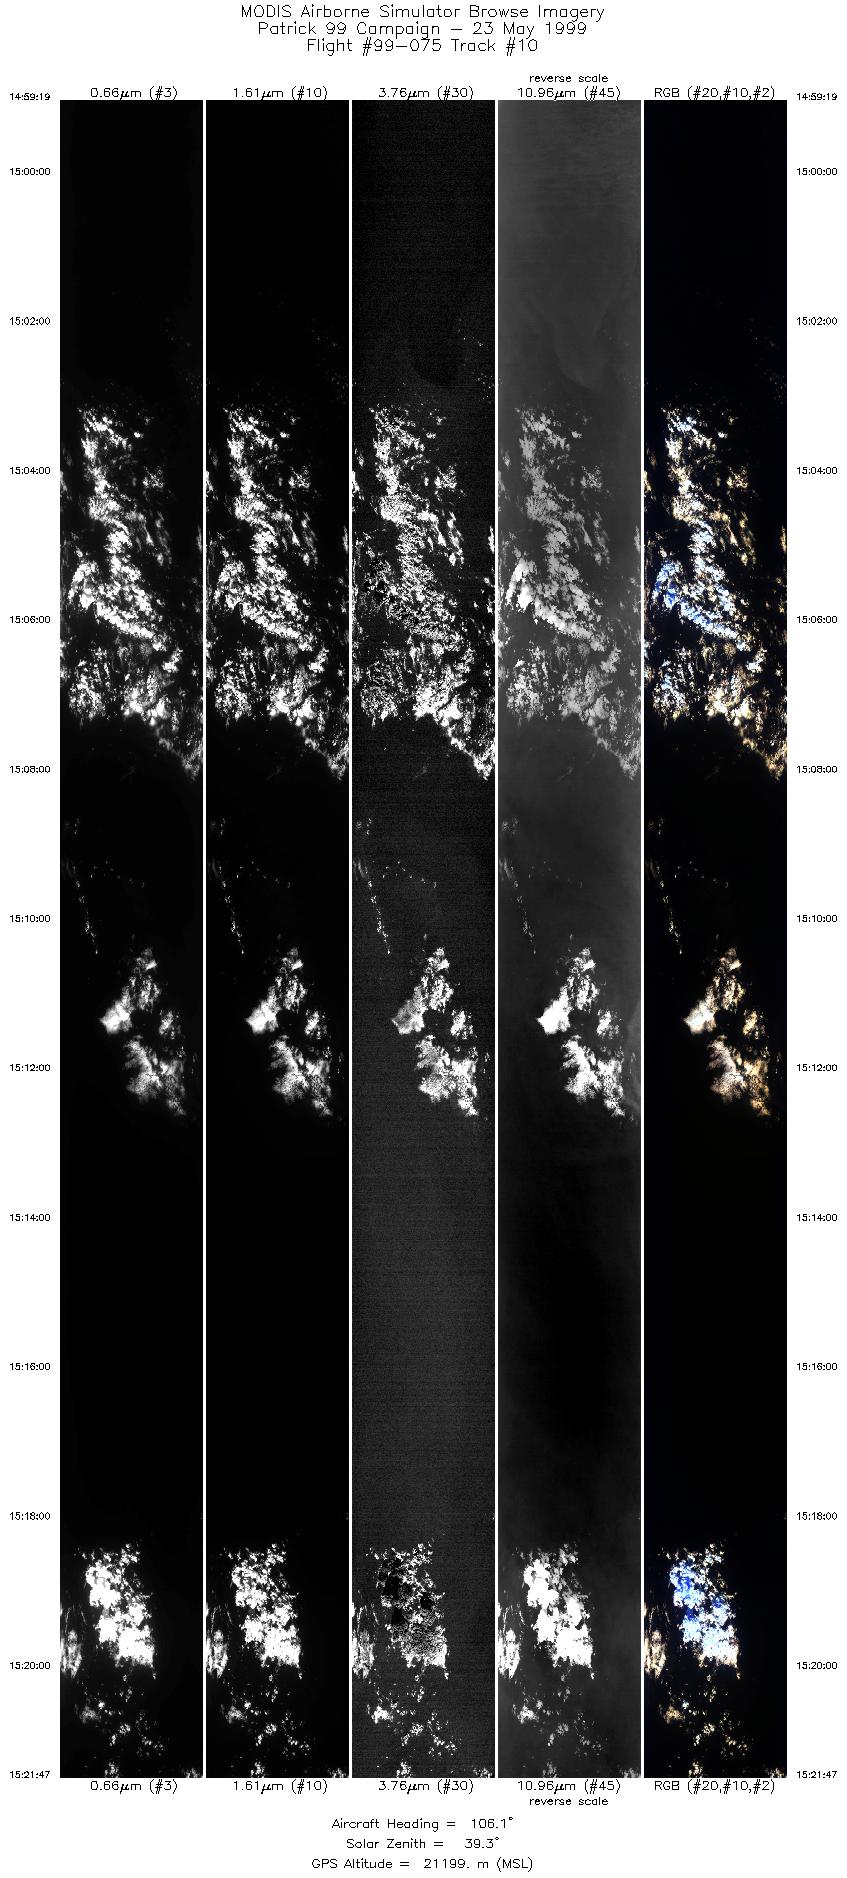
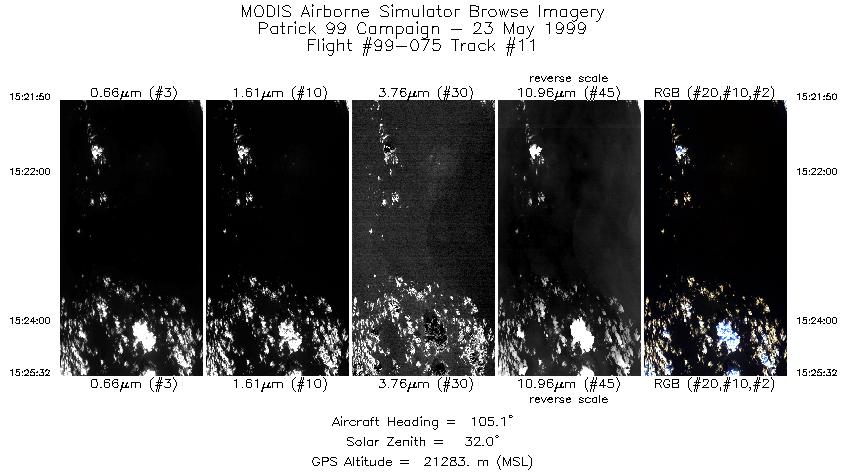
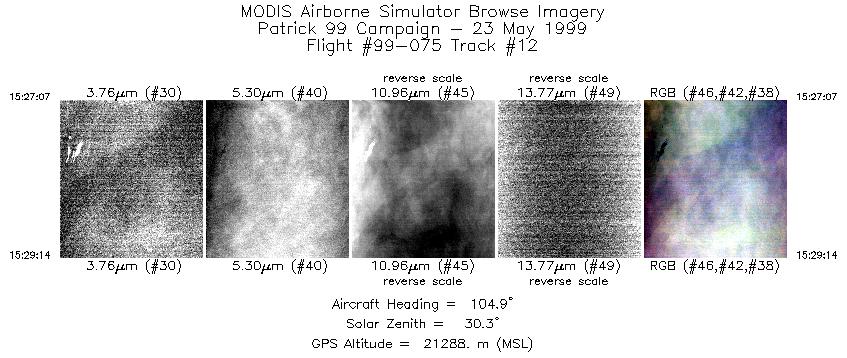
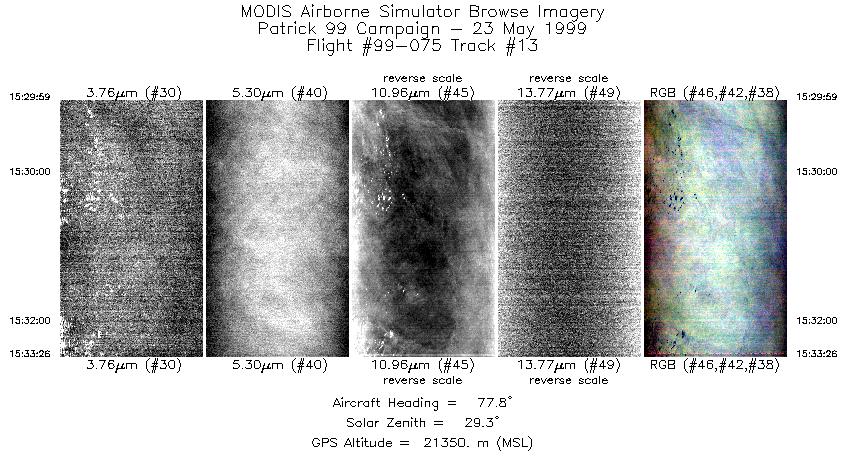
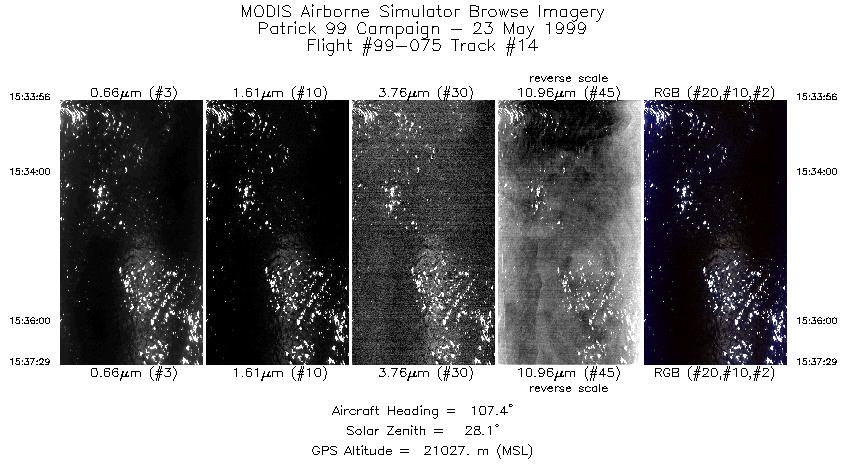
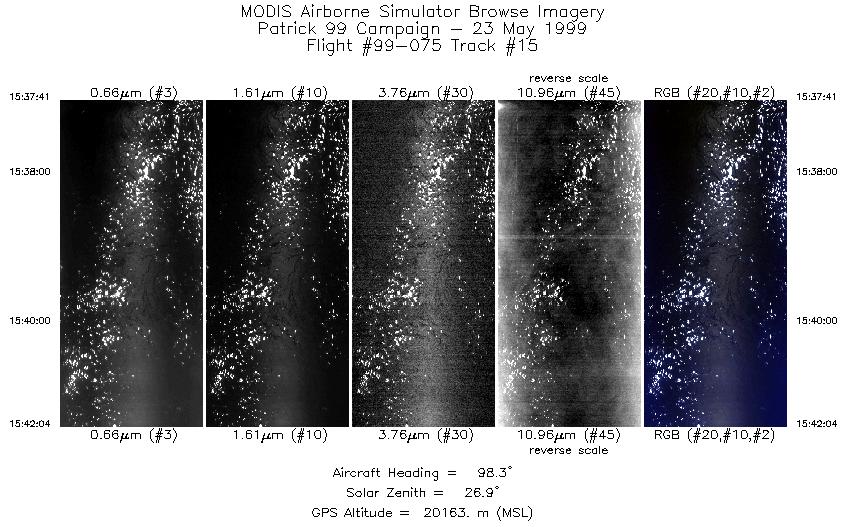
Browse Imagery Flight Tracks: 15 Scanlines: 52006 |
|||||||||||||||||||||||||||||||||||||||||||||||||||||||||||||||||||||||||||||||||||||||||||||||||||||||||||||||||||||||||||||||||||||
|
|||||||||||||||||||||||||||||||||||||||||||||||||||||||||||||||||||||||||||||||||||||||||||||||||||||||||||||||||||||||||||||||||||||

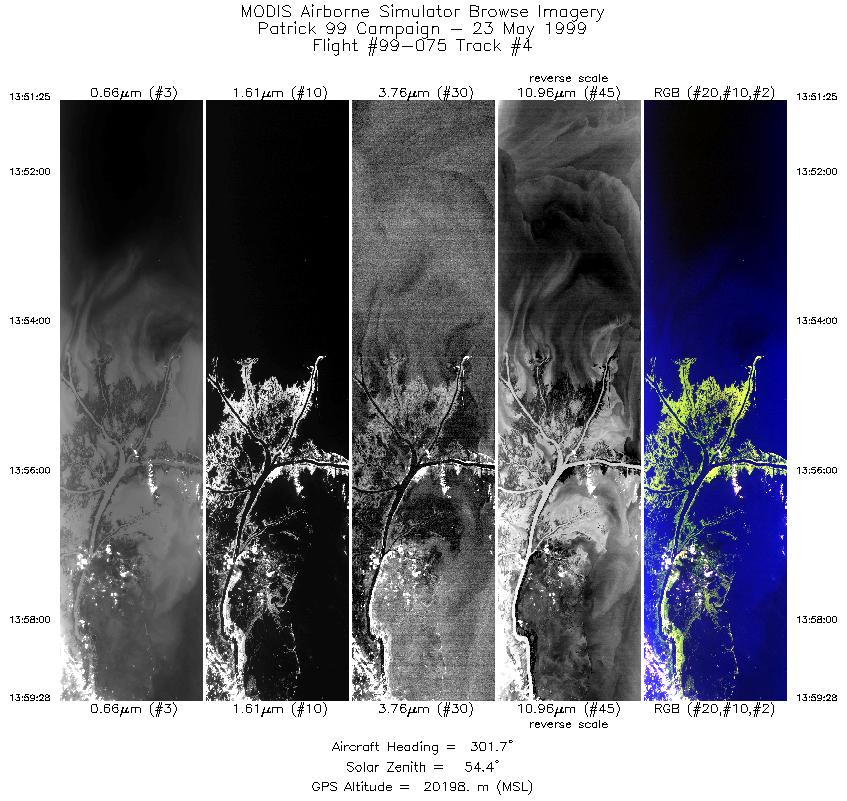
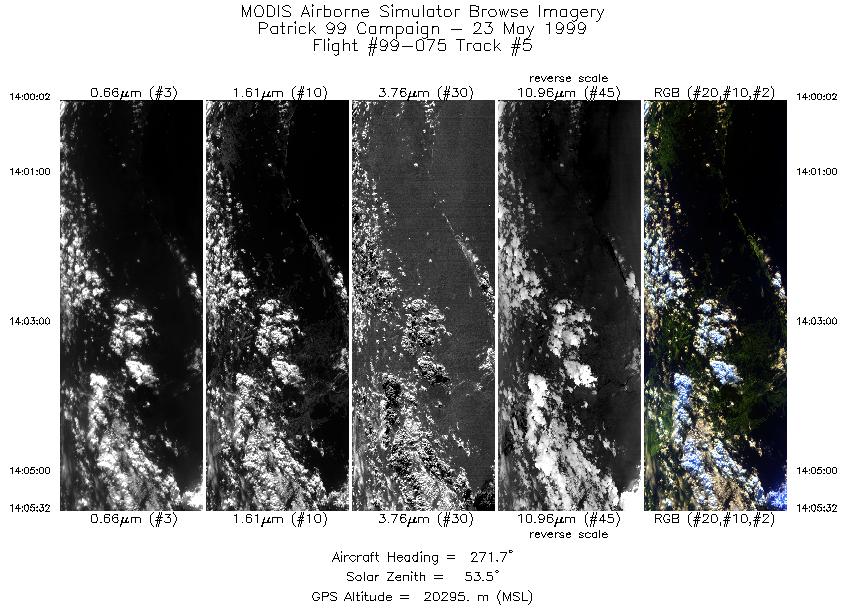
Flight 99-075


| Sample Imagery |
| Click image for full resolution |
|
Track #4 Mississippi River Delta (Louisiana) |


|
|
R: 2.13µm G: 1.62µm B: 0.55µm |
- NASA Official: Matt Fladeland
- Project Manager: James Jacobson
- Website Editor: Eric Fraim
- Last Updated: November 16, 2021


