


MODIS Airborne Simulator (MAS)
FLIGHT SUMMARY INFORMATION


|
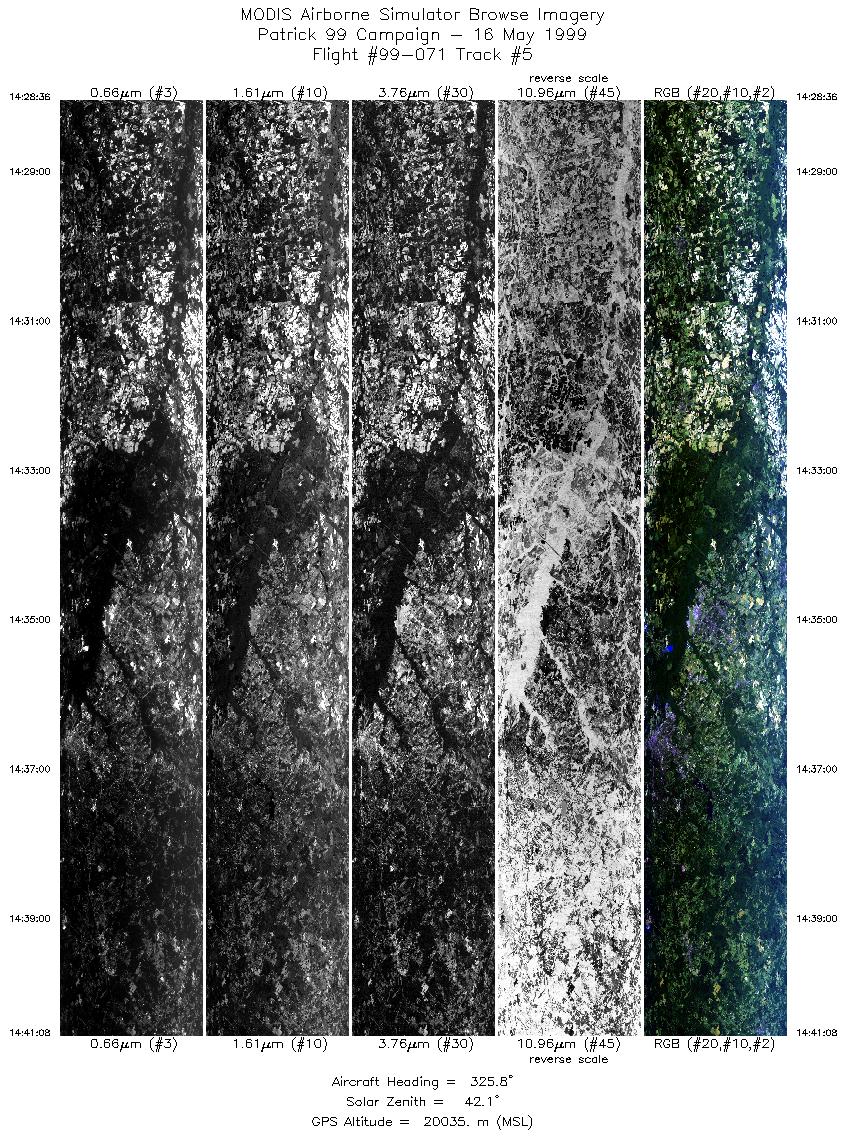
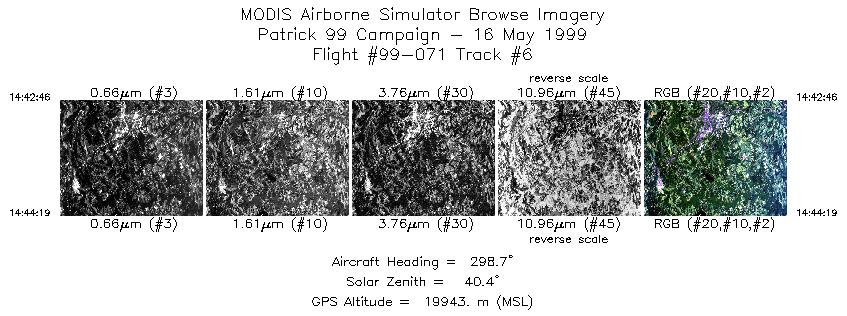
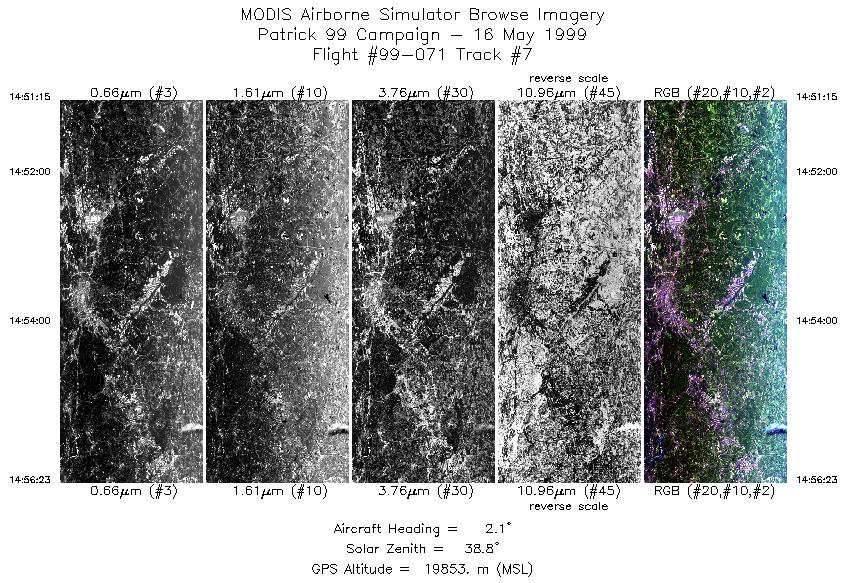
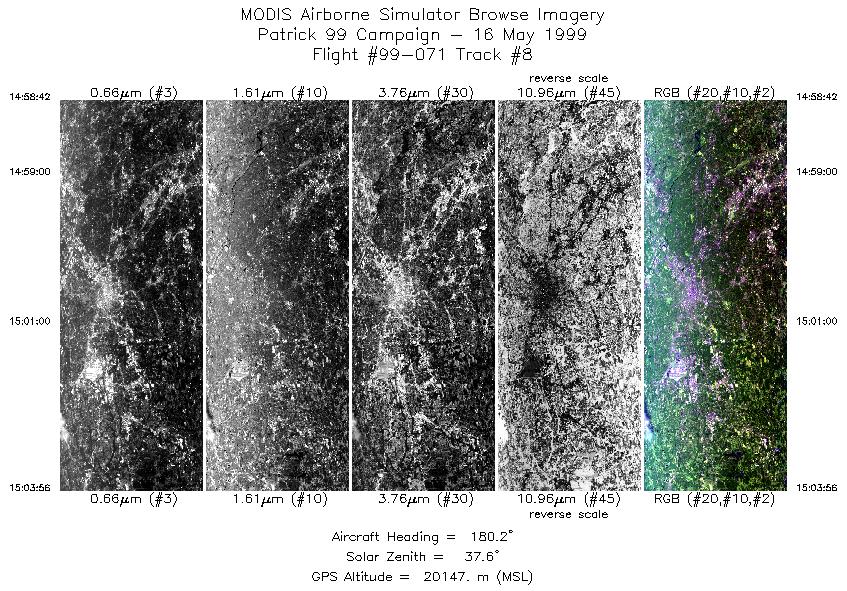
Flight: 99-071 Date: 16 May 1999 Location: Atlanta, GA Deployment: Patrick May 1999 Principal Investigator: Quattrochi (MSFC) Additional Sensors: AVIRIS, RC-10 (12" CIR) |
|||||||||||||||||||||||||||||||||||||||||||||||||||||||||||||||||||||||||||||||||||||||||||||||||||||||||||||||||||||||||||||||||||||||||||||||||||||||||||||||||||||||||||||||||||||||||||||
|
Data Evaluation MAS performed extremely well during the Patrick 1999 deployment. No problems were noted in the data from this flight. |
|||||||||||||||||||||||||||||||||||||||||||||||||||||||||||||||||||||||||||||||||||||||||||||||||||||||||||||||||||||||||||||||||||||||||||||||||||||||||||||||||||||||||||||||||||||||||||||
|
Processing Information Level-1B Data in HDF format is available Flight Line Summary Spectral Band Configuration Spectral Response Function Table |
|||||||||||||||||||||||||||||||||||||||||||||||||||||||||||||||||||||||||||||||||||||||||||||||||||||||||||||||||||||||||||||||||||||||||||||||||||||||||||||||||||||||||||||||||||||||||||||
|
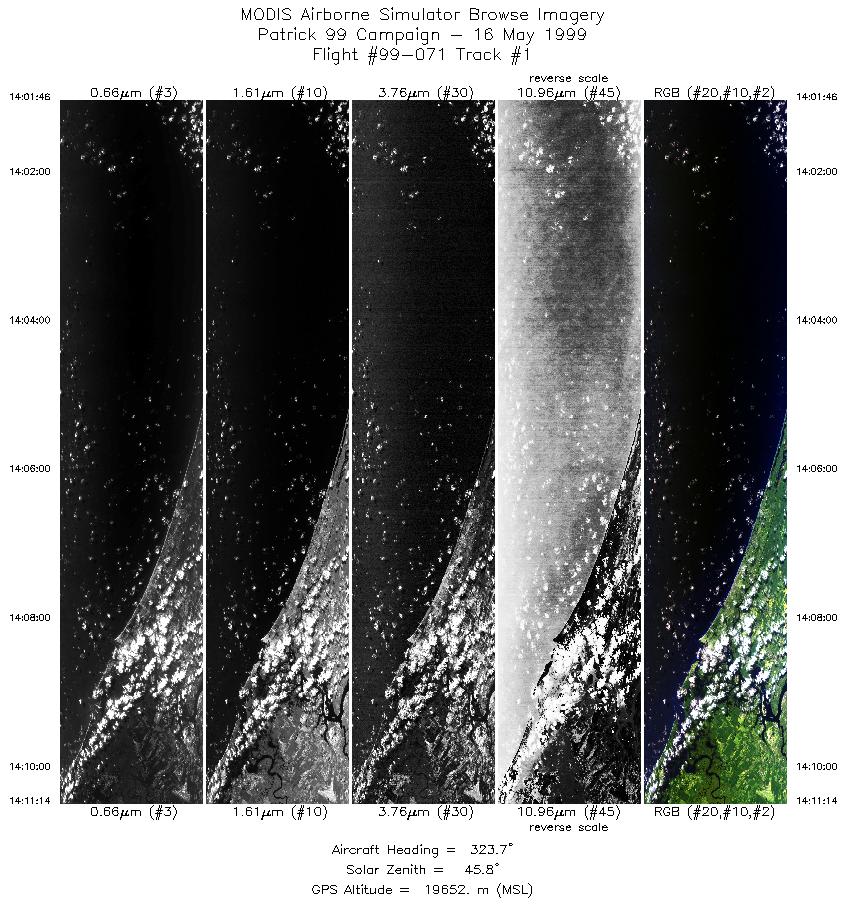
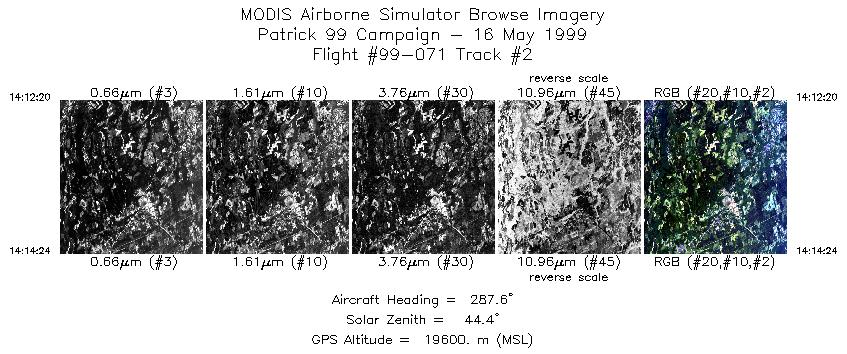
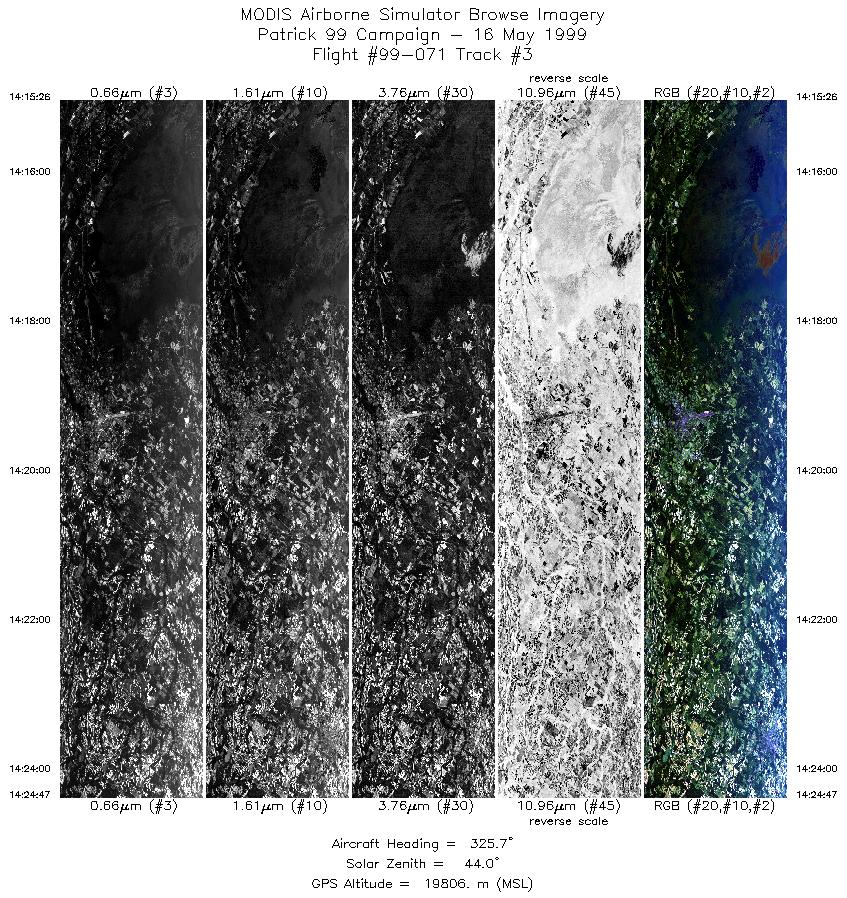
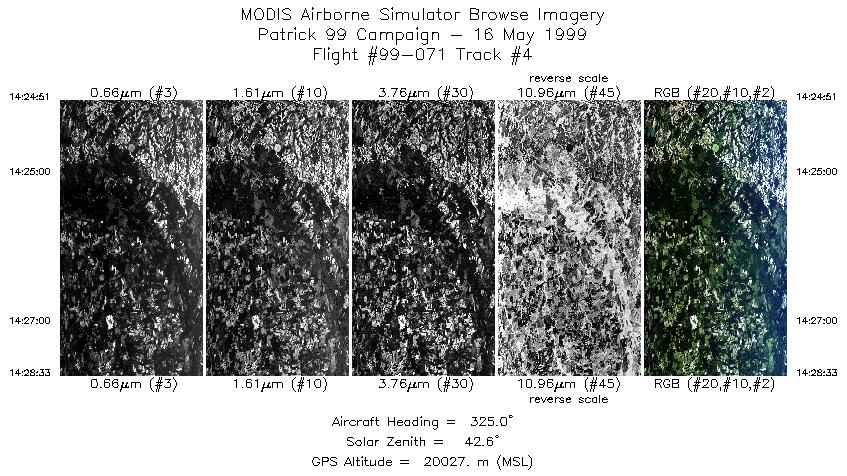
Browse Imagery Flight Tracks: 23 Scanlines: 49836 |
|||||||||||||||||||||||||||||||||||||||||||||||||||||||||||||||||||||||||||||||||||||||||||||||||||||||||||||||||||||||||||||||||||||||||||||||||||||||||||||||||||||||||||||||||||||||||||||
|
|||||||||||||||||||||||||||||||||||||||||||||||||||||||||||||||||||||||||||||||||||||||||||||||||||||||||||||||||||||||||||||||||||||||||||||||||||||||||||||||||||||||||||||||||||||||||||||
|
Objective The purpose of the Project ATLANTA investigation is to assess the impact of the urban landscape and urban landscape change on local and regional meteorology and air quality. A principal focus of this research is to use NASA pre-EOS and EOS remote sensing data to map and model urban landscape characteristics and energy fluxes (e.g., surface thermal energy fluxes and albedo) as they impact local and regional meteorology and air quality. Moreover, this study seeks to use pre-EOS and EOS remote sensing data as baseline information for developing models of sustainability or habitability of the Atlanta, GA metropolitan area. MAS data will be used as a foundation for assessing what the current state is of landscape attributes in the Atlanta metro area at the present and for use in modeling how land uses will change, and ultimately will impact air quality, and evaluate how these changes affect Atlanta as a sustainable and habitable urban environment. Paramount to this is using the MAS sensor to collect multispectral thermal IR data to quantify the metropolitan area's thermal energy fluxes as partitioned across the landscape as a function of heterogeneous land covers. |
|||||||||||||||||||||||||||||||||||||||||||||||||||||||||||||||||||||||||||||||||||||||||||||||||||||||||||||||||||||||||||||||||||||||||||||||||||||||||||||||||||||||||||||||||||||||||||||

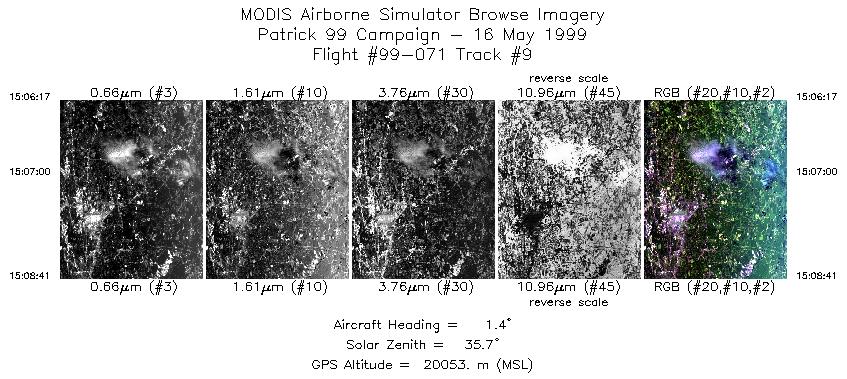
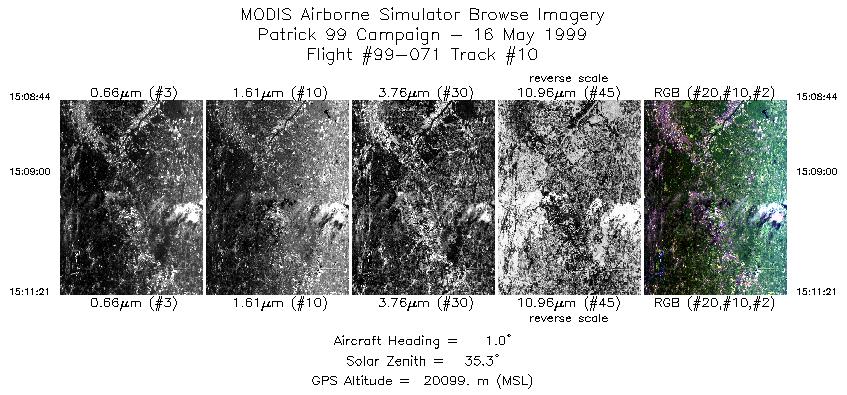
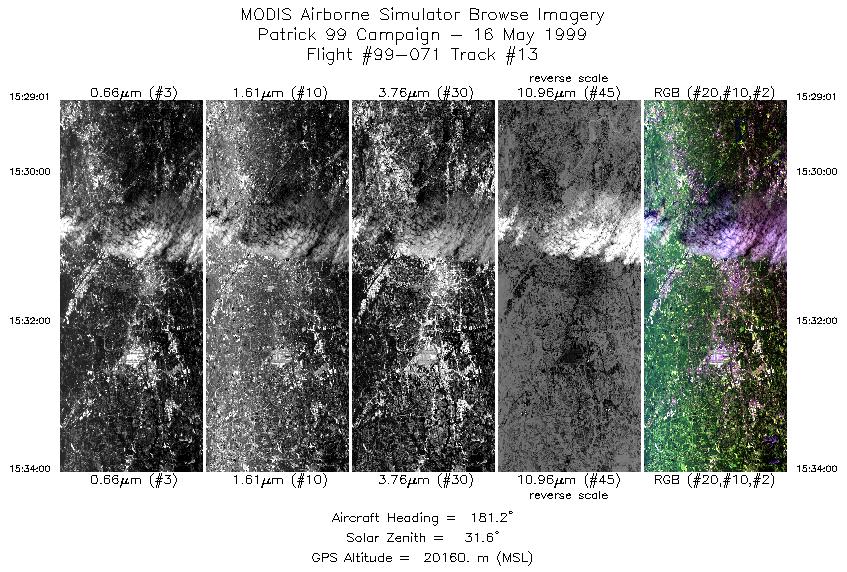
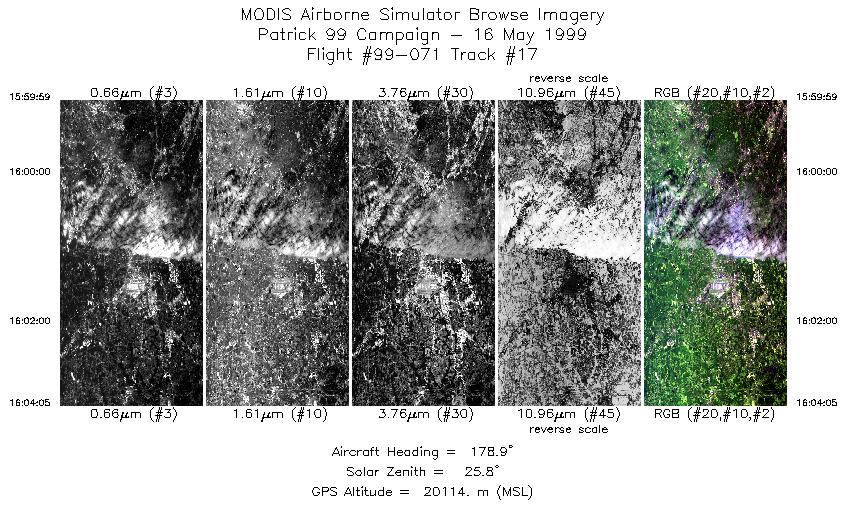
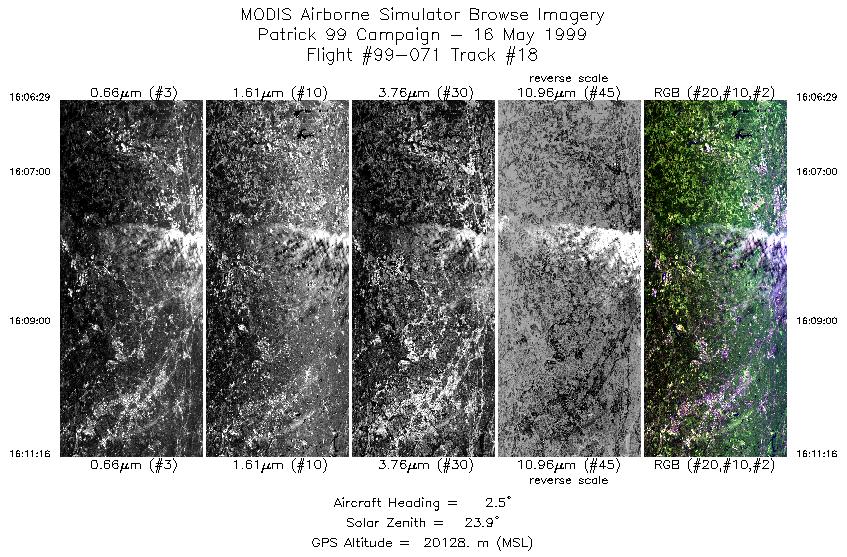
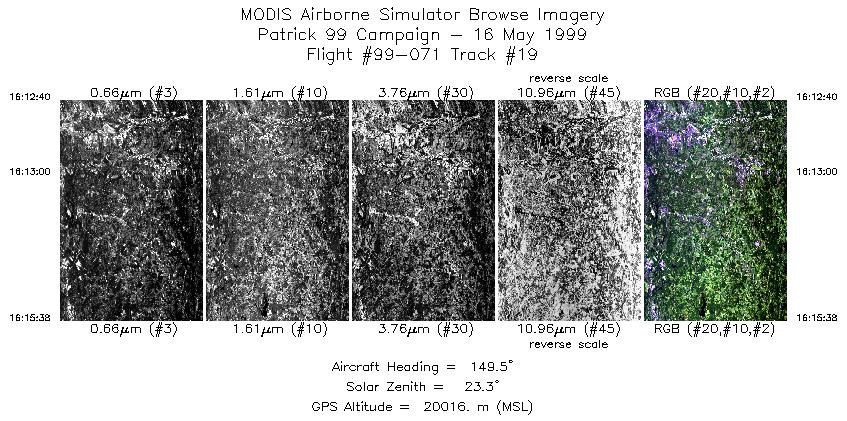
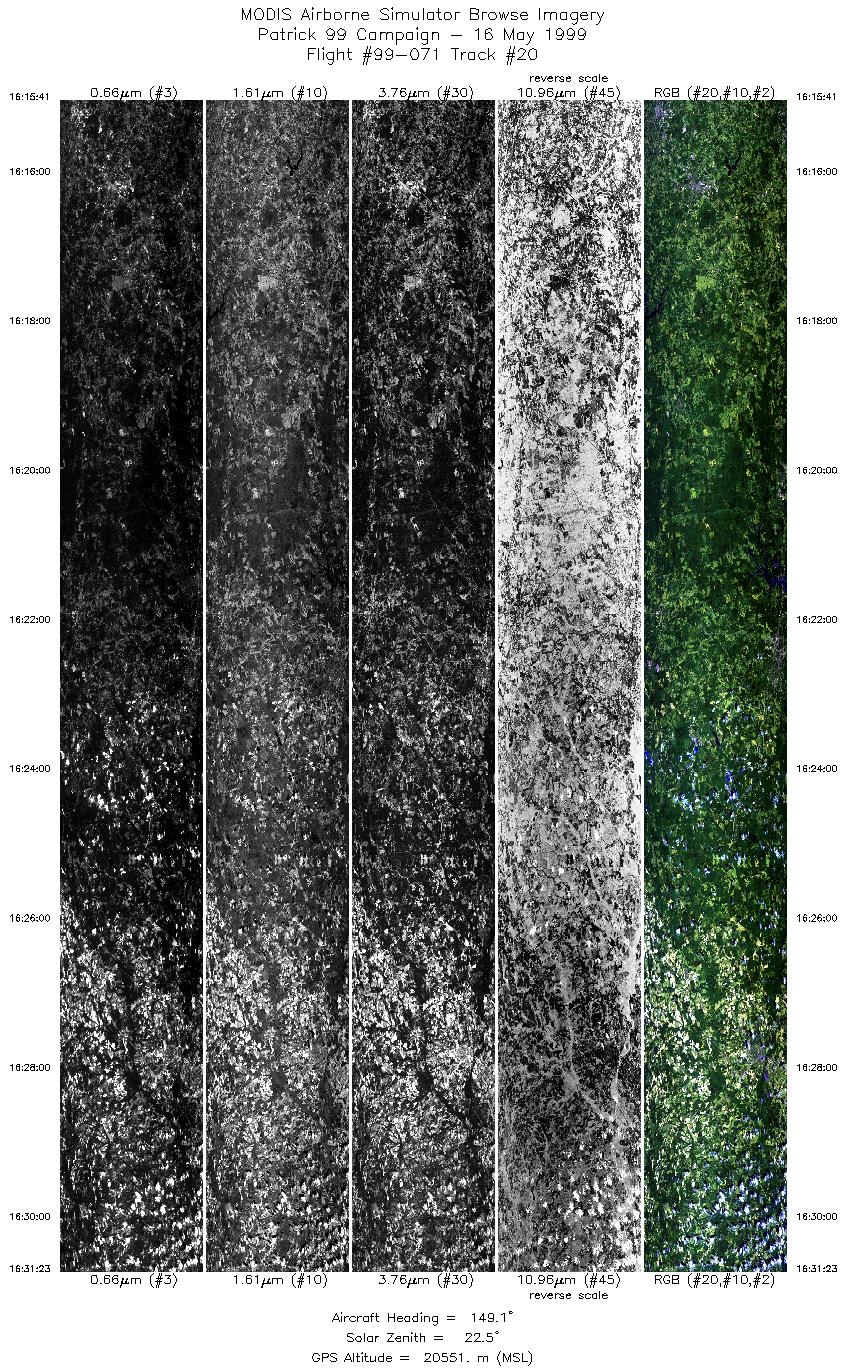
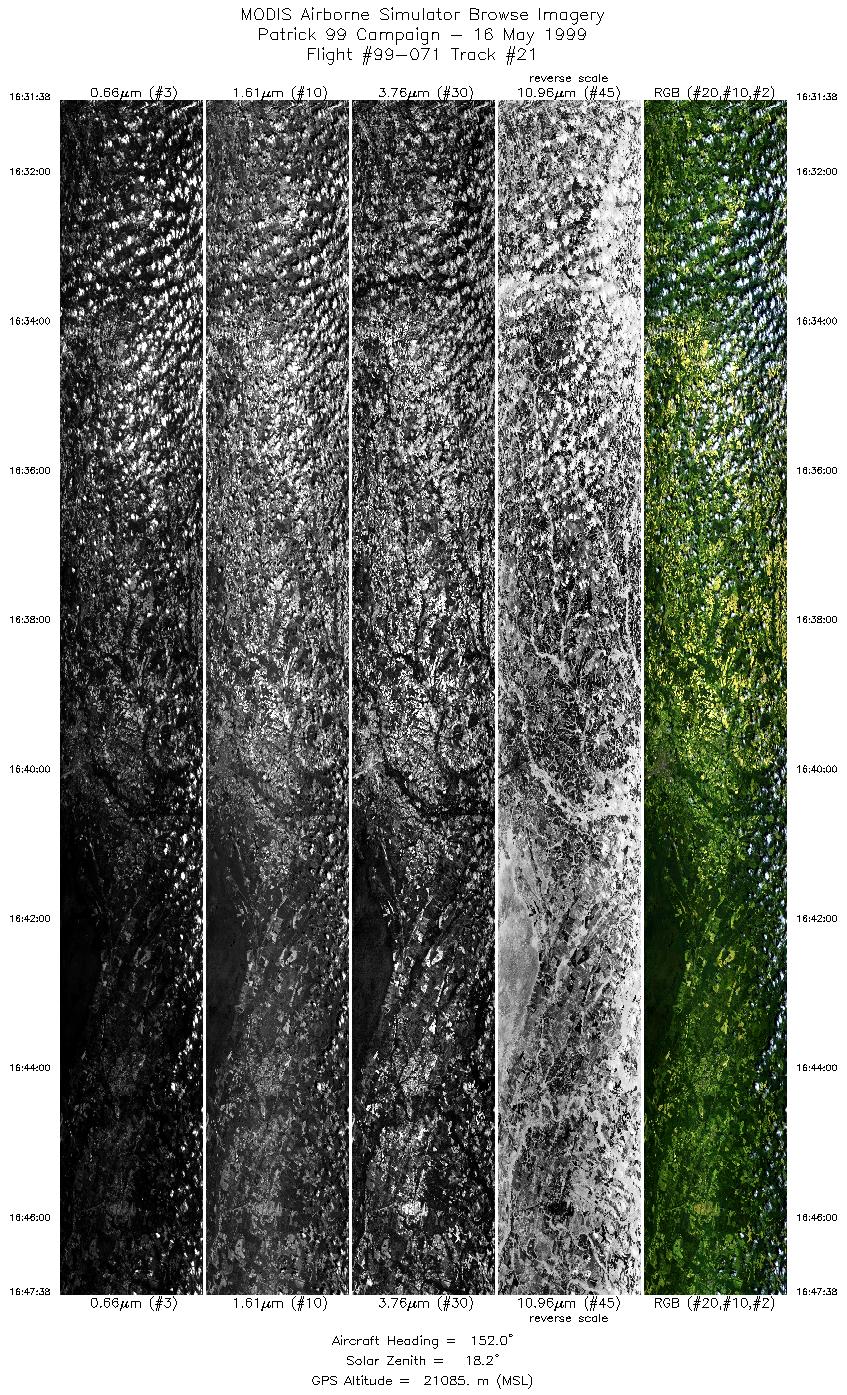
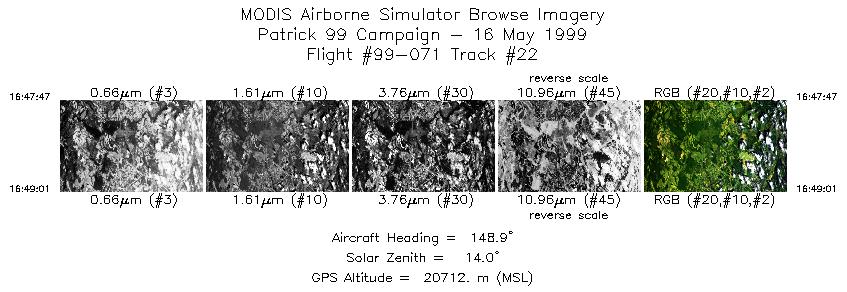
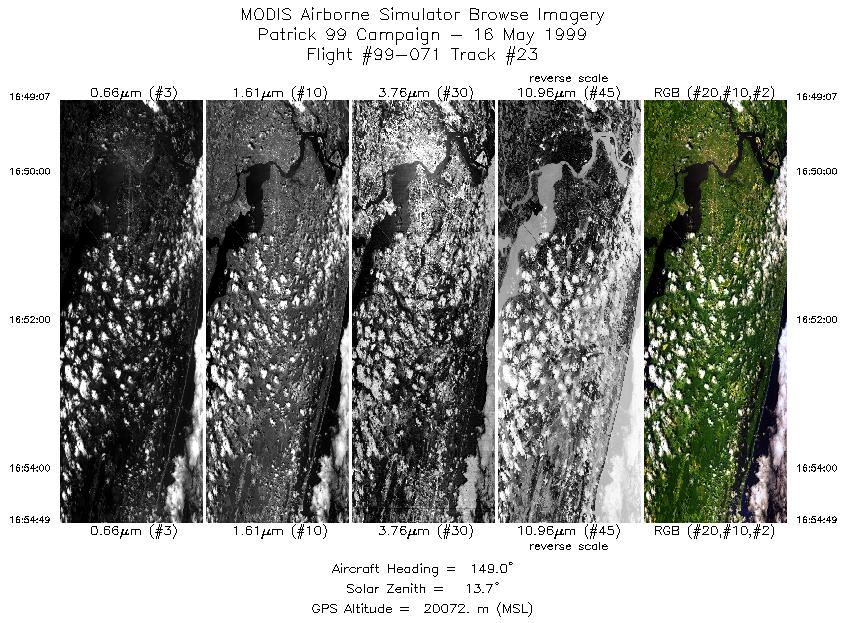
Flight 99-071


| Sample Imagery |
| Click image for full resolution |
|
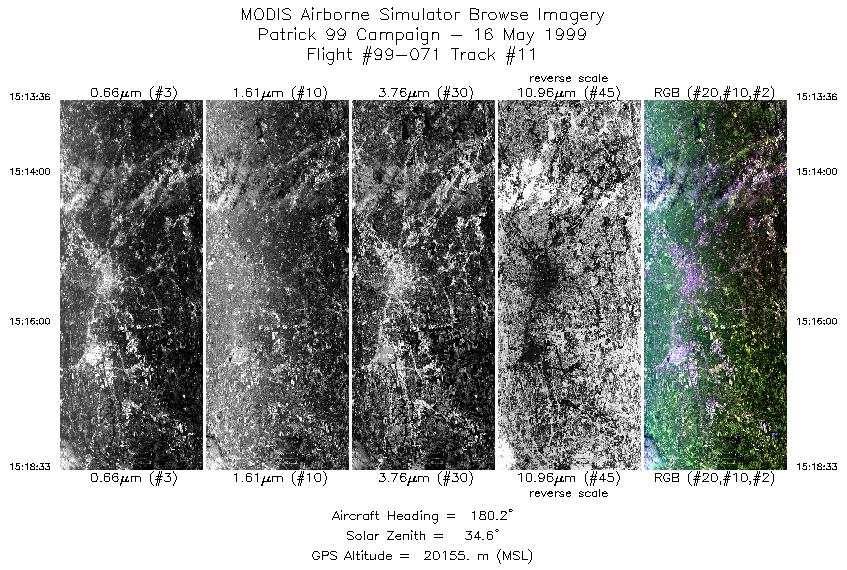
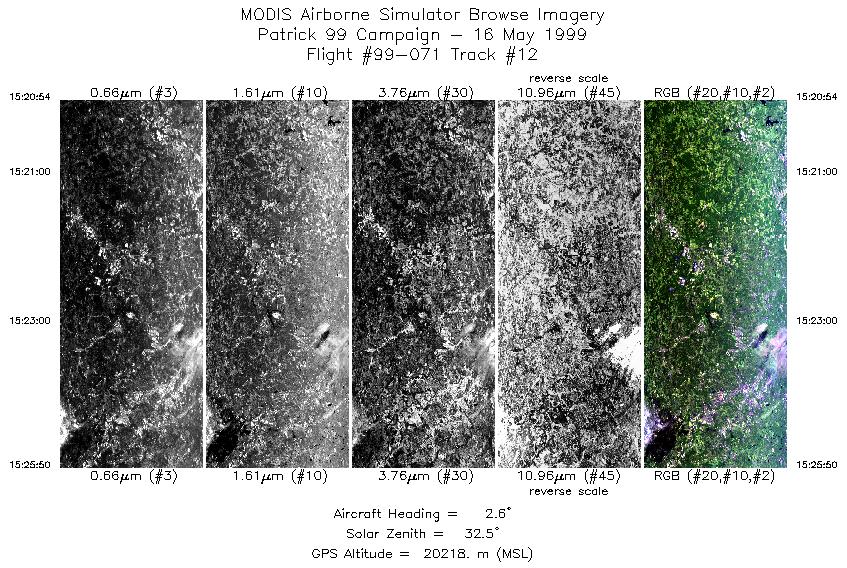
Track #11 Atlanta, GA |


|
|
R: 2.13µm G: 1.62µm B: 0.55µm |
| Sample Imagery |
| Click image for full resolution |
|
Track #18 Atlanta, GA |

|
|
R: 2.13µm G: 1.62µm B: 0.55µm |
- NASA Official: Matt Fladeland
- Project Manager: James Jacobson
- Website Editor: Eric Fraim
- Last Updated: November 16, 2021


