MODIS Airborne Simulator (MAS)
FLIGHT SUMMARY INFORMATION
|
Flight: 98-043 Date: 16 April 1998 Location: Ivanpah, CA Deployment: DFRC March 1998 Principal Investigator: Green (JPL) Additional Sensors: AVIRIS, NAST-I, QCM, RC-10 (12" CIR) |
||||||||||||||||||||||||||||||||||||||||||||||||||||||||||||||||||||||||||||||||||||||||||||||||||||||||||||||||
|
Data Evaluation Overall quality is fair A/D spikes in video and black body counts correlated with black stripes across data in Ports 3 and 4 (channels 26-50; 3.1-14.3µm). |
||||||||||||||||||||||||||||||||||||||||||||||||||||||||||||||||||||||||||||||||||||||||||||||||||||||||||||||||
|
Processing Information Level-1B Data in HDF format is available Flight Line Summary Spectral Band Configuration Spectral Response Function Table |
||||||||||||||||||||||||||||||||||||||||||||||||||||||||||||||||||||||||||||||||||||||||||||||||||||||||||||||||
|
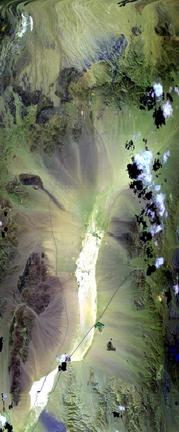
Browse Imagery Flight Tracks: 12 Scanlines: 17563 |
||||||||||||||||||||||||||||||||||||||||||||||||||||||||||||||||||||||||||||||||||||||||||||||||||||||||||||||||
|
||||||||||||||||||||||||||||||||||||||||||||||||||||||||||||||||||||||||||||||||||||||||||||||||||||||||||||||||
- NASA Official: Matt Fladeland
- Project Manager: James Jacobson
- Website Editor: Eric Fraim
- Last Updated: November 16, 2021


