


FLIGHT SUMMARY INFORMATION
Flight Track Map


|
Flight: 16-911 Date: 28 Oct 2015 Location: Southern California Deployment: AFRC Oct 15 Principal Investigators: Myers (NASA ARC) Configuration: 38 Channel Additional Sensors: AirMSPI / PRISM |
|||||||||||||||||||||||||||||||||||||||||||||||||
|
Data Evaluation Overall quality is fair |
|||||||||||||||||||||||||||||||||||||||||||||||||
|
Processing Information Level-1B Data in HDF format is available Flight Line Summary Spectral Band Configuration Spectral Response Function Table Spectral Response Function (text) |
|||||||||||||||||||||||||||||||||||||||||||||||||
|
Browse Imagery Flight Tracks: 3 Scanlines: 7491 |
|||||||||||||||||||||||||||||||||||||||||||||||||
|
|||||||||||||||||||||||||||||||||||||||||||||||||

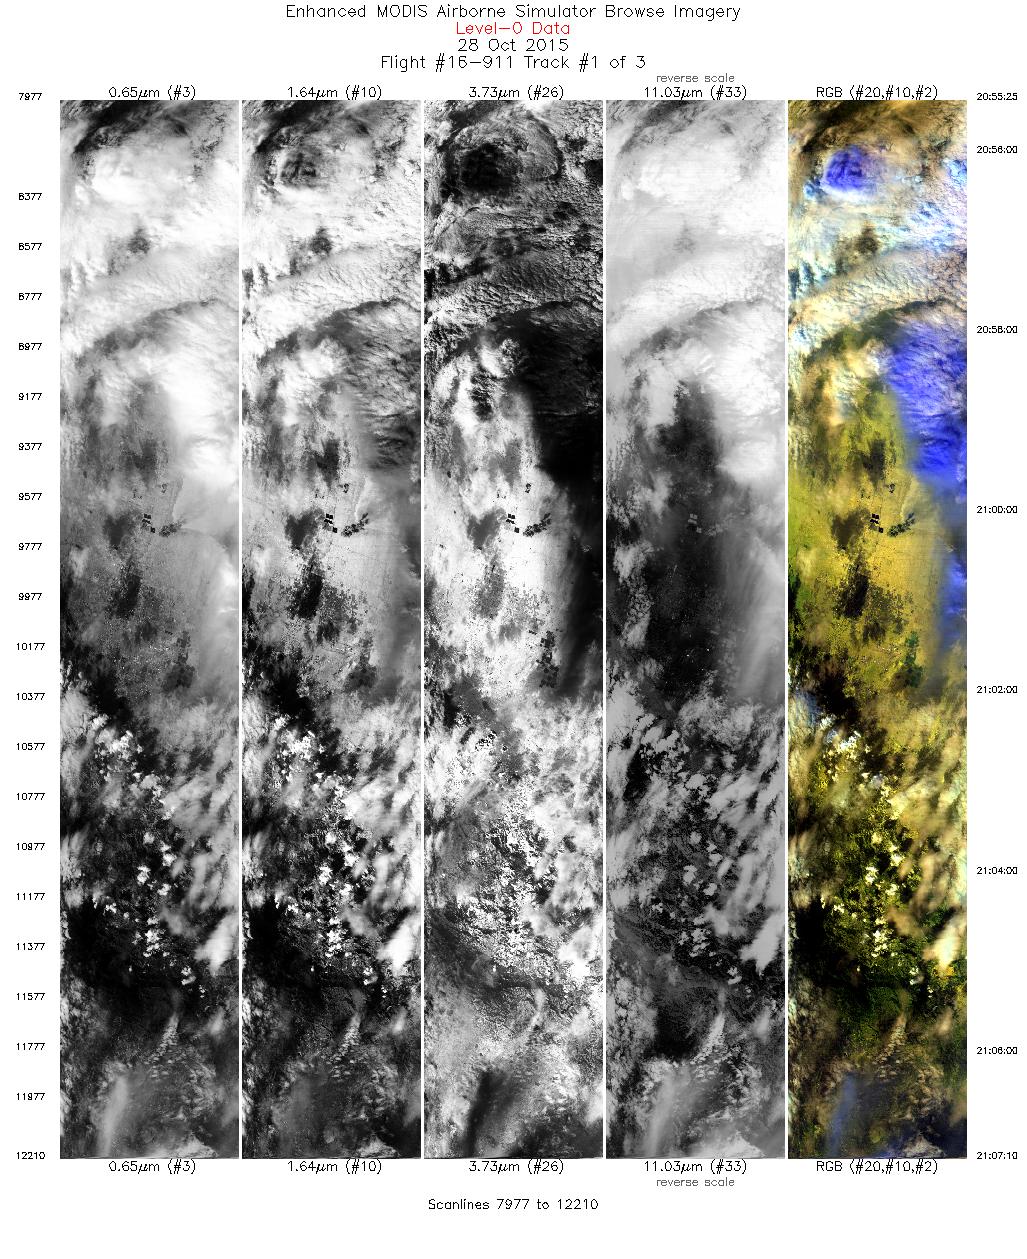
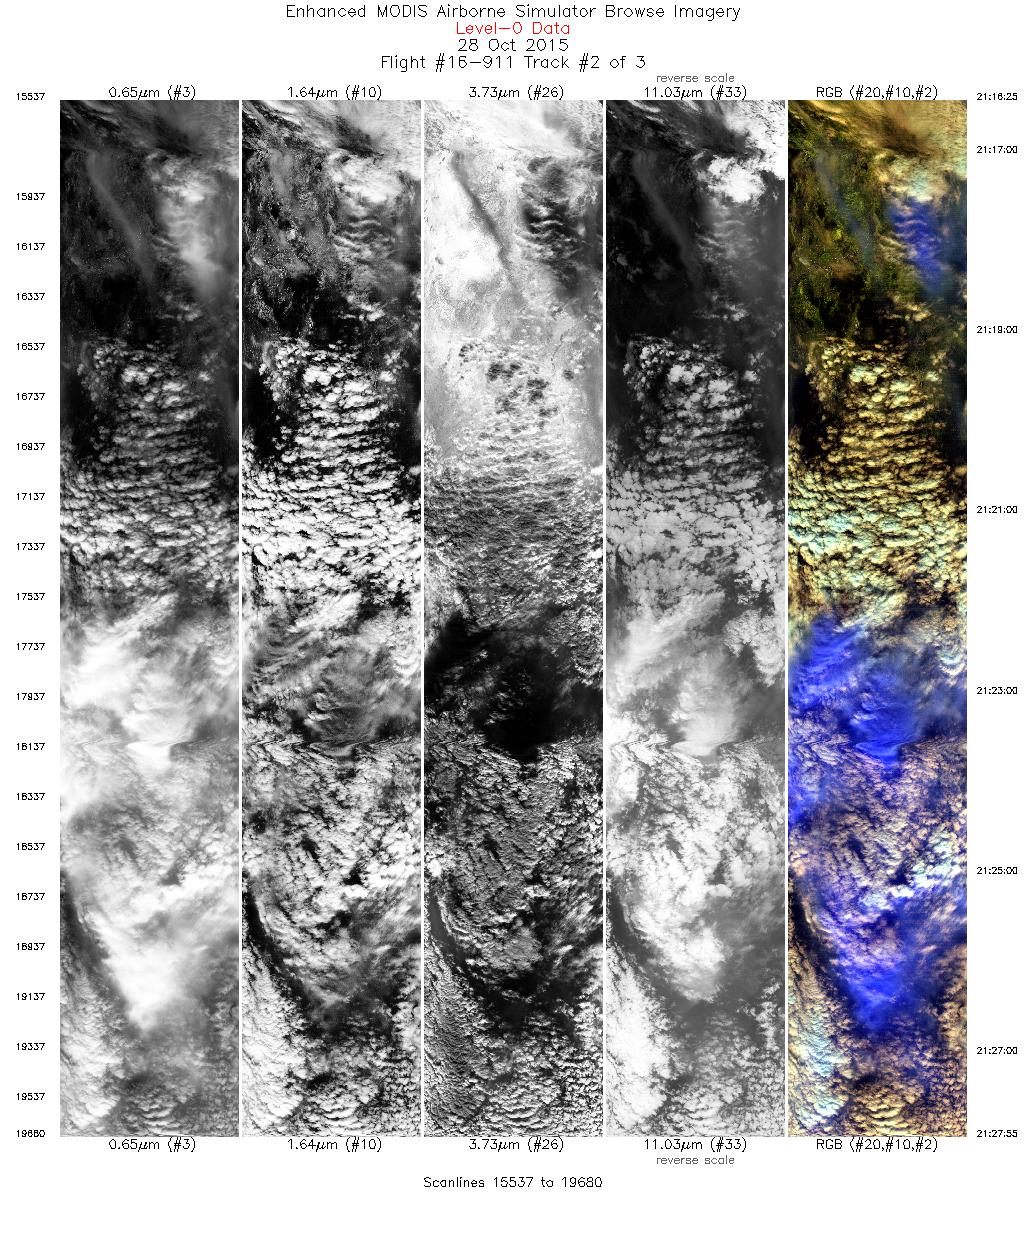
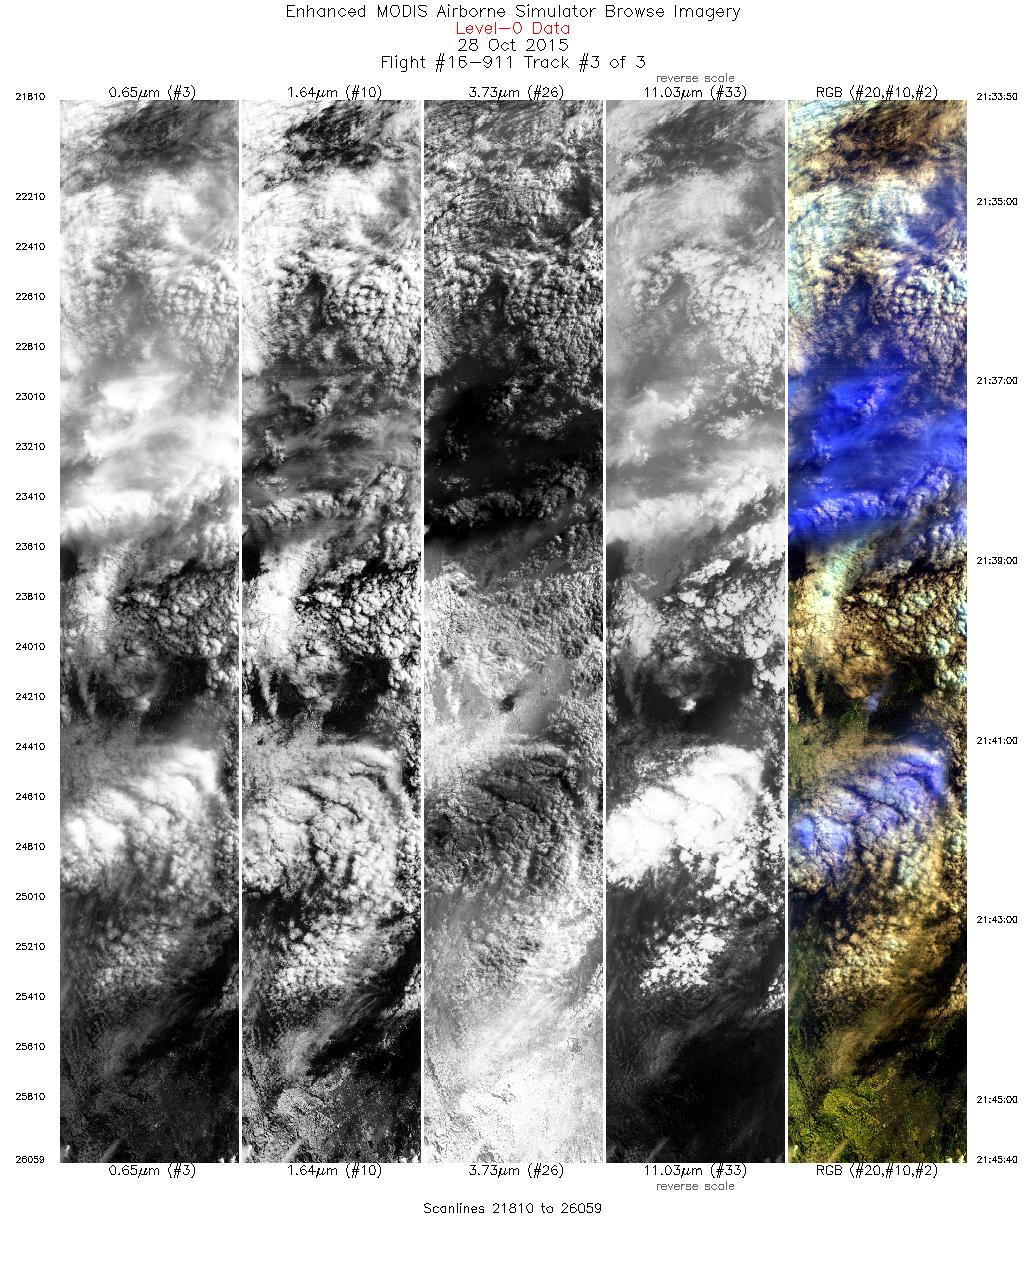
Flight 16-911


| Sample Imagery |
| Click image for full resolution |
|
Track: #01 Palmdale-Lancaster, CA |


|
|
R: 0.66µm G: 0.55µm B: 0.47µm |
- NASA Official: Matt Fladeland
- Project Manager: James Jacobson
- Website Editor: Eric Fraim
- Last Updated: November 16, 2021