


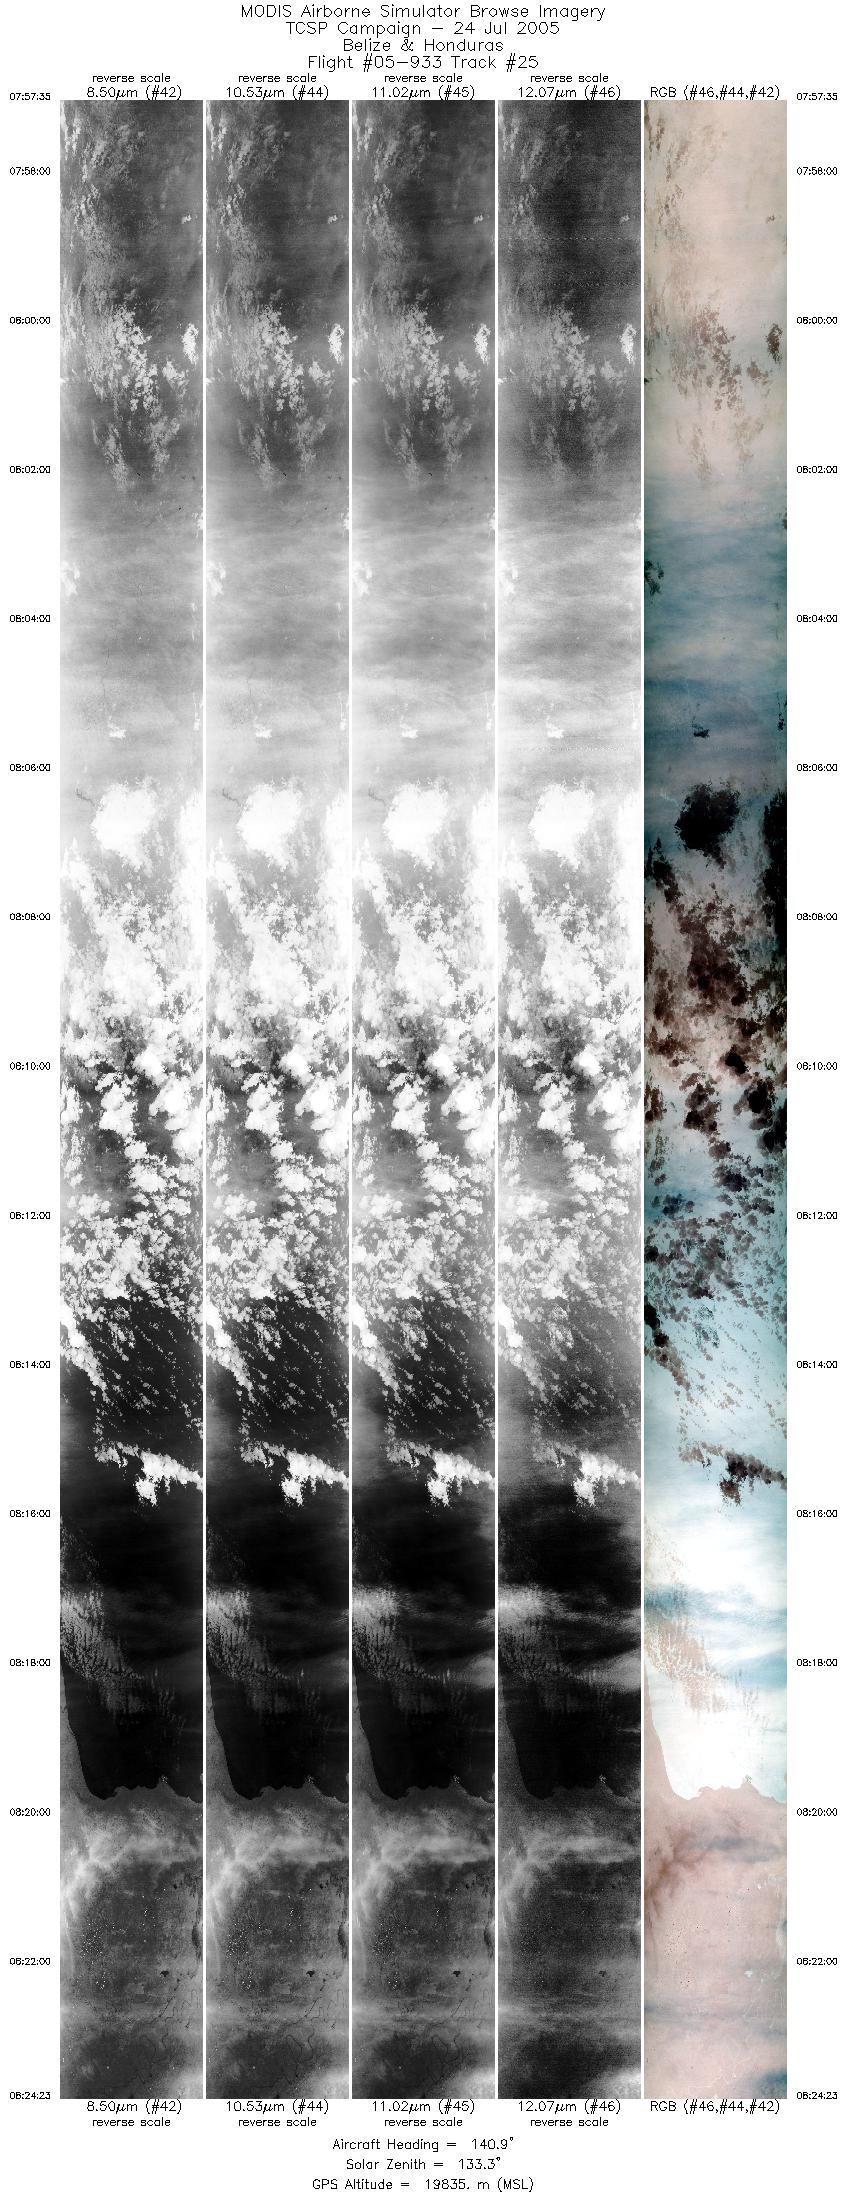
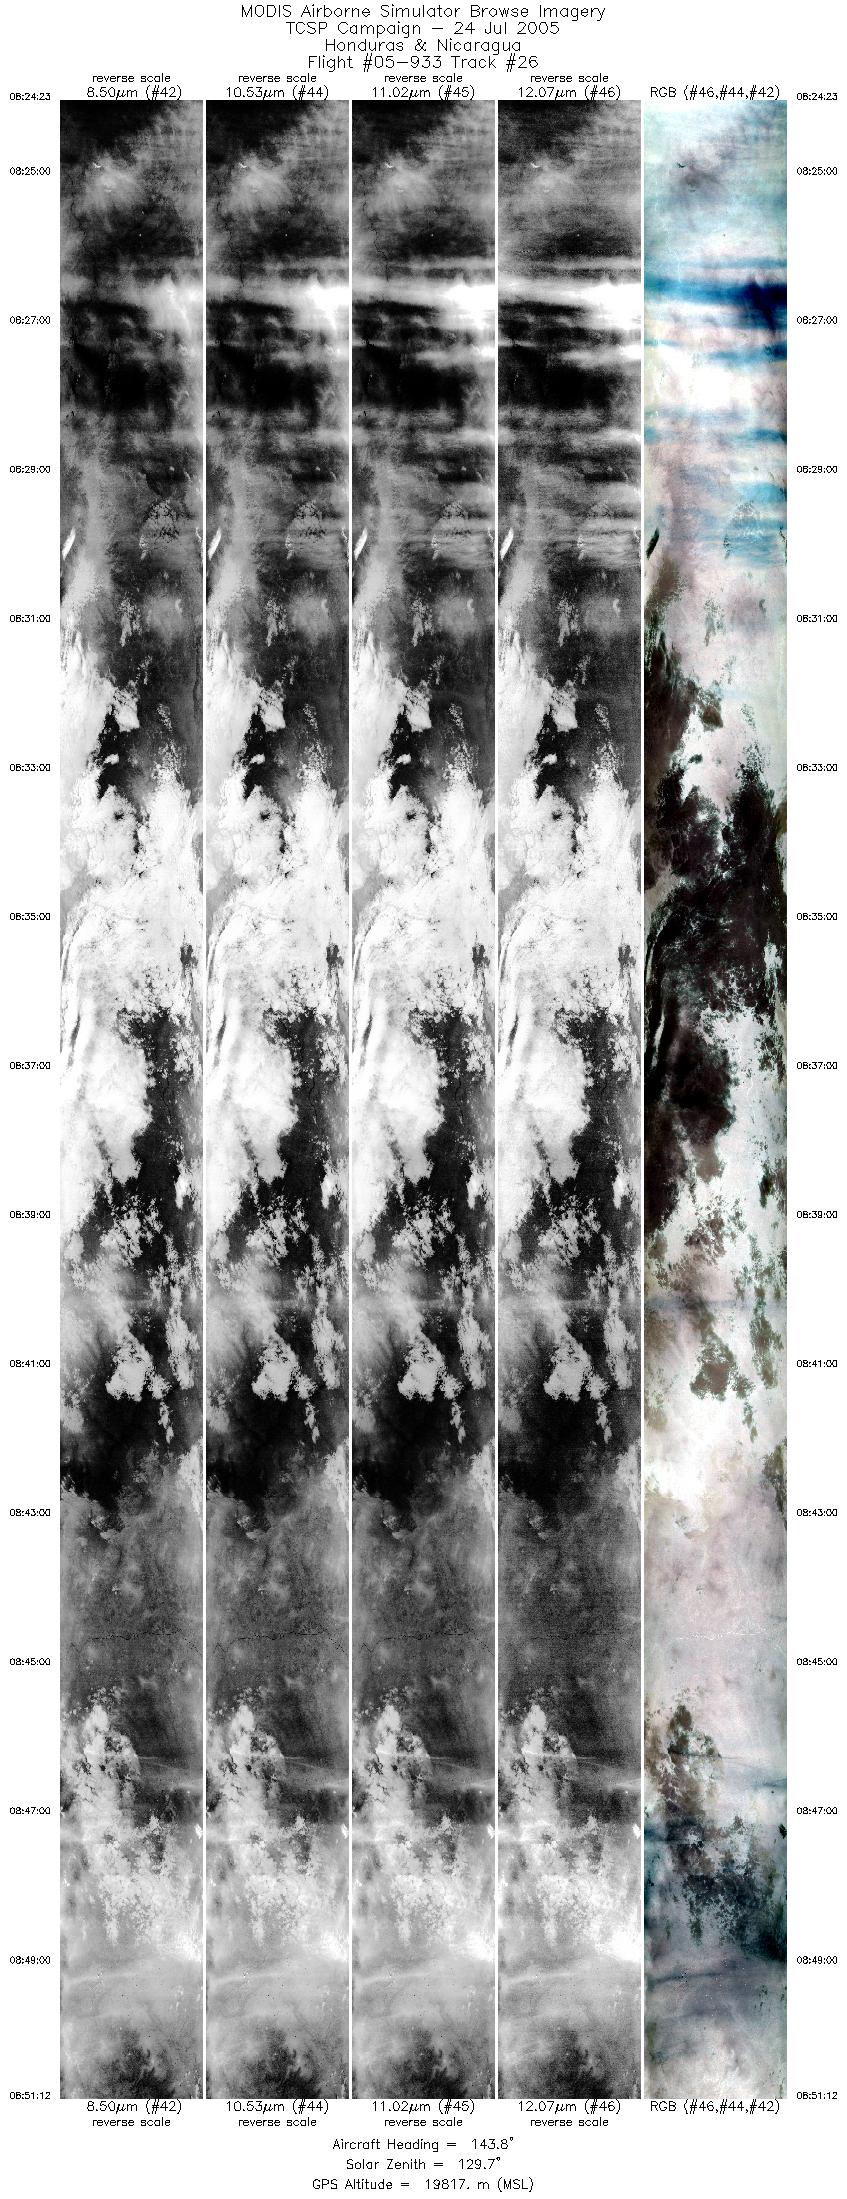
MODIS Airborne Simulator (MAS)
FLIGHT SUMMARY INFORMATION
Flight Track Map


|
Flight: 05-933 Date: 24 July 2006 Location: Central America / Gulf of Mexico Deployment: TCSP Principal Investigators: Myers (ARC) Additional Sensors: AMPR, CRS, EDOP, HAMSR, LIP, MTP, REVEAL, VIS |
||||||||||||||||||||||||||||||||||||||||||||||||||||||||||||||||||||||||||||||||||||||||||||||||||||||||||||||||||||||||||||||||||||||||||||||||||||||||||||||||||||||||||||||||||||||||||||||||||||||||||||||||||
|
Data Evaluation Overall quality is good |
||||||||||||||||||||||||||||||||||||||||||||||||||||||||||||||||||||||||||||||||||||||||||||||||||||||||||||||||||||||||||||||||||||||||||||||||||||||||||||||||||||||||||||||||||||||||||||||||||||||||||||||||||
|
Processing Information Level-1B Data in HDF format is available Flight Line Summary Spectral Band Configuration Spectral Response Function Table |
||||||||||||||||||||||||||||||||||||||||||||||||||||||||||||||||||||||||||||||||||||||||||||||||||||||||||||||||||||||||||||||||||||||||||||||||||||||||||||||||||||||||||||||||||||||||||||||||||||||||||||||||||
|
Browse Imagery Flight Tracks: 26 Scanlines: 120977 |
||||||||||||||||||||||||||||||||||||||||||||||||||||||||||||||||||||||||||||||||||||||||||||||||||||||||||||||||||||||||||||||||||||||||||||||||||||||||||||||||||||||||||||||||||||||||||||||||||||||||||||||||||
|
||||||||||||||||||||||||||||||||||||||||||||||||||||||||||||||||||||||||||||||||||||||||||||||||||||||||||||||||||||||||||||||||||||||||||||||||||||||||||||||||||||||||||||||||||||||||||||||||||||||||||||||||||

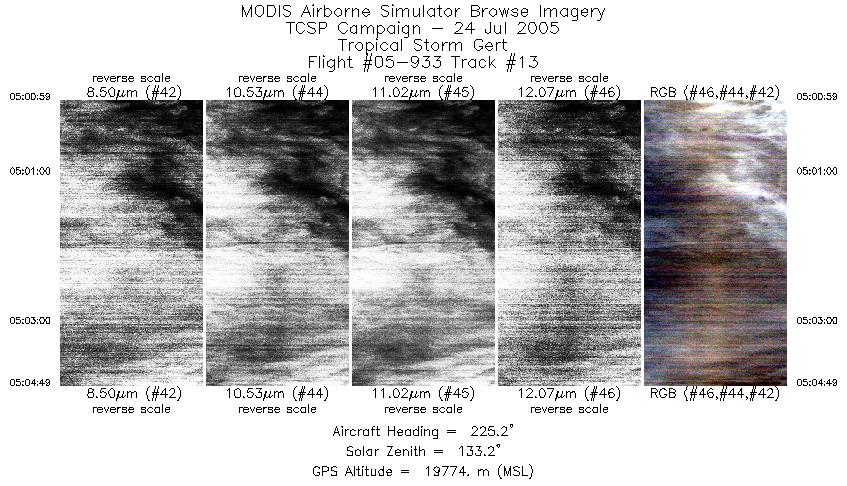
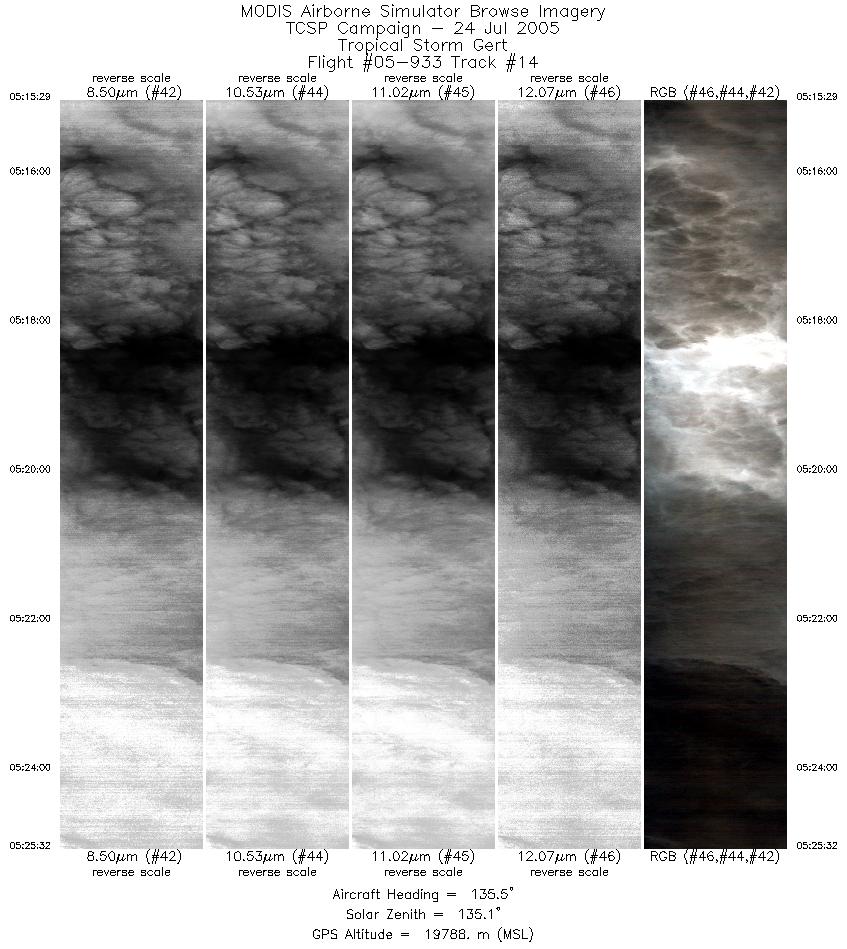
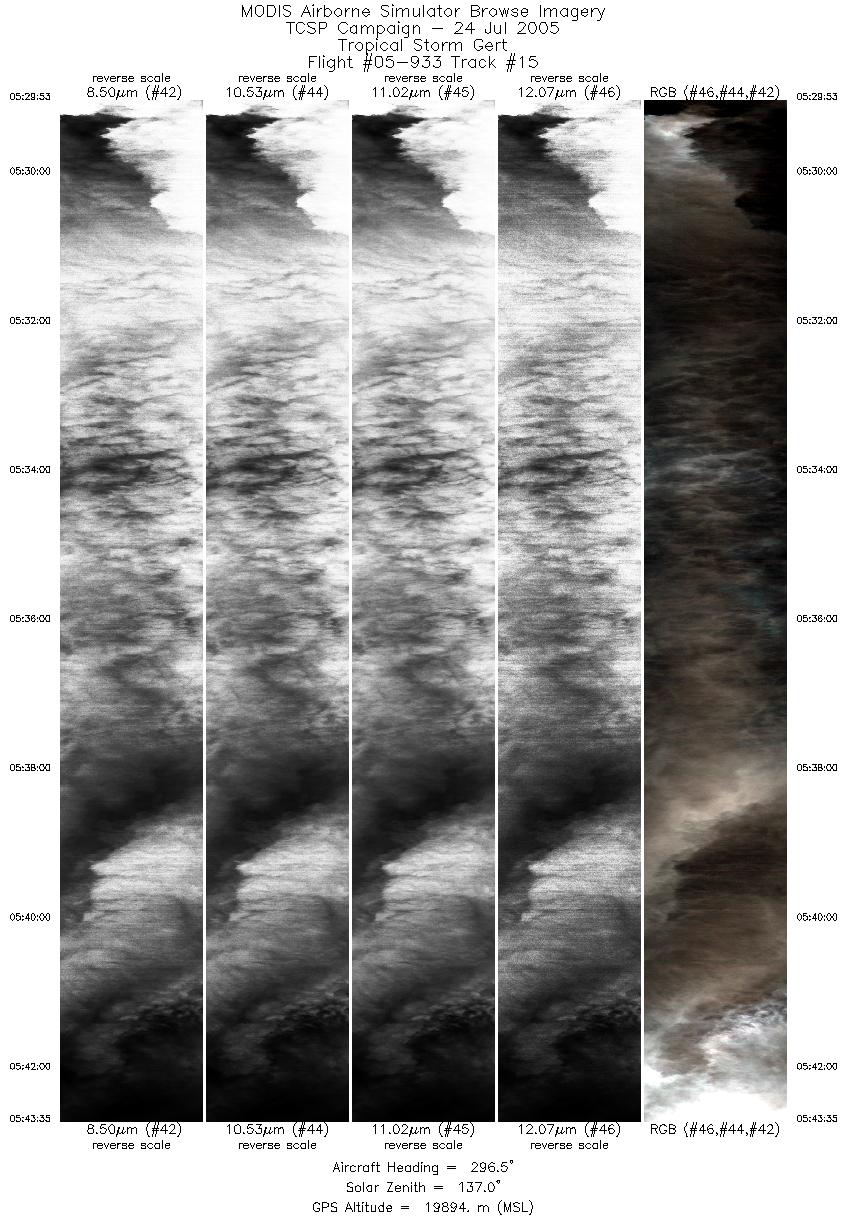
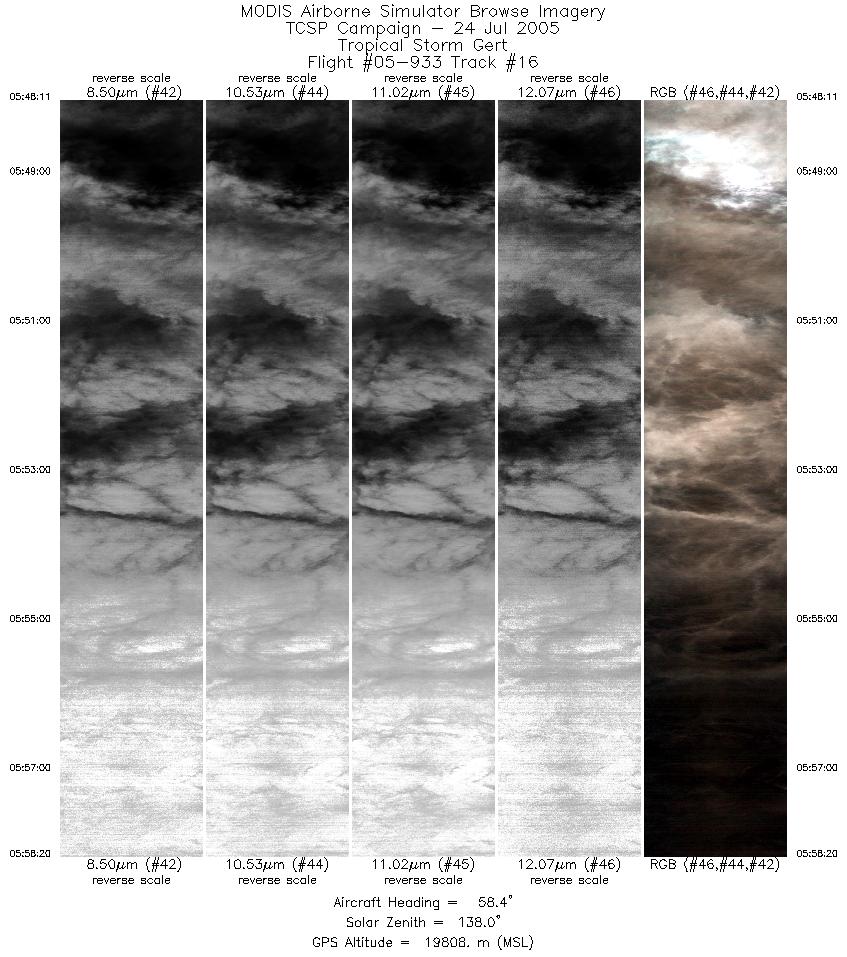
Flight 05-933


| Sample Imagery |
| Click image for full resolution |
|
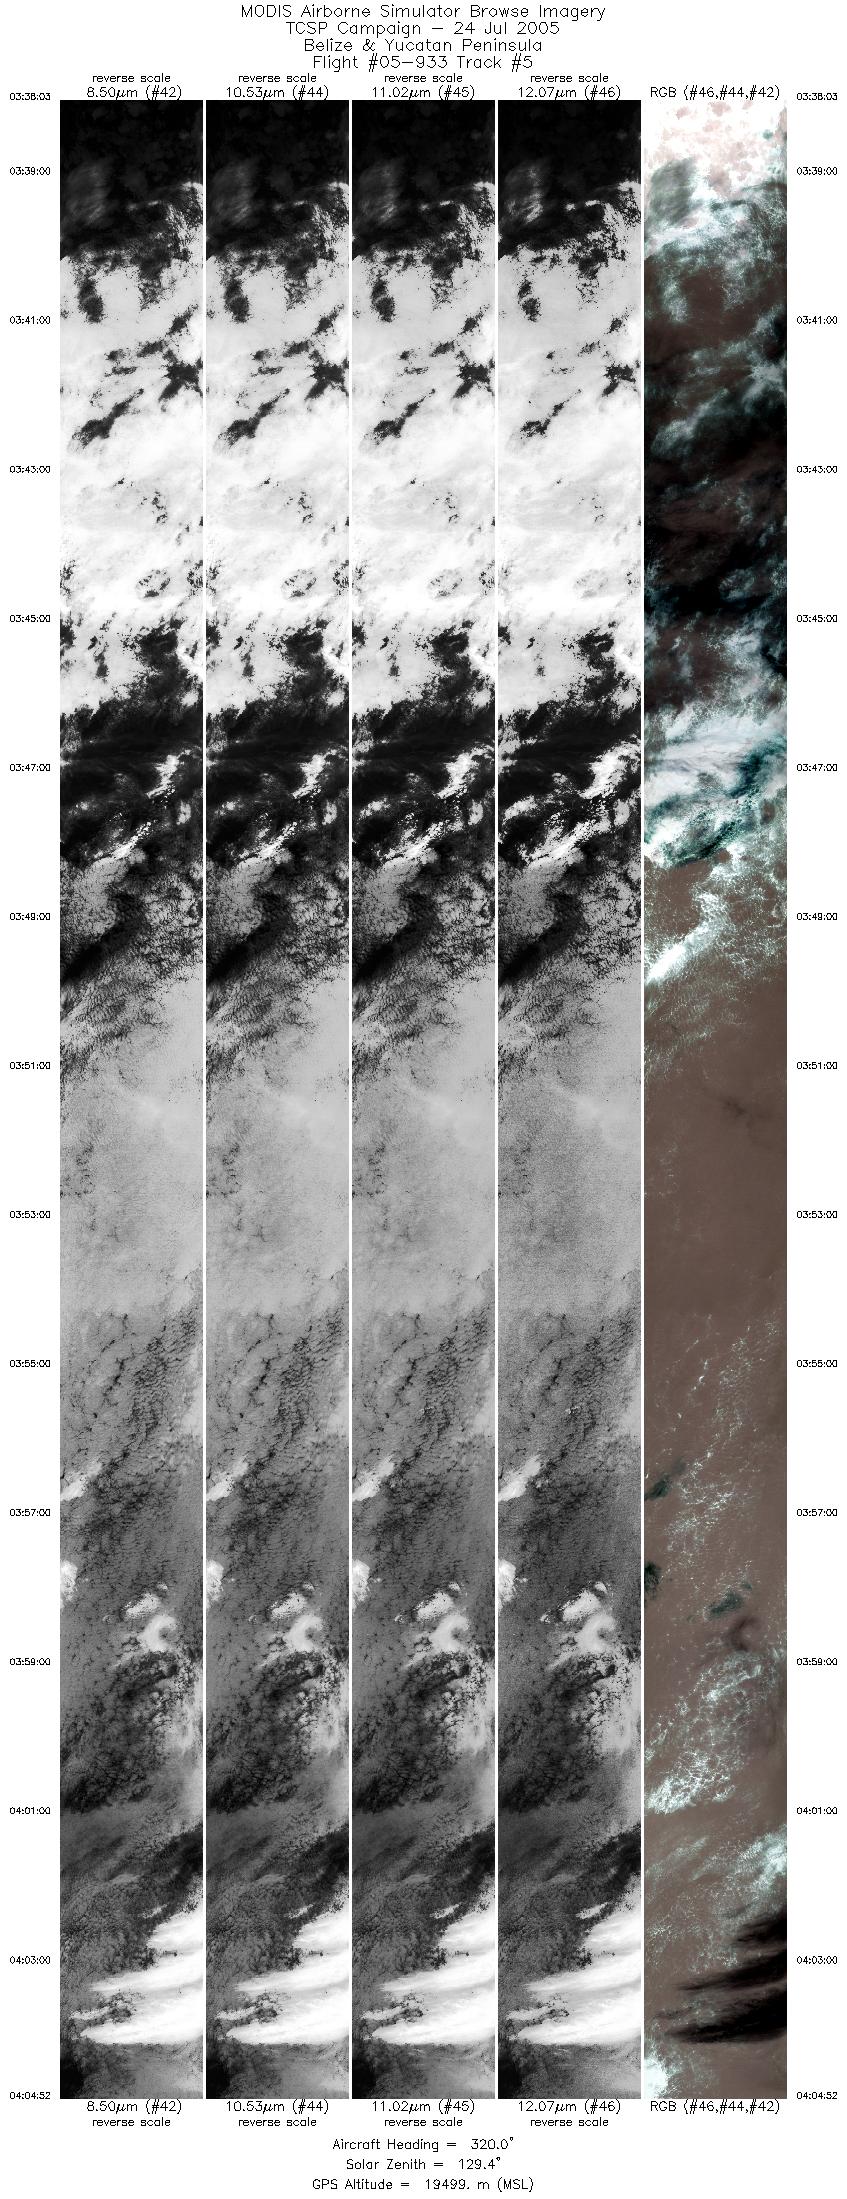
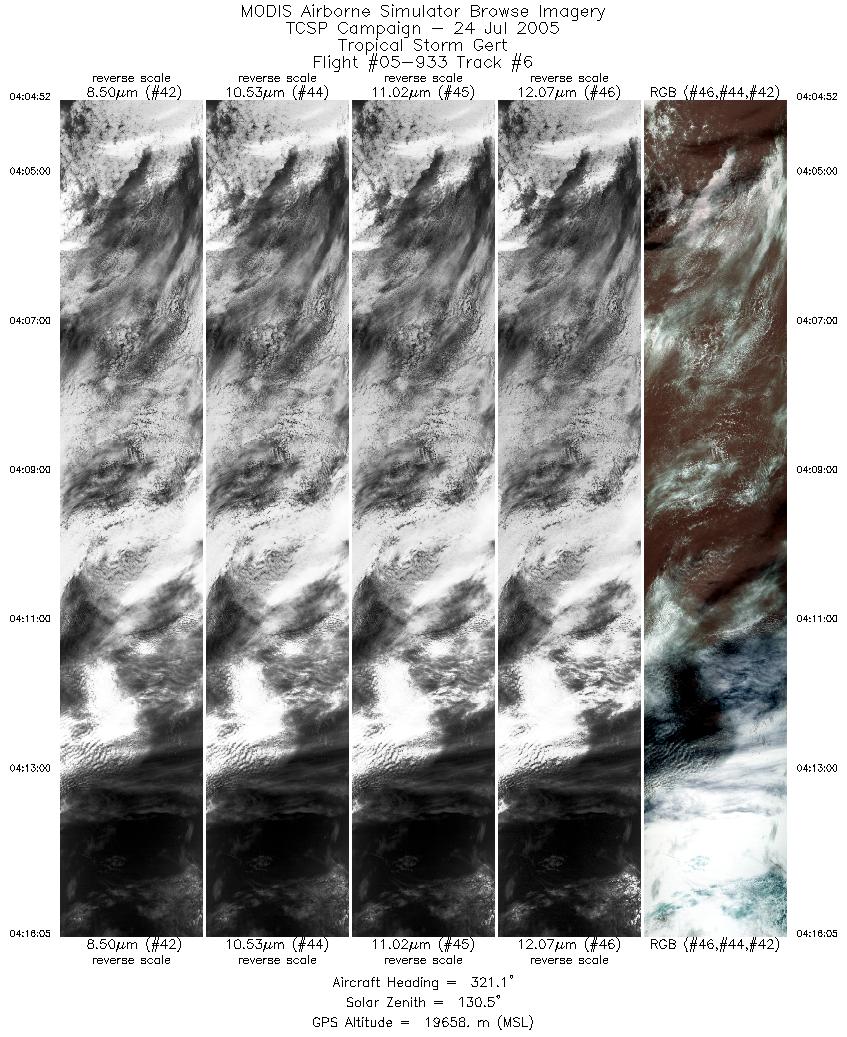
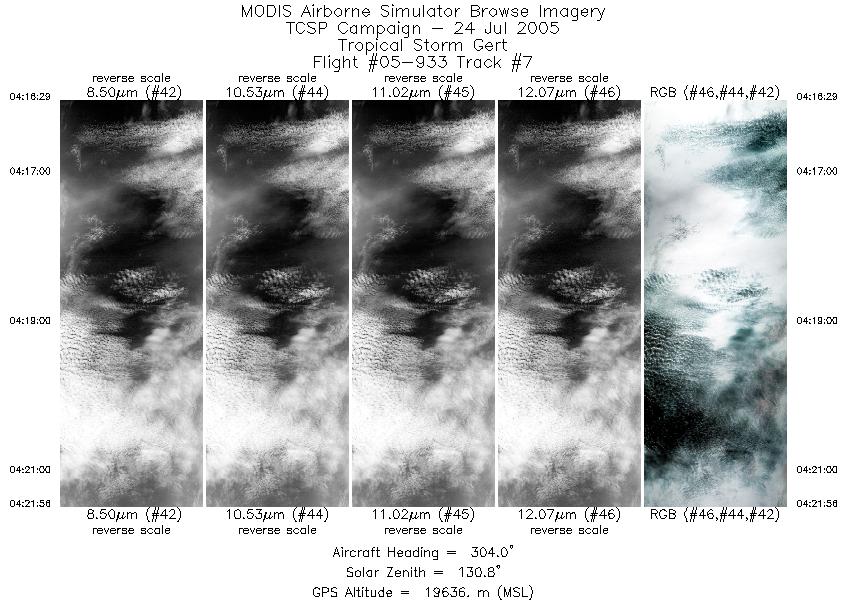
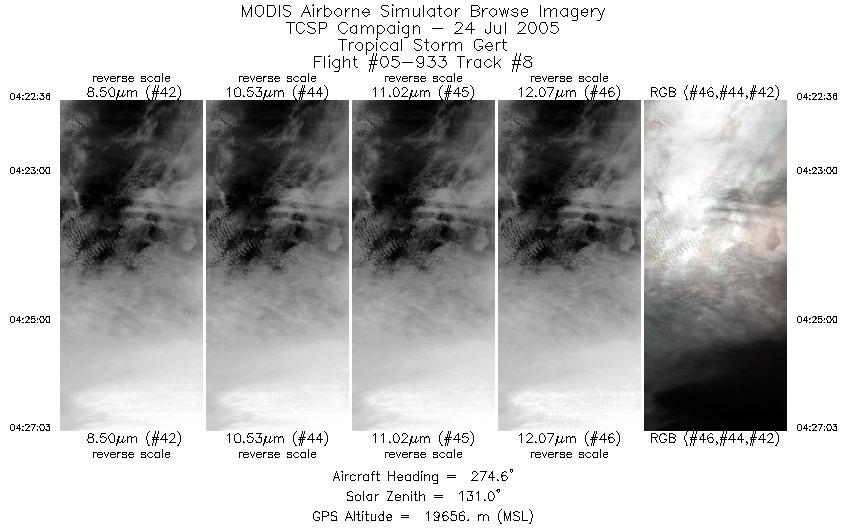
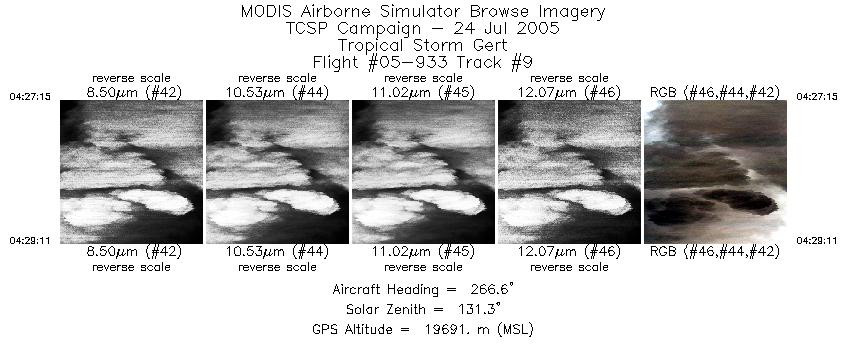
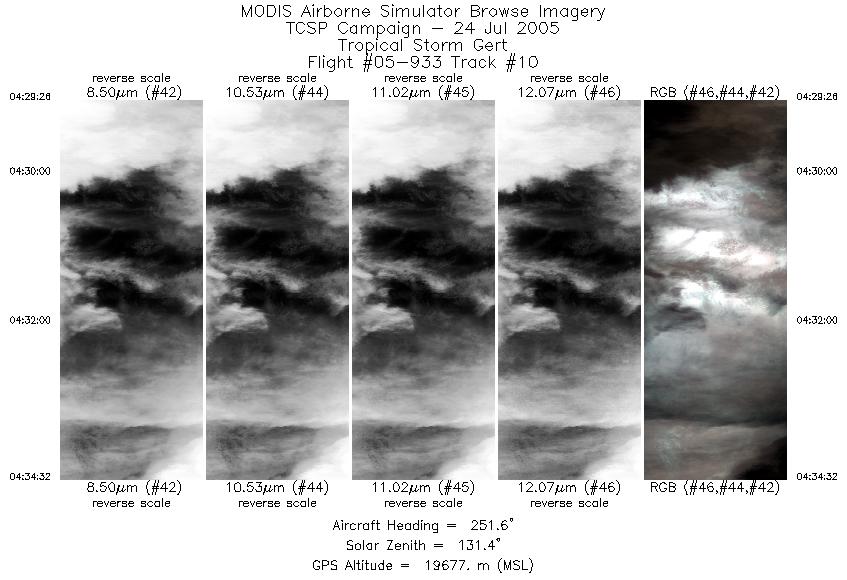
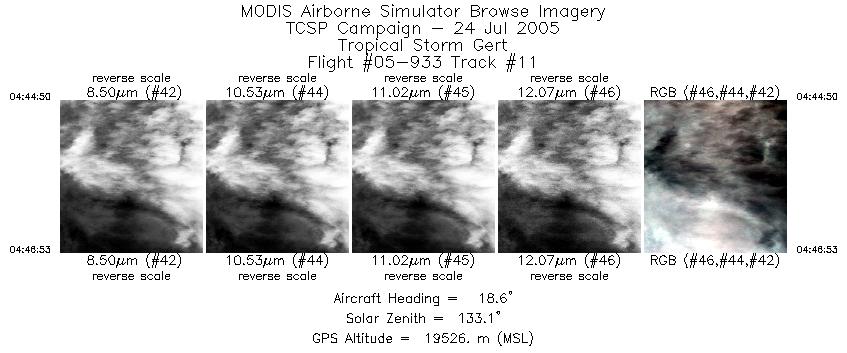
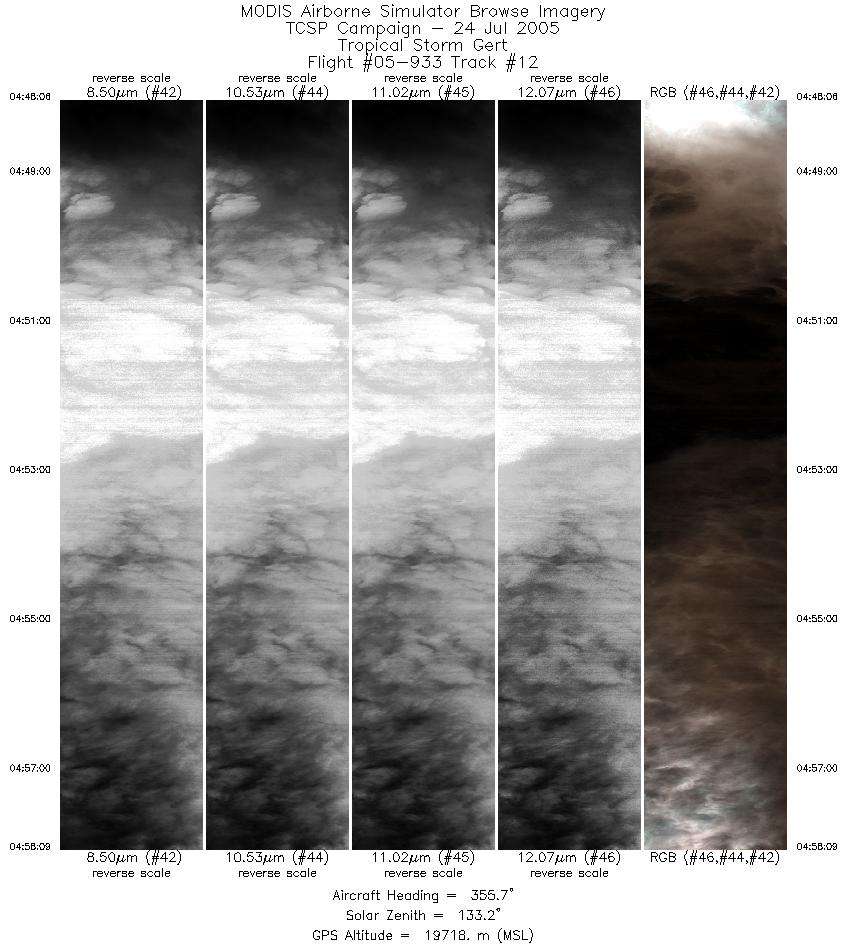
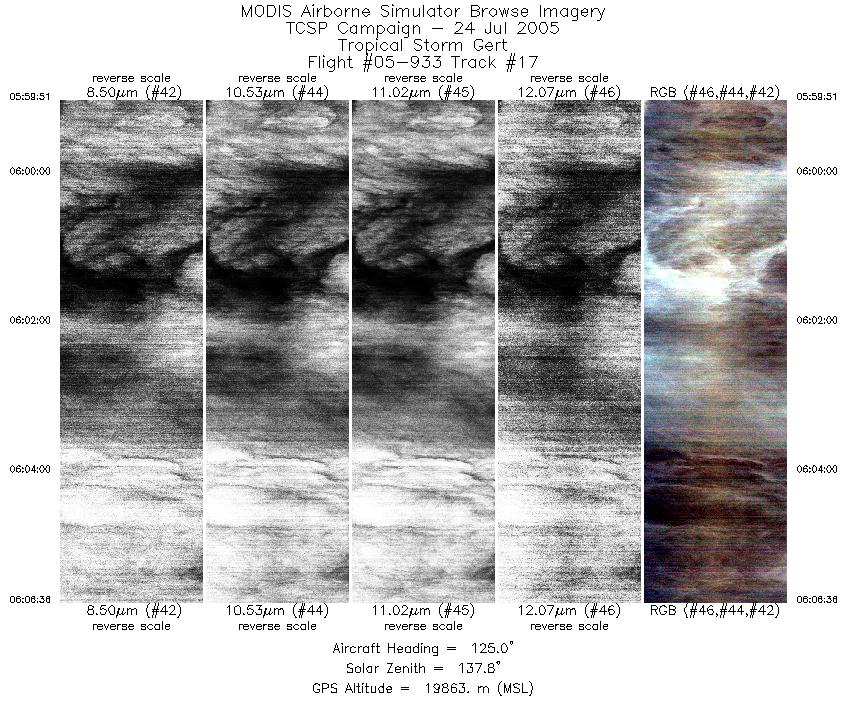
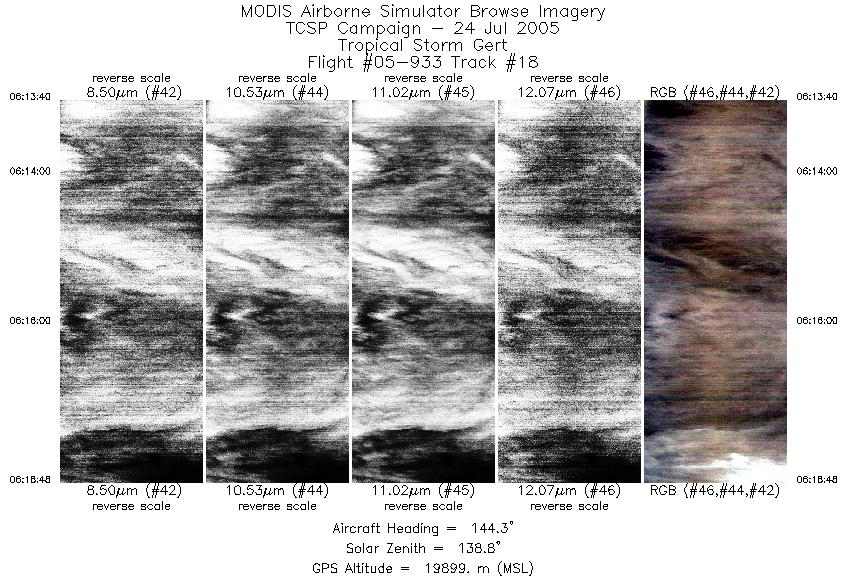
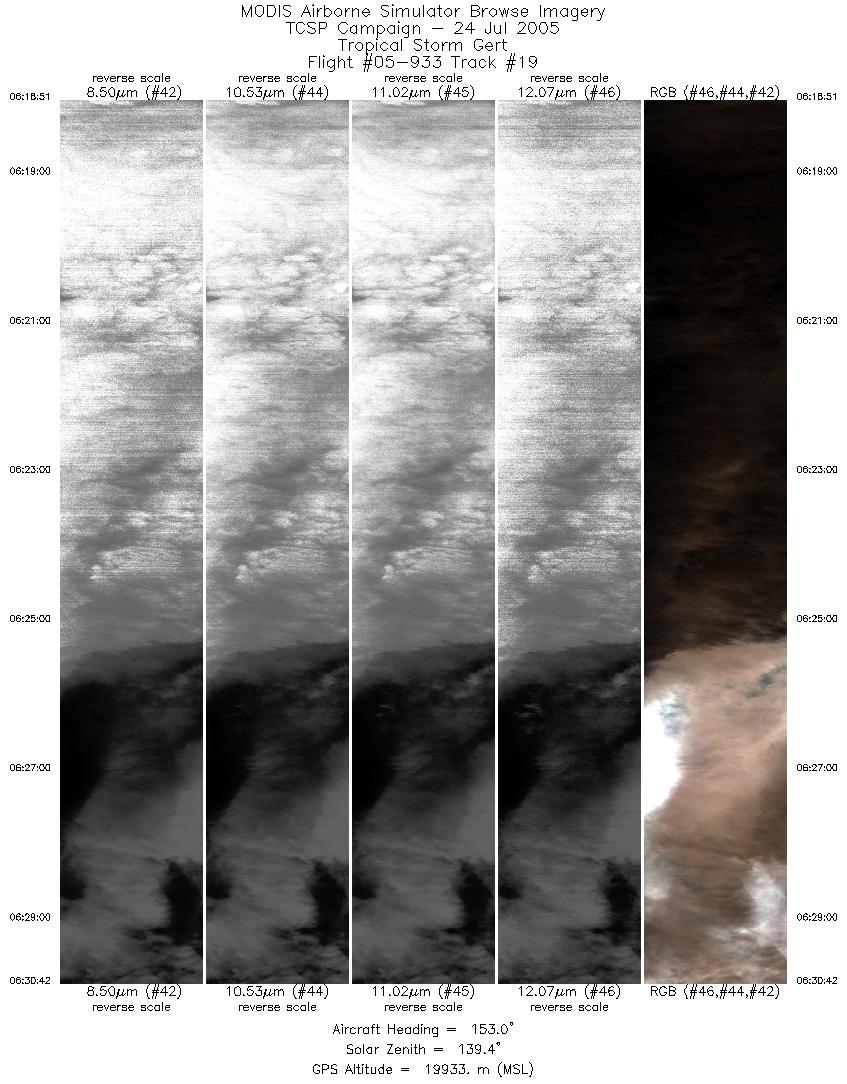
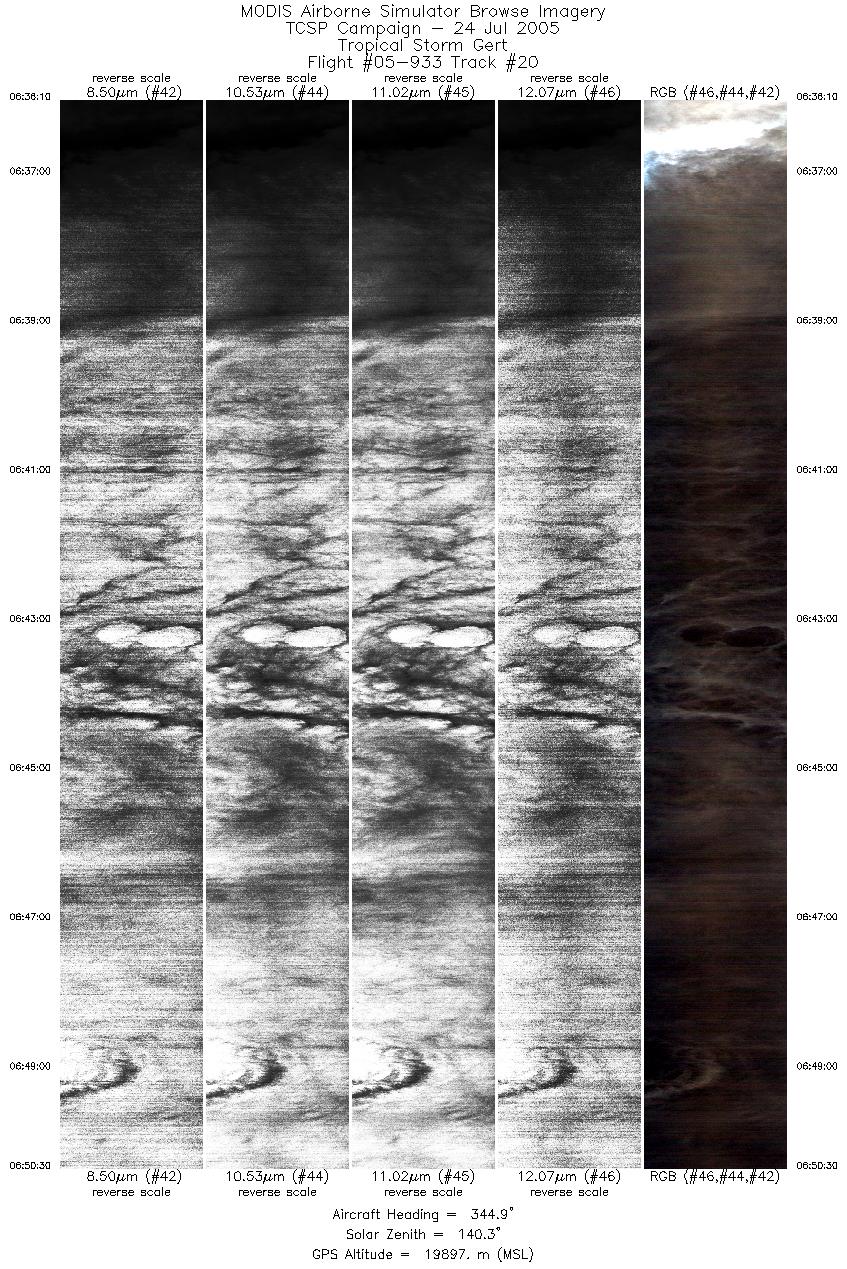
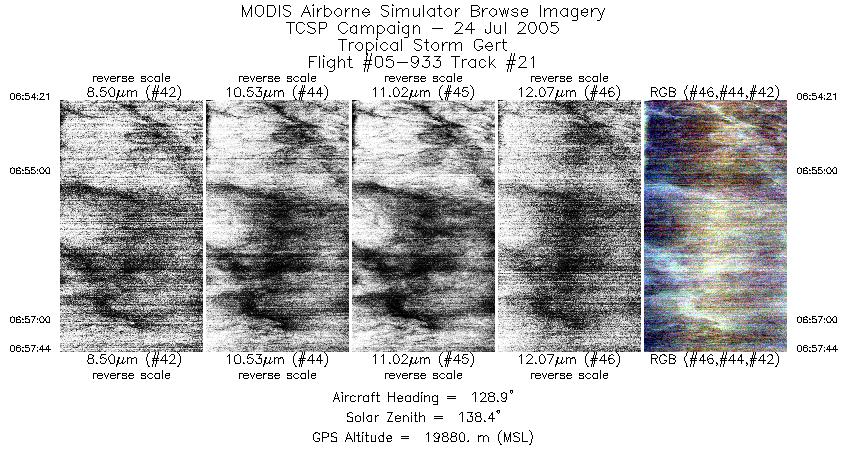
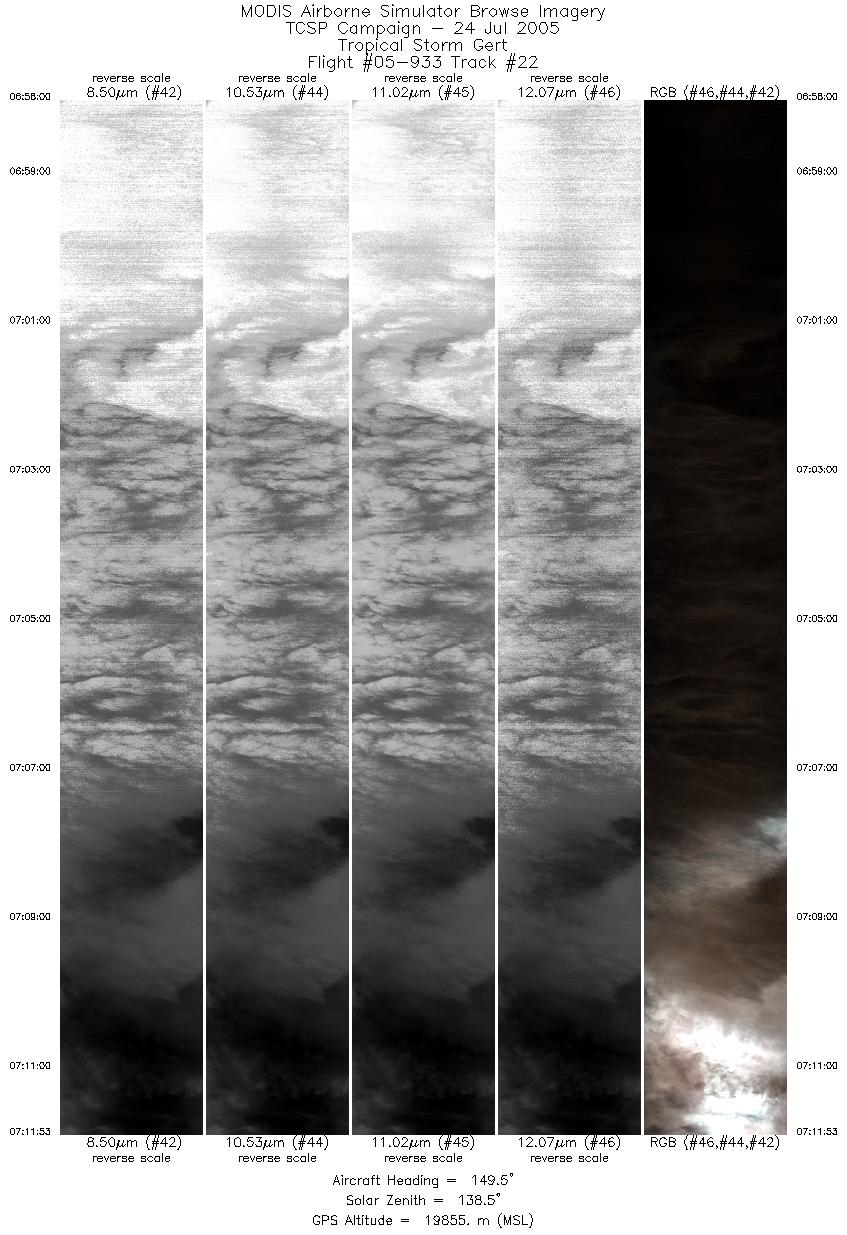
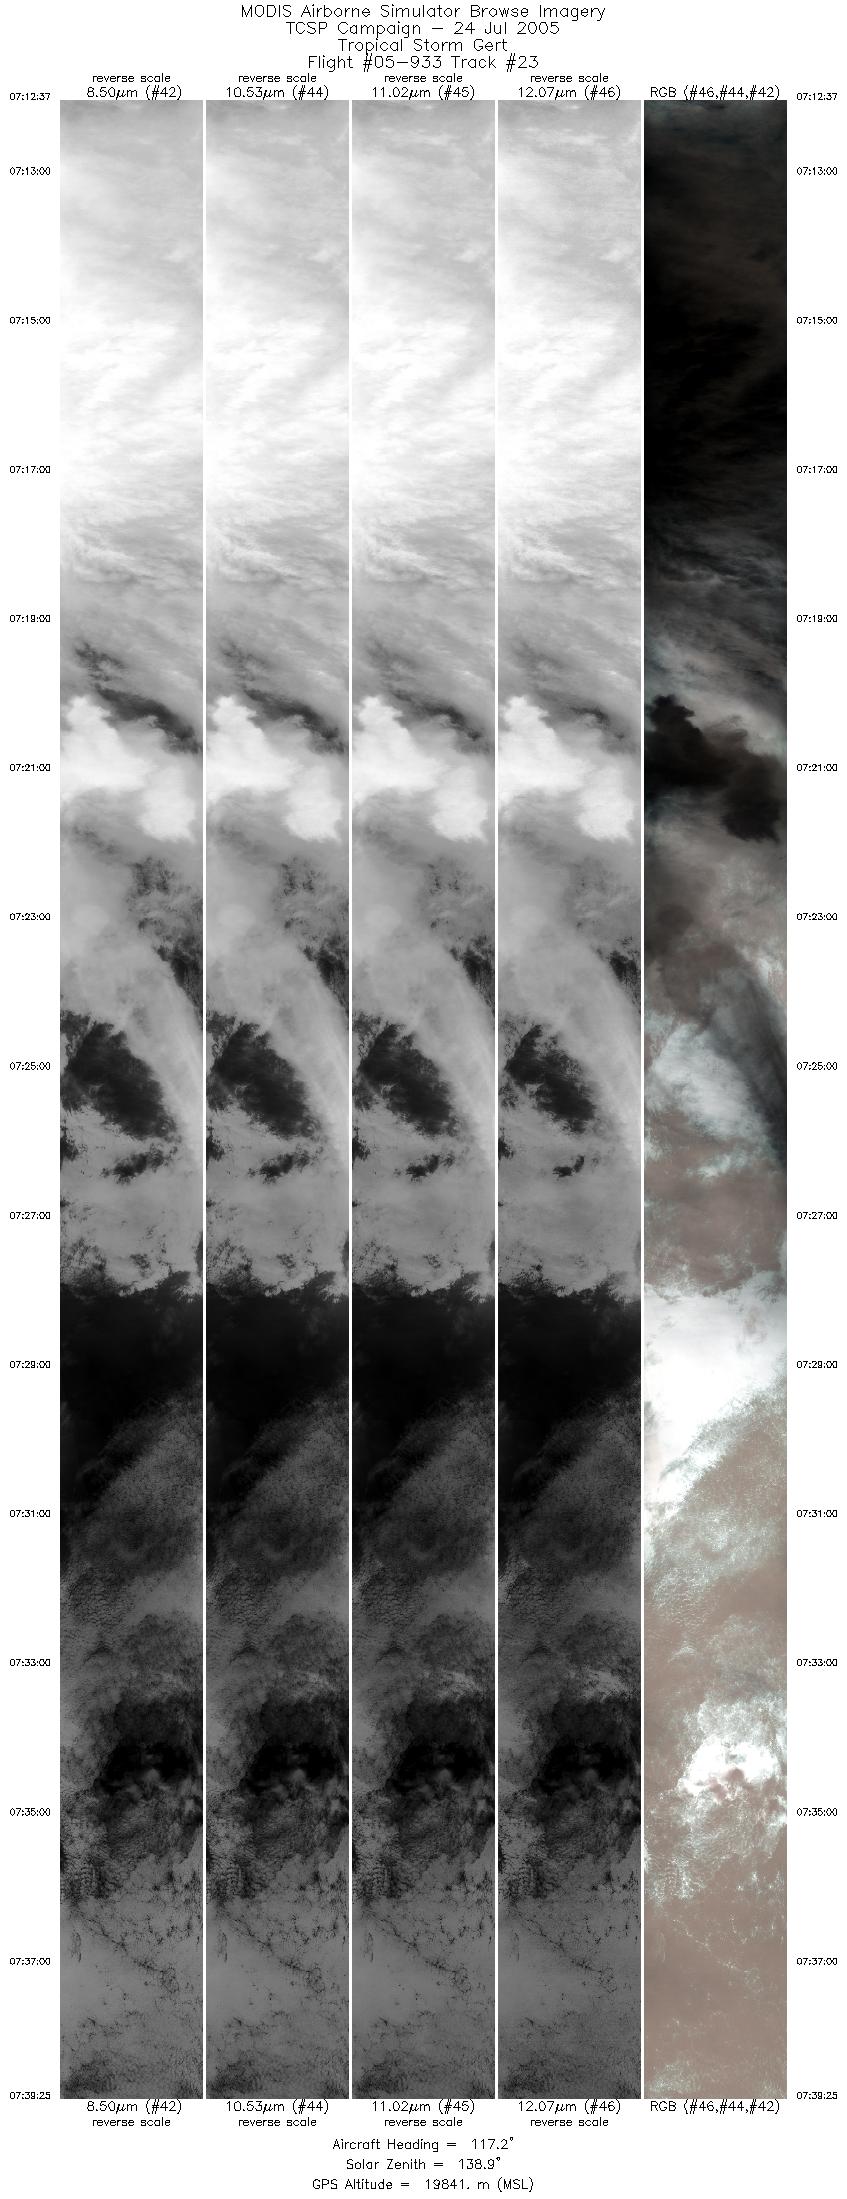
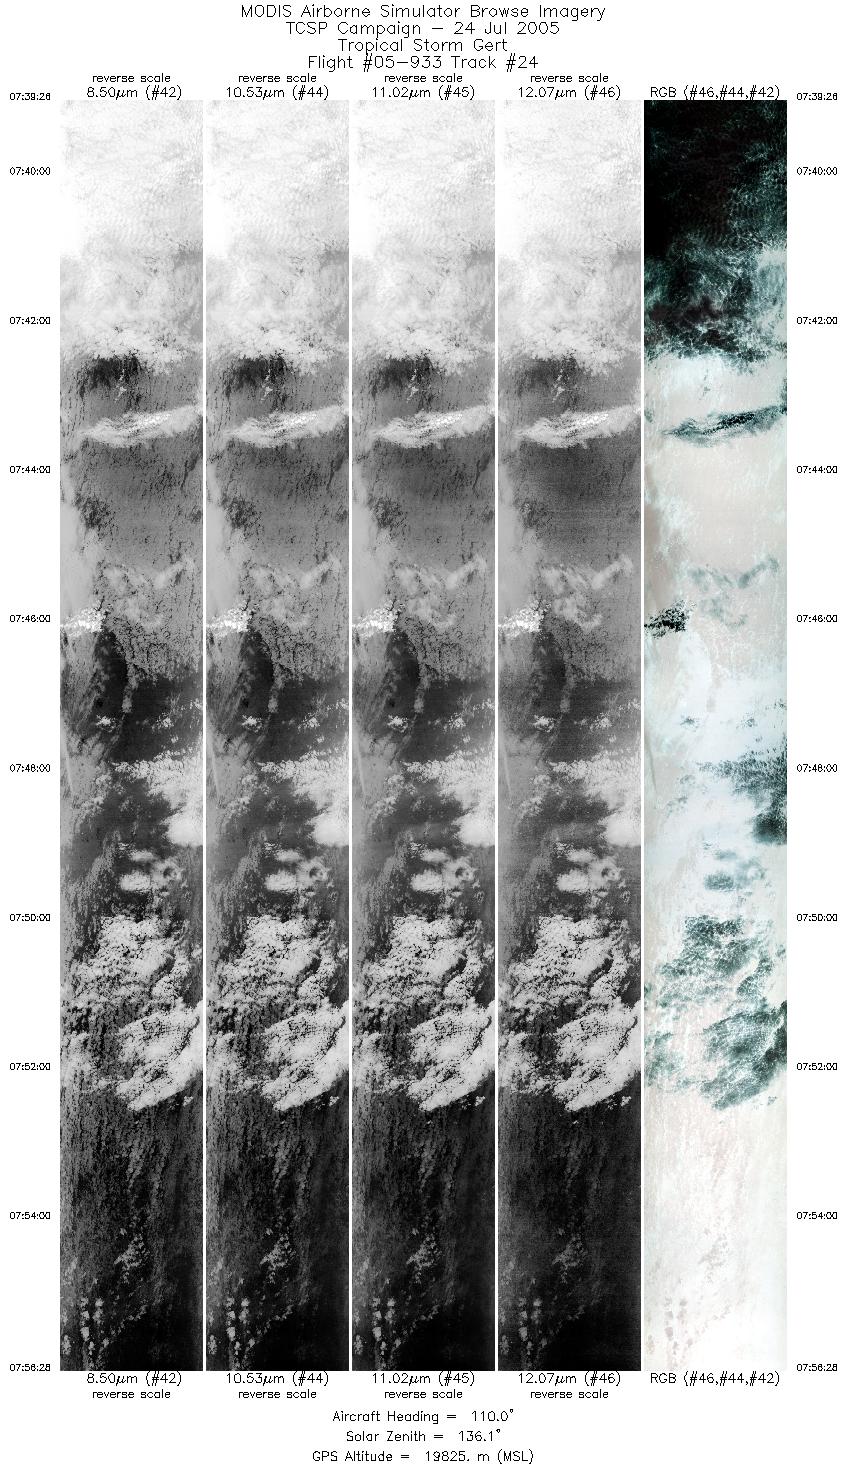
Track #14 Tropical Storm Gert (Gulf of Mexico) |


|
|
R: 10.54µm G: 8.54µm B: 4.56µm |
- NASA Official: Matt Fladeland
- Project Manager: James Jacobson
- Website Editor: Eric Fraim
- Last Updated: November 16, 2021


