


MODIS Airborne Simulator (MAS)
FLIGHT SUMMARY INFORMATION


|
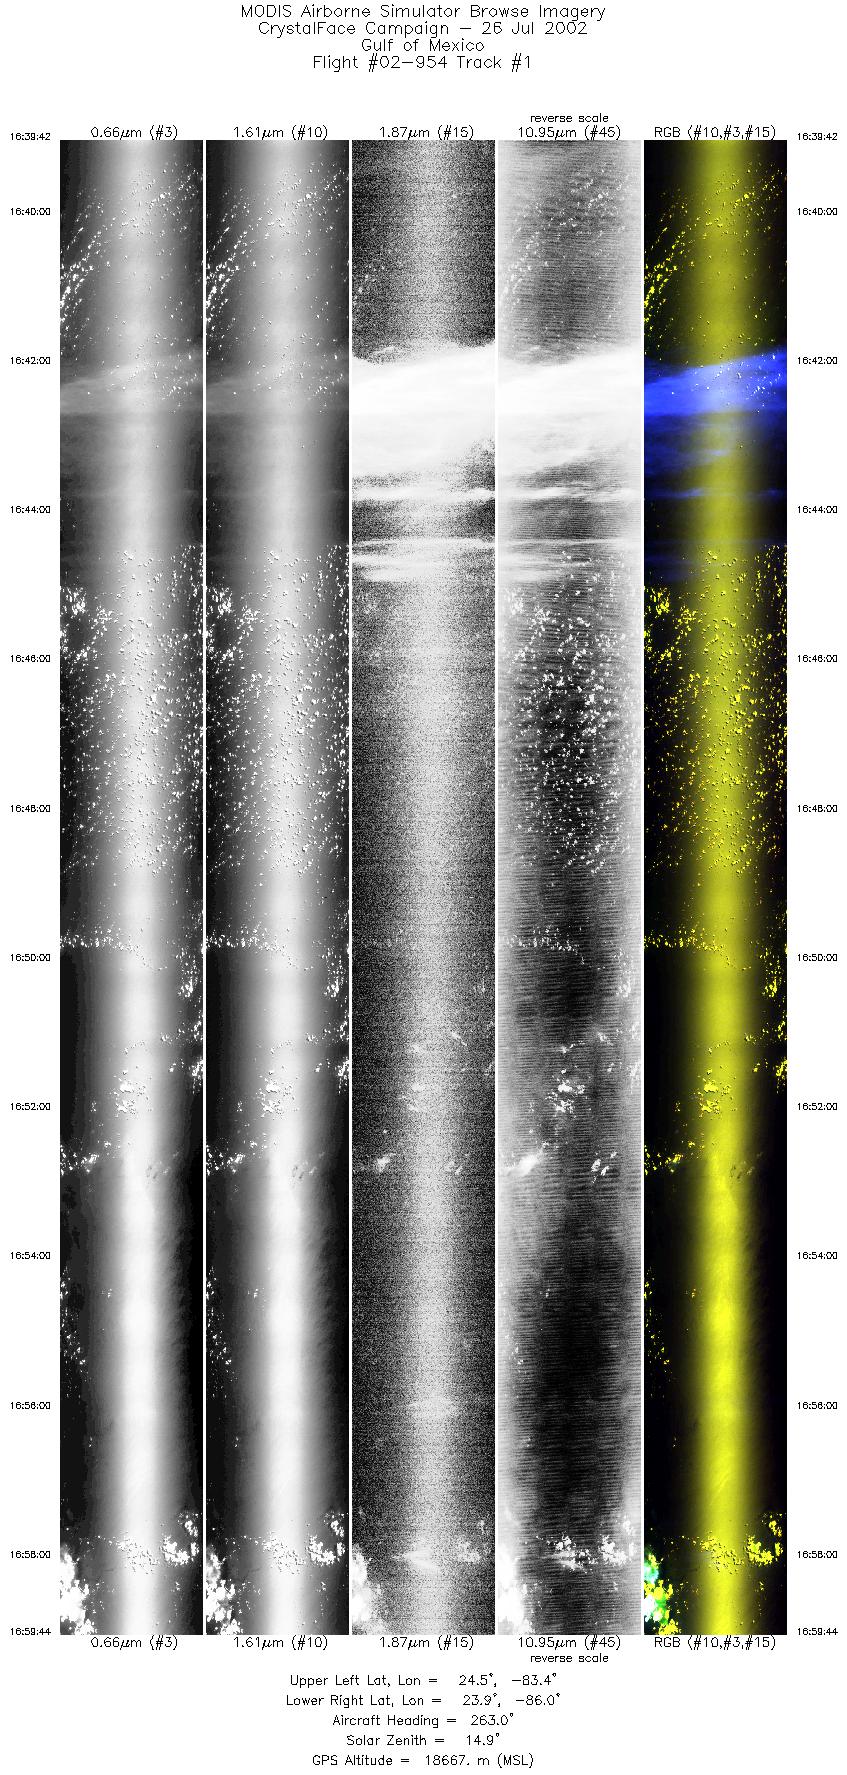
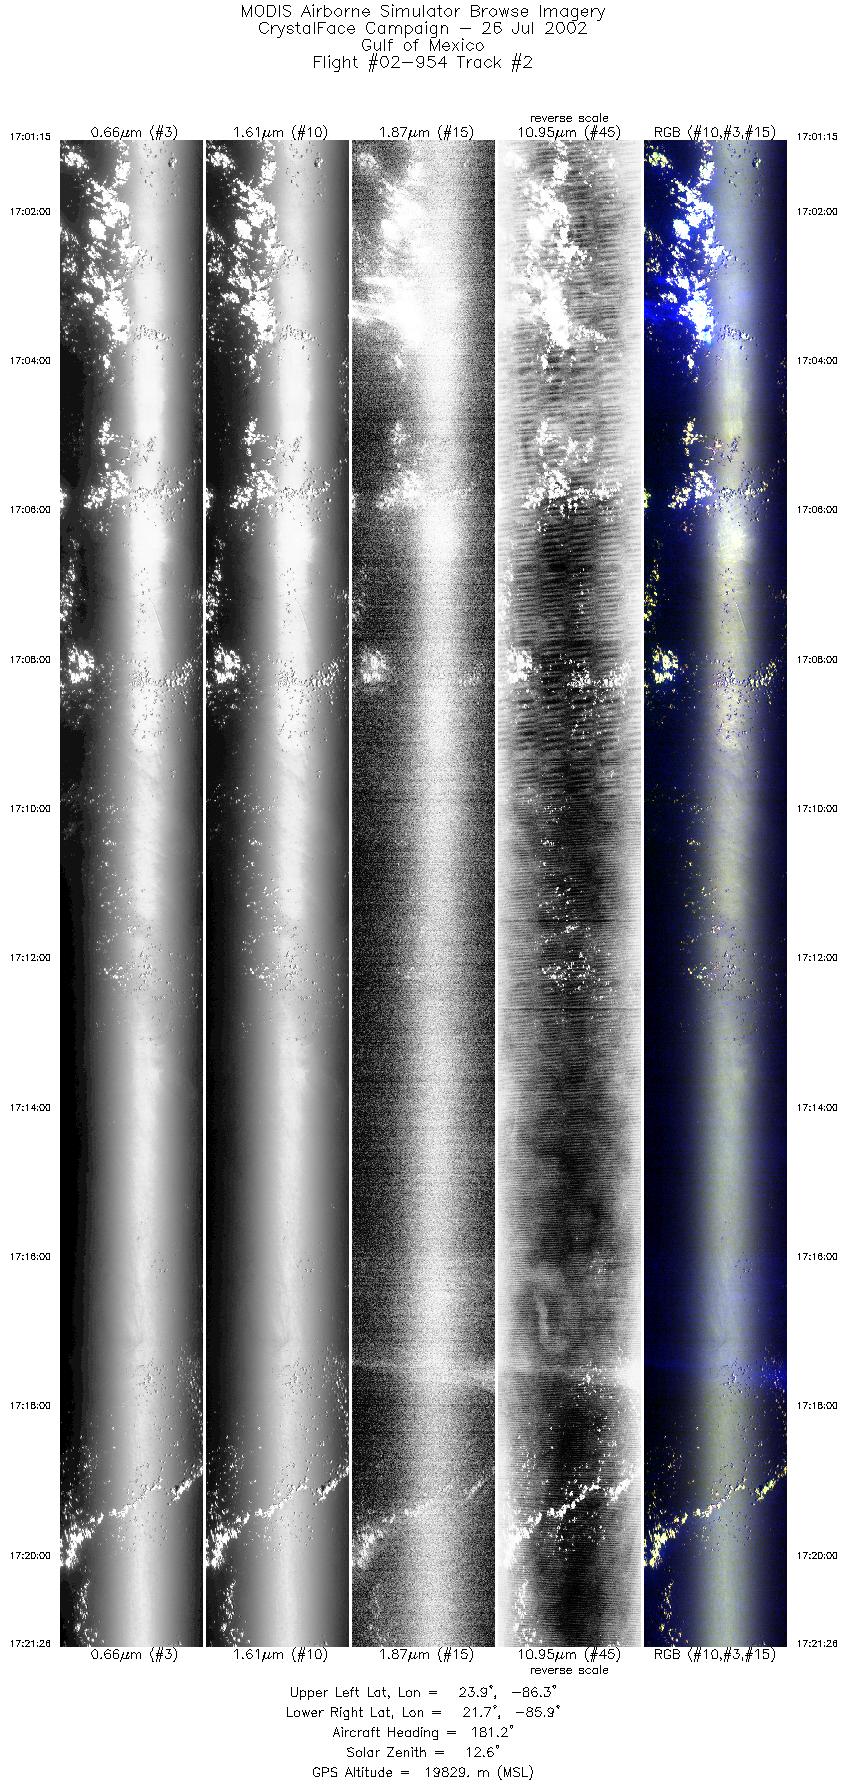
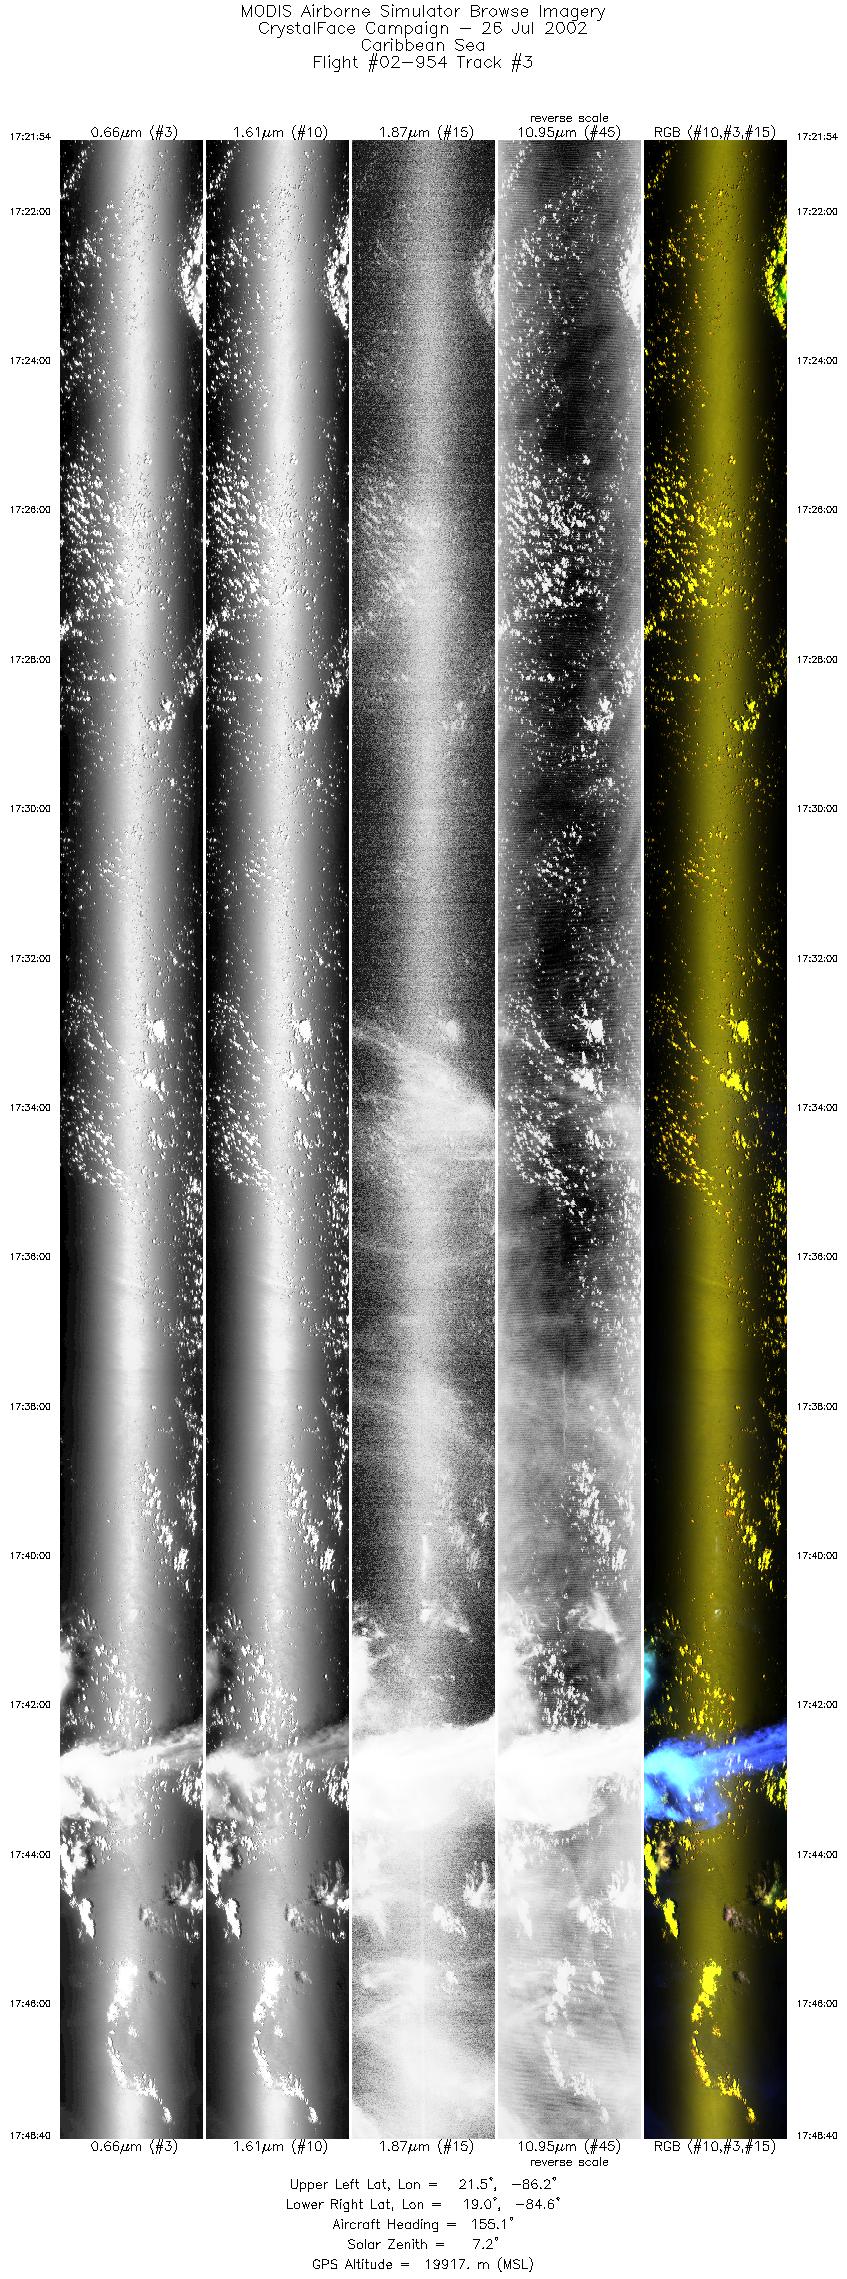
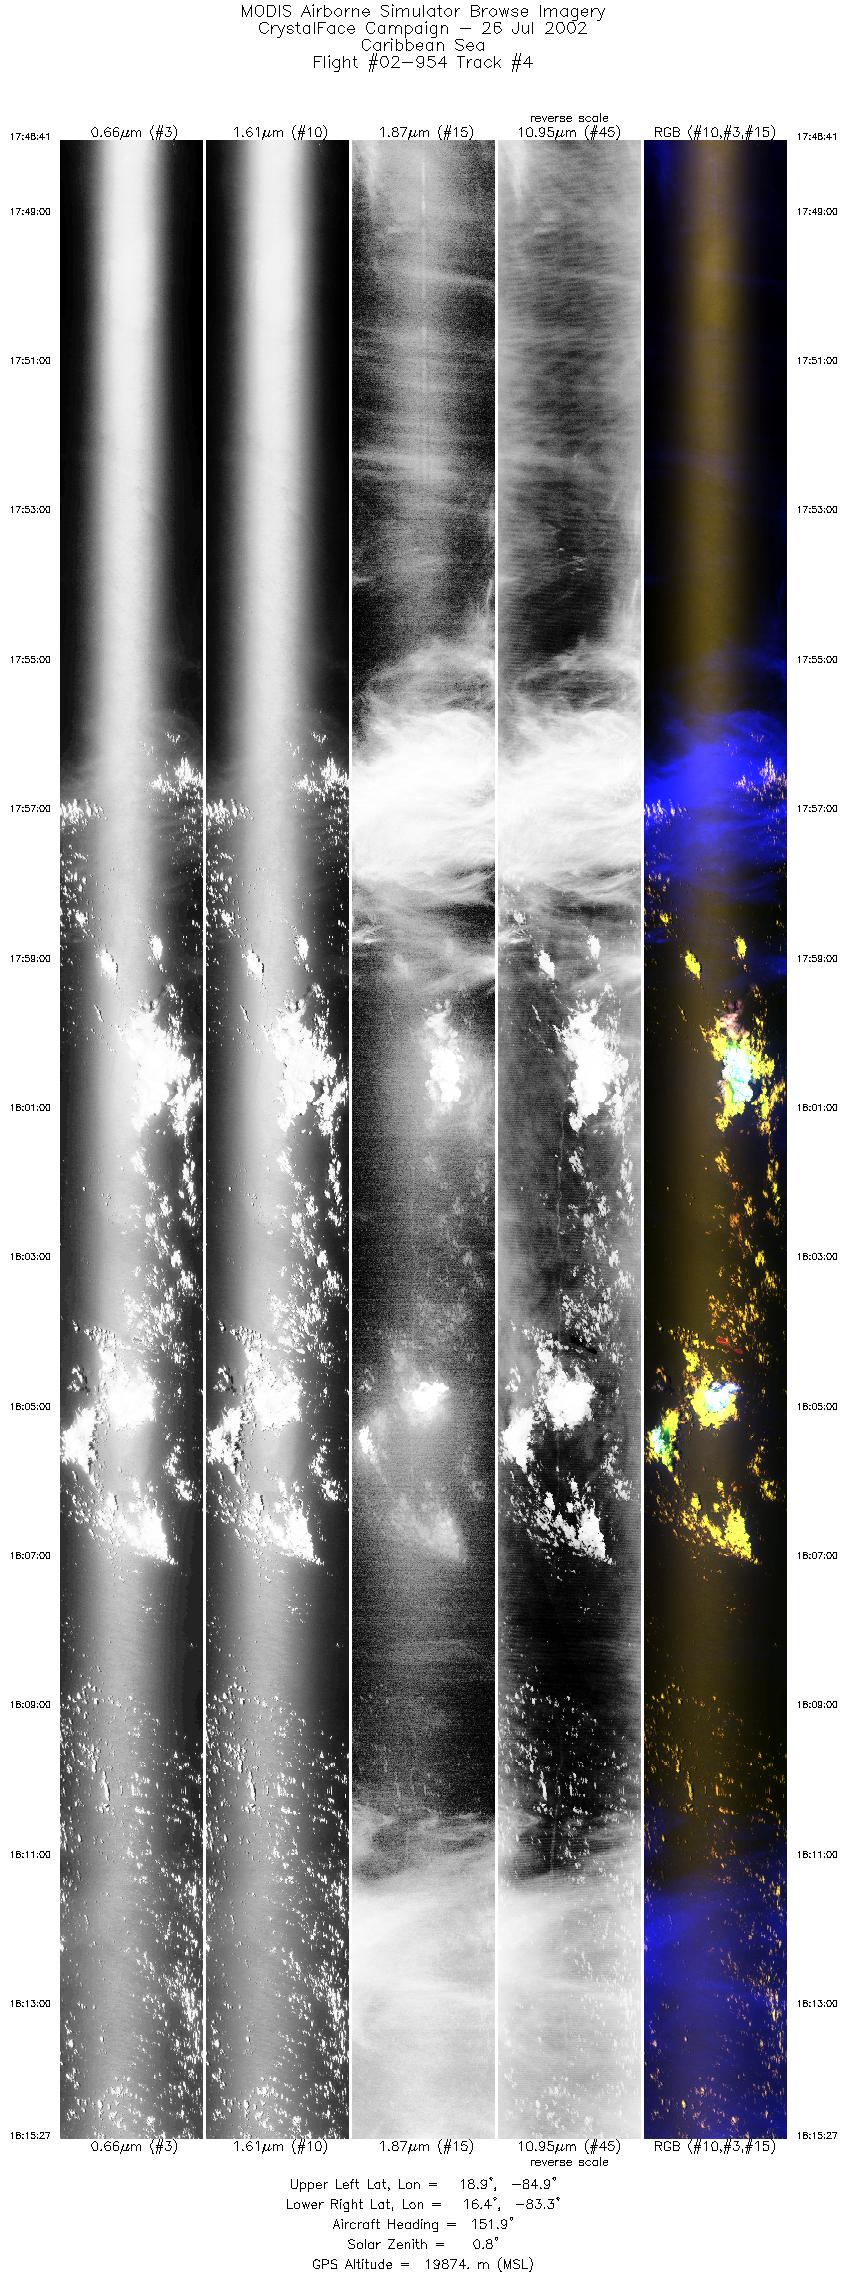
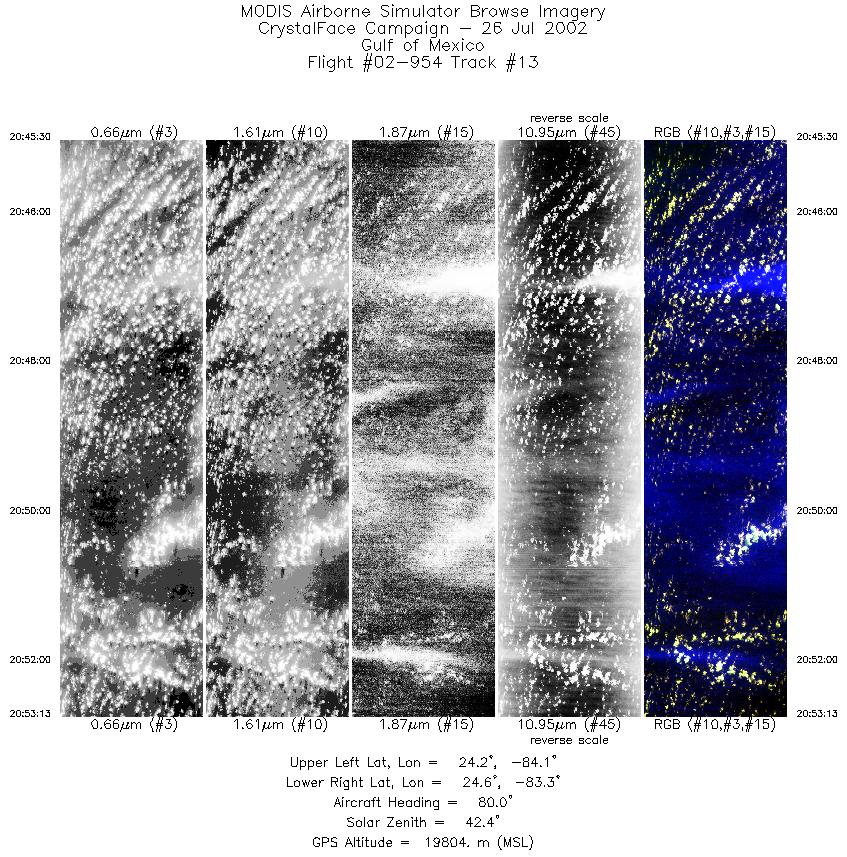
Flight: 02-954 Date: 26 July 2002 Location: Gulf of Mexico / Caribbean Sea Deployment: CRYSTAL-FACE Principal Investigators: Drs. Michael King & Steven Platnick (NASA GSFC) Additional Sensors: CoSSIR, CPL, CRS, Dropsondes, EDOP, JLH, MMS, MTP, RAMS, SSFR |
|||||||||||||||||||||||||||||||||||||||||||||||||||||||||||||||||||||||||||||||||||||||||||||||||||||||||||||||||||||||
|
Data Evaluation Overall quality is good AQUA Underflight @ 18:37 |
|||||||||||||||||||||||||||||||||||||||||||||||||||||||||||||||||||||||||||||||||||||||||||||||||||||||||||||||||||||||
|
Processing Information Level-1B Data in HDF format is available Flight Line Summary Spectral Band Configuration Spectral Response Function Table |
|||||||||||||||||||||||||||||||||||||||||||||||||||||||||||||||||||||||||||||||||||||||||||||||||||||||||||||||||||||||
|
Browse Imagery Flight Tracks: 13 Scanlines: 87415 |
|||||||||||||||||||||||||||||||||||||||||||||||||||||||||||||||||||||||||||||||||||||||||||||||||||||||||||||||||||||||
|
|||||||||||||||||||||||||||||||||||||||||||||||||||||||||||||||||||||||||||||||||||||||||||||||||||||||||||||||||||||||
|
|||||||||||||||||||||||||||||||||||||||||||||||||||||||||||||||||||||||||||||||||||||||||||||||||||||||||||||||||||||||
|
Flight Summary Report Mission Number: 9 Mission Scientists: M. King, P. Newman ER-2 Pilot: J. Barrilleaux Takeoff: 1615 (UTC) Landing: 2145 (UTC) Duration: 5:30 (h:mm) After climbing to altitude, the ER-2 proceeded to waypoint A (21° 38´ N, 86° 04´ W), where it joined up with the WB-57F. The plane continued on a heading towards the SSE parallel to the AUQA overpass that occurred at 1837 UTC. The separation distance between the ER-2 ground track and the AQUA ground track was approximately 484 km at the time of the satellite overpass. The ER-2 proceeded to the SSE and turned around near the east coast of Honduras. Dropsondes were released approximately every few degrees on the southbound leg. The 07/26/2002 12Z sonde at San Andres Island (12.6°N and 81.0°W) showed 200 hPa (39 kft) winds of 15 kts from the SSE. By 1600, strong convection had developed over Nicaragua, with cirrus blow-off being carried towards the NE away from the land. The ER-2 and WB-57F remained relatively close together during the flight. At approximately 1810, the lidar on the ER-2 began to observe the thick layer of cirrus (13-16 km) that was blowing off of the Nicaraguan convection. This layer was continuously observed on this southbound leg. The WB-57F briefly sampled the cirrus of this same cloud. At about 1845, the ER-2 reversed course, continuing to sample this cirrus layer until about 1910 (approximately NE of Honduras). In addition to the cirrus layer, a layer of what is presumed to be Saharan dust was seen between the surface and 4 km again to the NE of Honduras. The aircraft mainly observed clear air with occasional patches of cirrus on the remainder of the flight. Satellite & Ground Site InformationAQUA Overpass @ 1837 (UTC); VZA = 34.70° (relative to eastern site)
Western Site: PARSL, Everglades National Park, Gulf Coast Visitor's Center
|
|||||||||||||||||||||||||||||||||||||||||||||||||||||||||||||||||||||||||||||||||||||||||||||||||||||||||||||||||||||||

Flight 02-954


| Sample Imagery |
| Click image for full resolution |
|
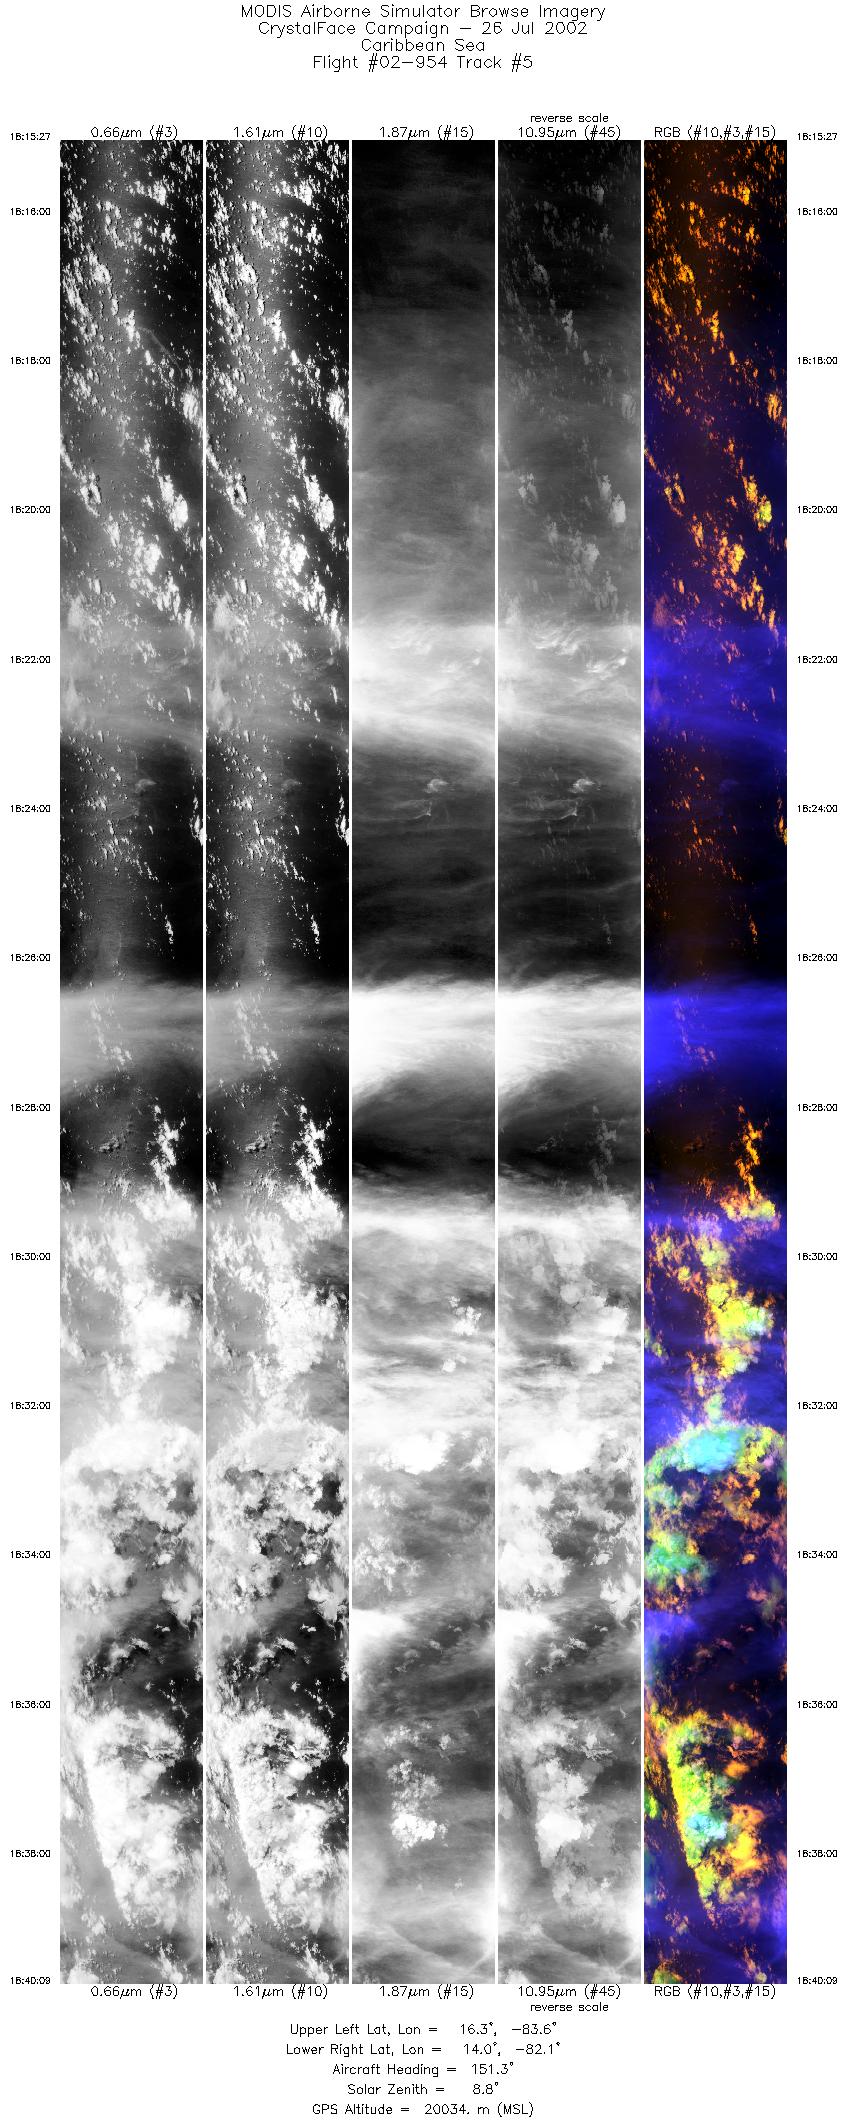
Track #05 Southern Florida |


|
|
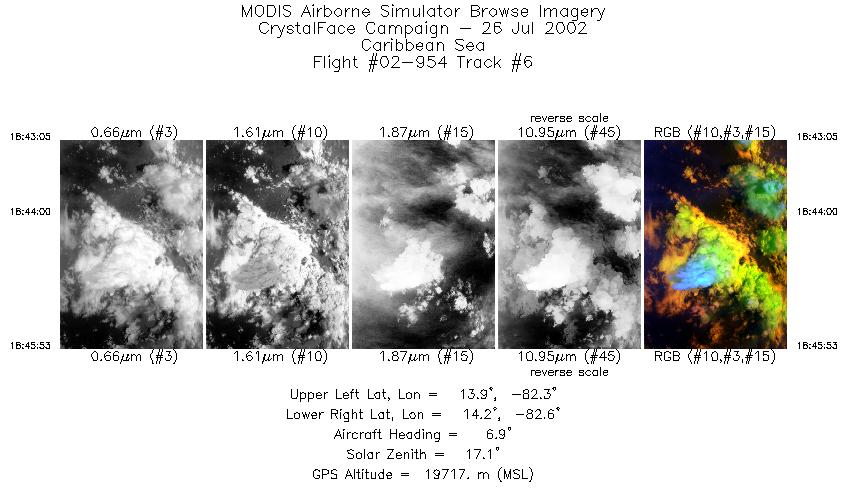
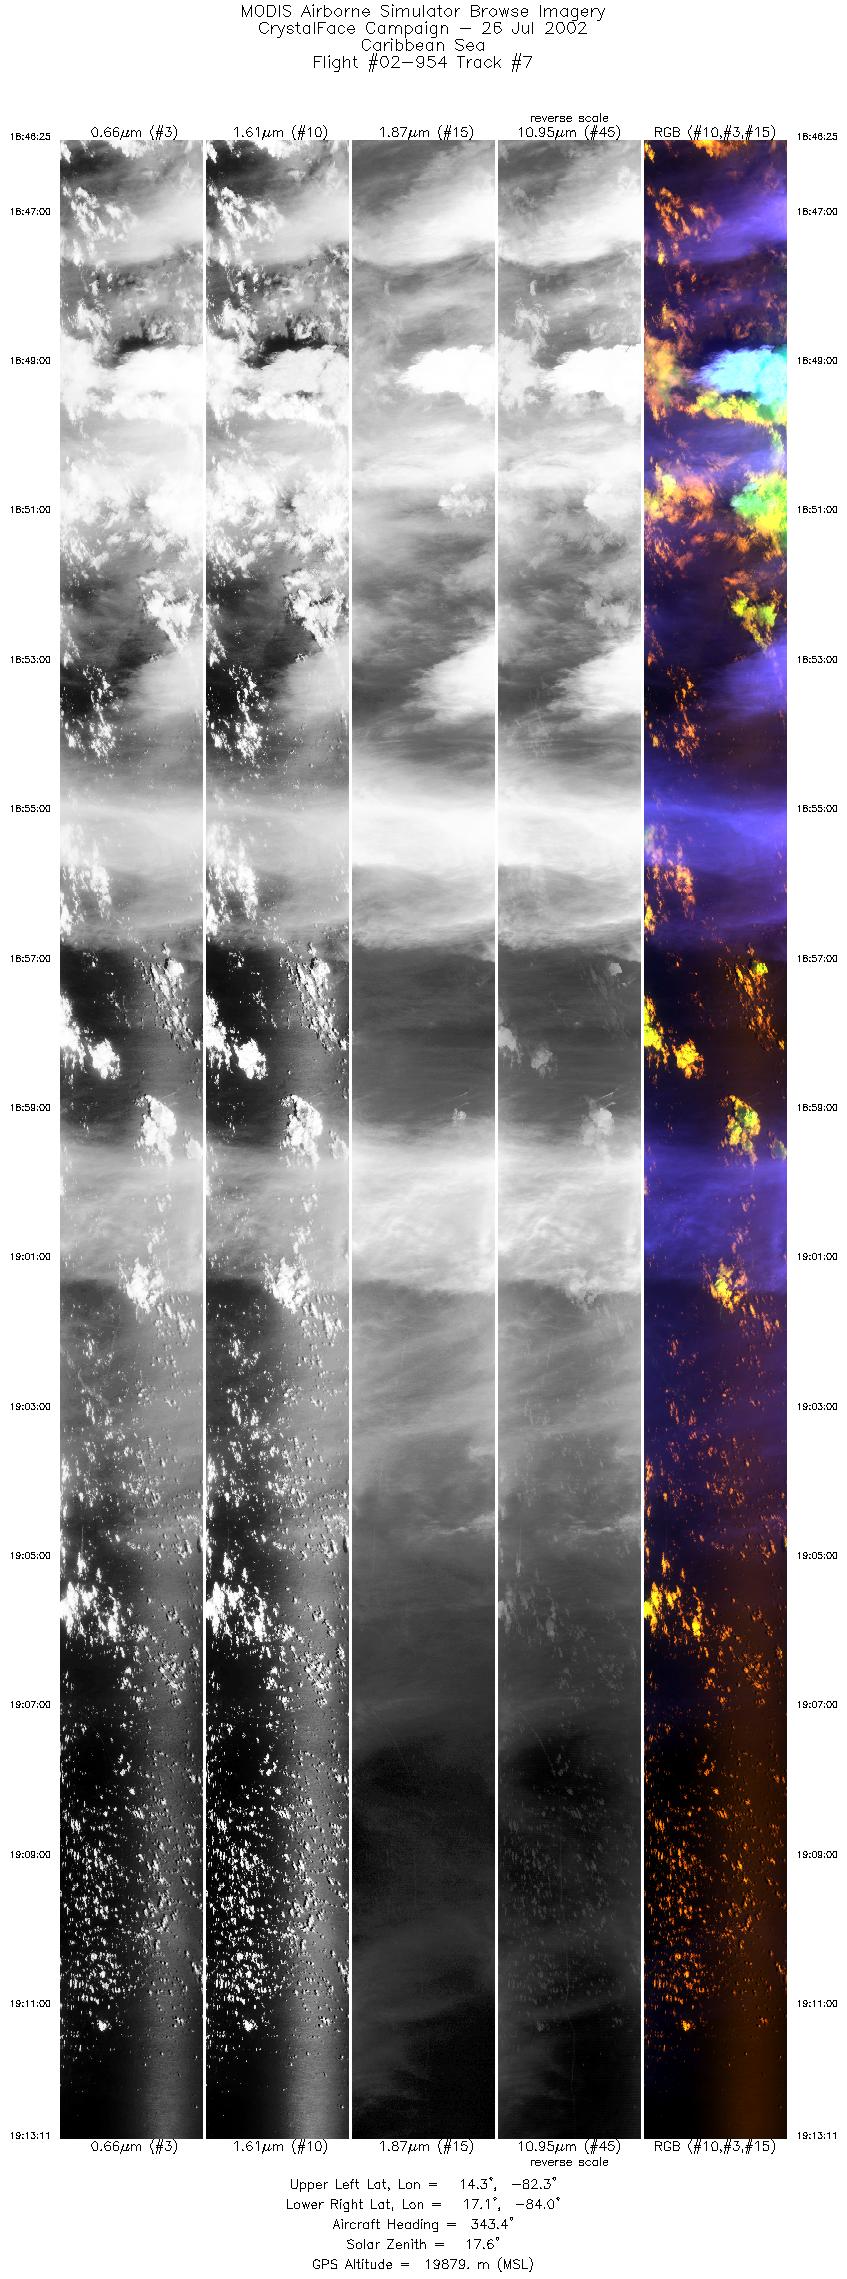
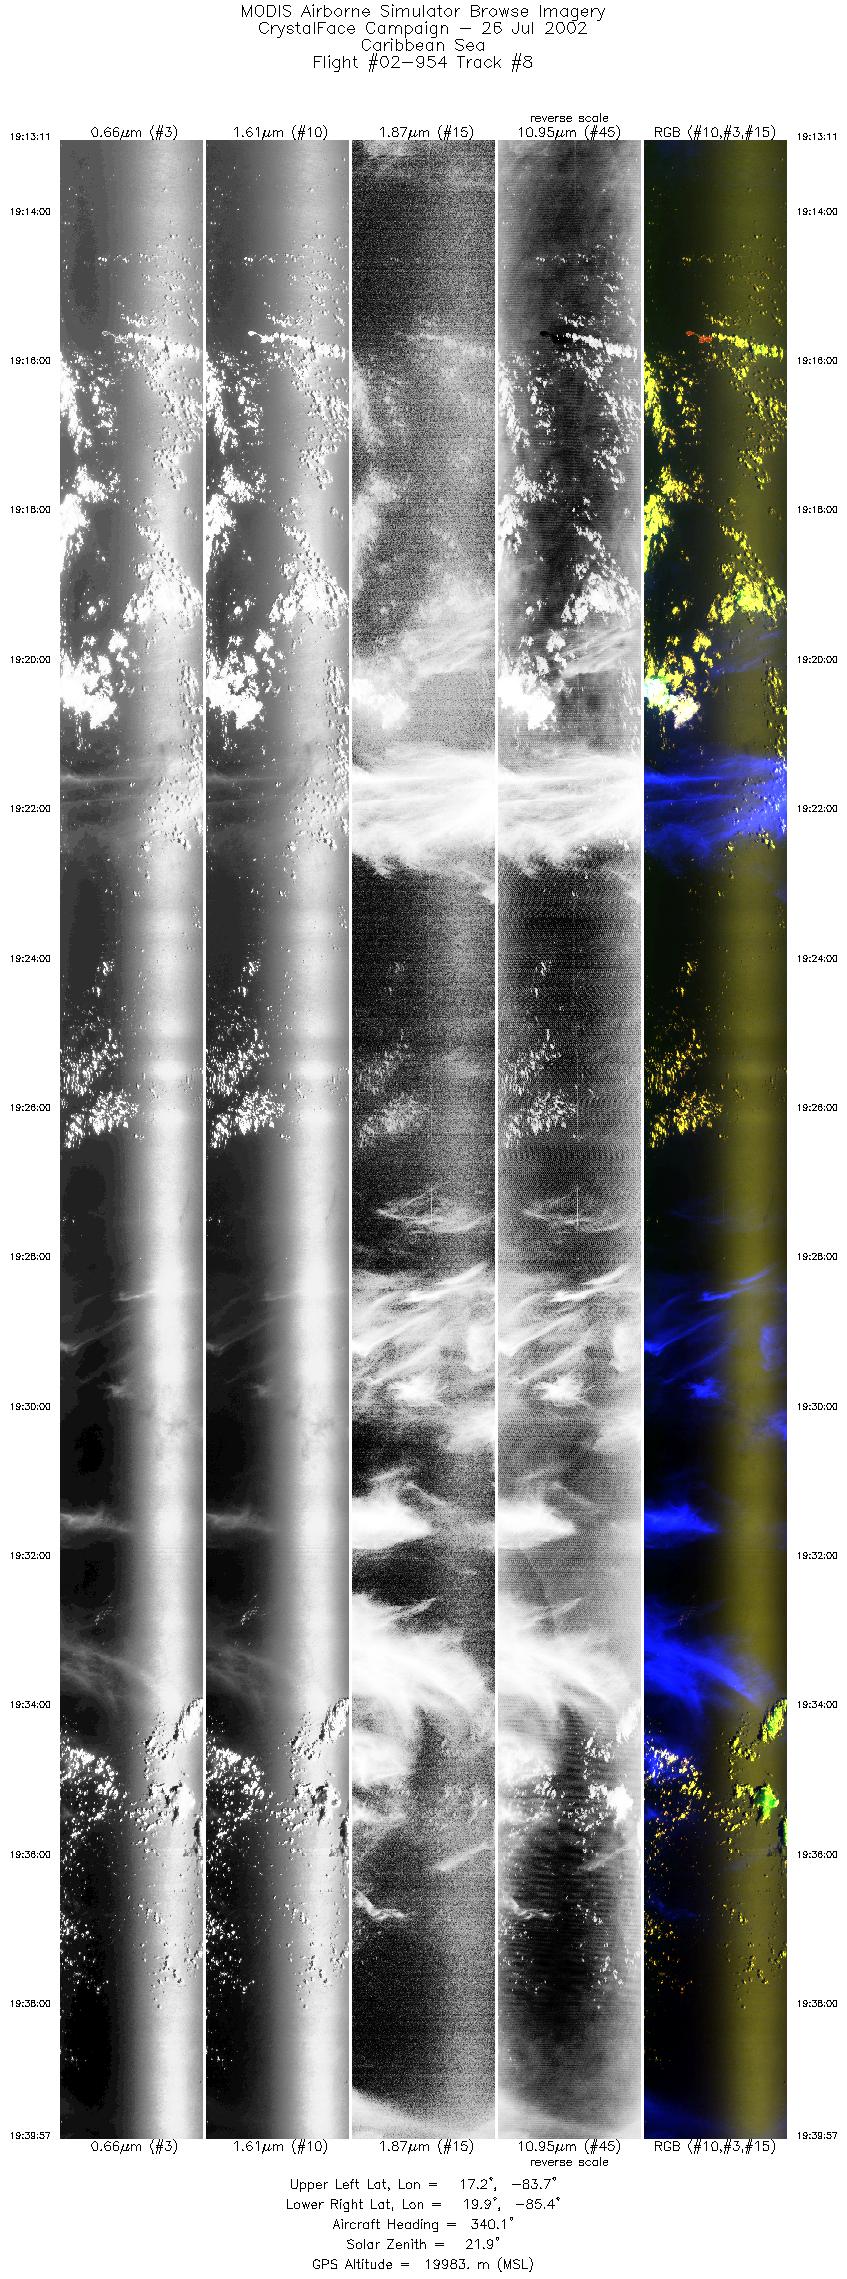
R: 1.64µm G: 0.66µm B: 1.90µm |
- NASA Official: Matt Fladeland
- Project Manager: James Jacobson
- Website Editor: Eric Fraim
- Last Updated: November 16, 2021


