


MODIS Airborne Simulator (MAS)
FLIGHT SUMMARY INFORMATION


|
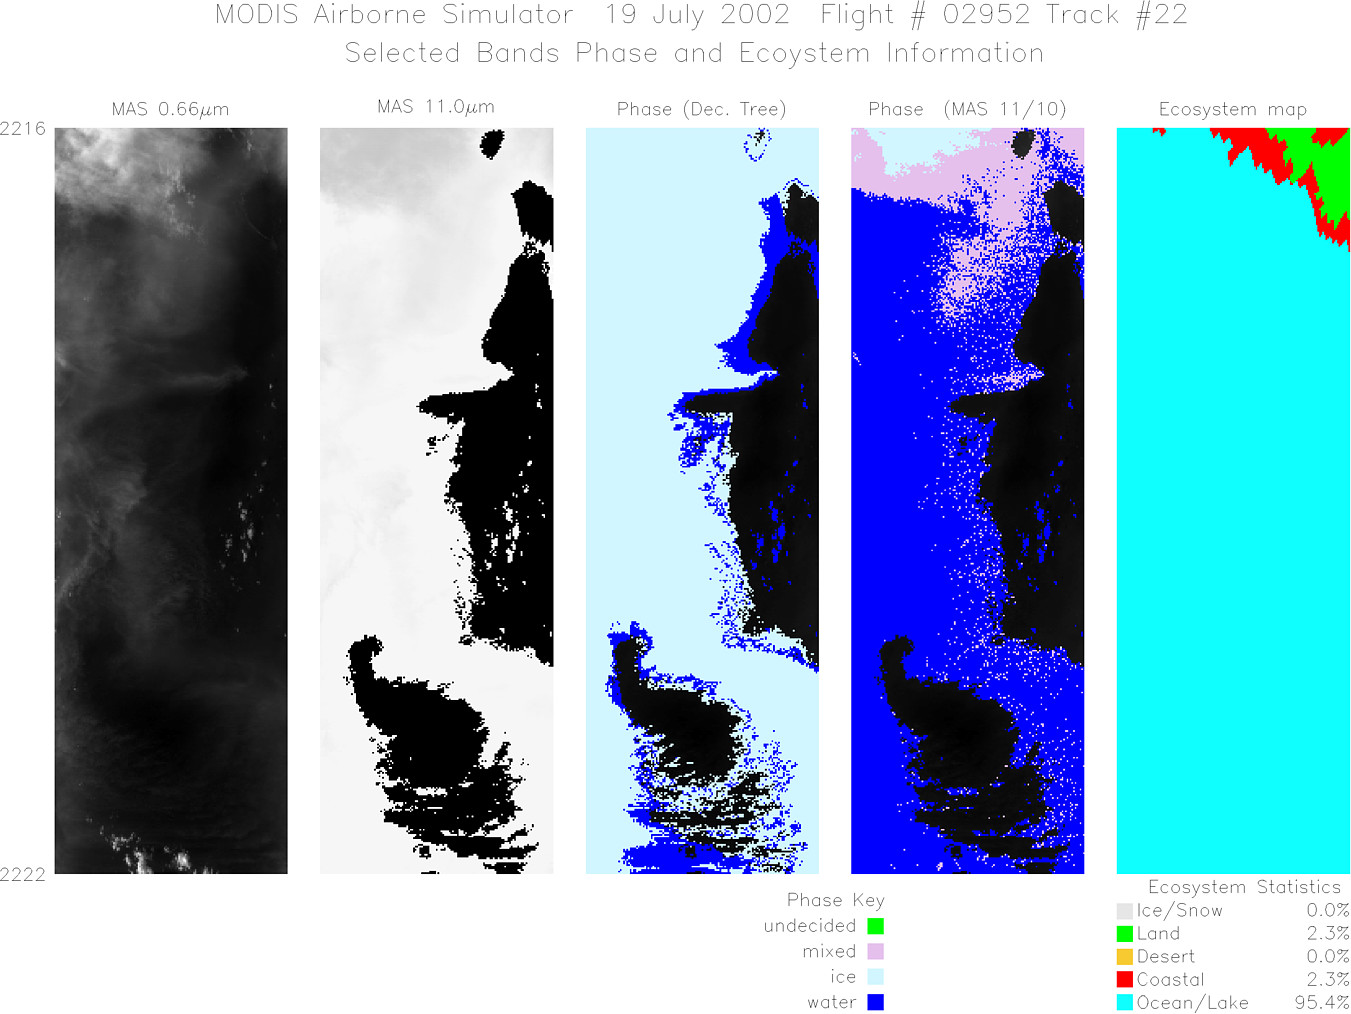
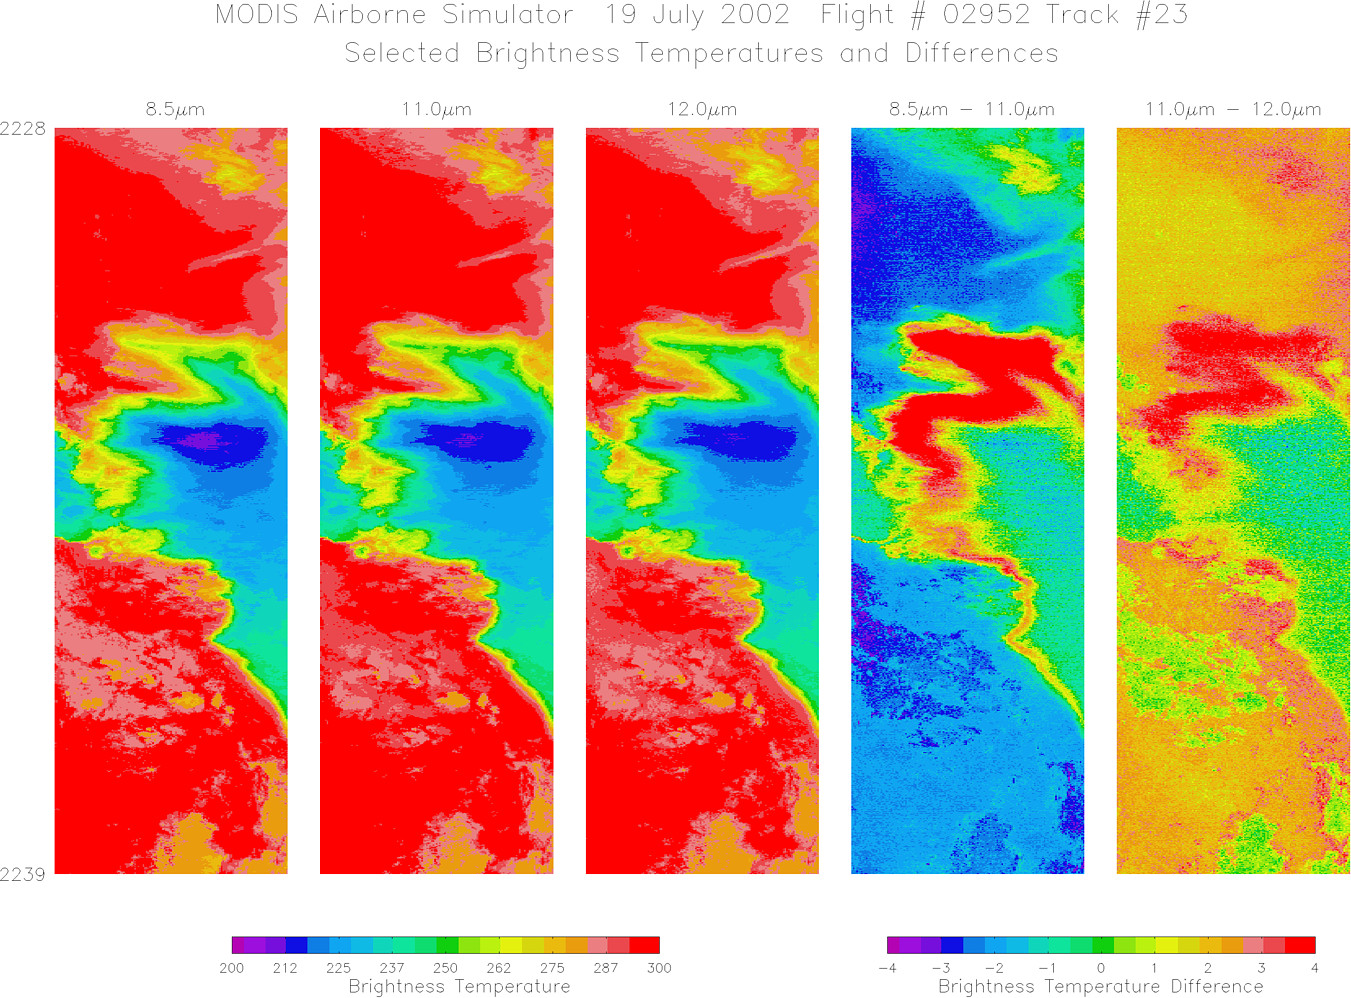
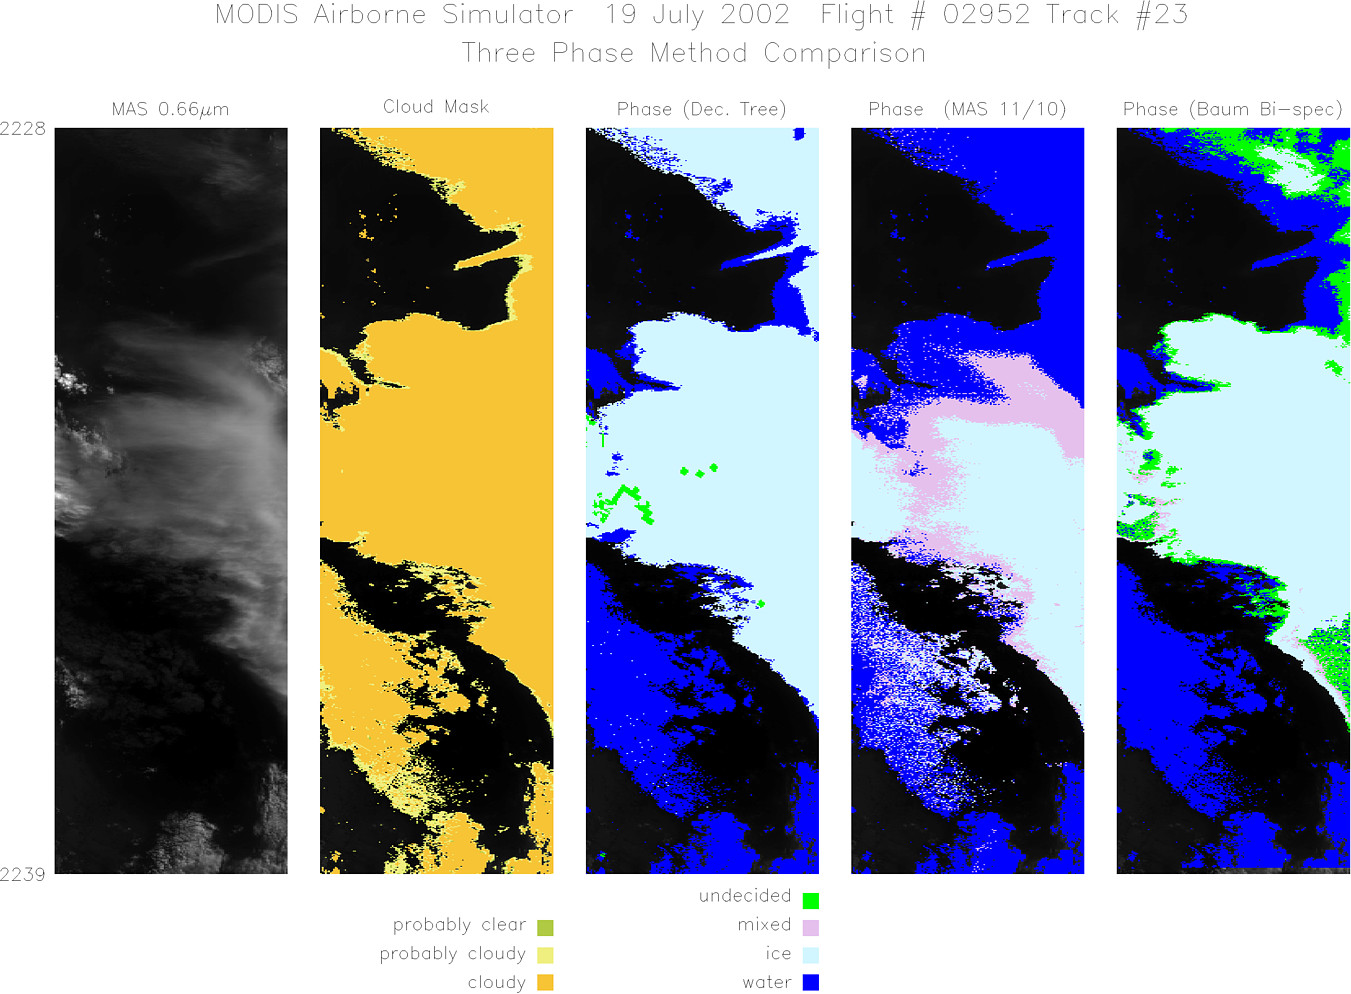
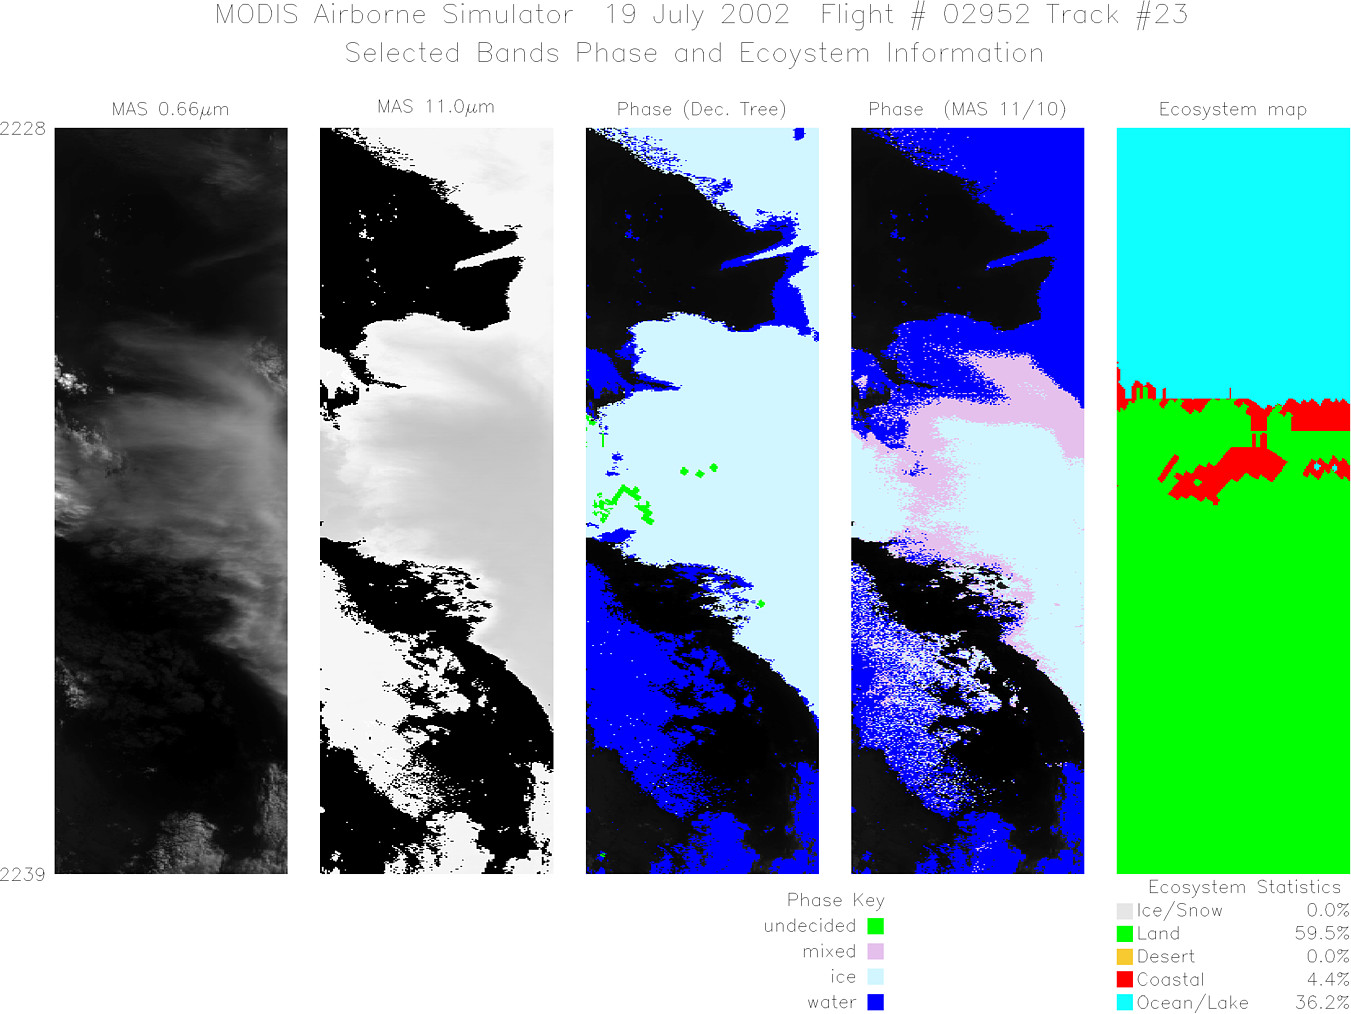
Flight: 02-952 Date: 19 July 2002 Location: Gulf of Mexico / Florida / Atlantic Ocean Deployment: CRYSTAL-FACE Principal Investigators: Drs. Michael King & Steven Platnick (NASA GSFC) Additional Sensors: CoSSIR, CPL, CRS, Dropsondes, EDOP, JLH, MMS, MTP, RAMS, SSFR |
|||||||||||||||||||||||||||||||||||||||||||||||||||||||||||||||||||||||||||||||||||||||||||||||||||||||||||||||||||||||||||||||||||||||||||||||||||||||||||||||||||||||||||||||||||||||||||||||||||||||||||
|
Data Evaluation Overall quality is good AQUA Underflight @ 18:34 TERRA Underflight @ 17:04 TRMM Underflight @ 20:13 |
|||||||||||||||||||||||||||||||||||||||||||||||||||||||||||||||||||||||||||||||||||||||||||||||||||||||||||||||||||||||||||||||||||||||||||||||||||||||||||||||||||||||||||||||||||||||||||||||||||||||||||
|
Processing Information Level-1B Data in HDF format is available Flight Line Summary Spectral Band Configuration Spectral Response Function Table |
|||||||||||||||||||||||||||||||||||||||||||||||||||||||||||||||||||||||||||||||||||||||||||||||||||||||||||||||||||||||||||||||||||||||||||||||||||||||||||||||||||||||||||||||||||||||||||||||||||||||||||
|
Browse Imagery Flight Tracks: 25 Scanlines: 91909 |
|||||||||||||||||||||||||||||||||||||||||||||||||||||||||||||||||||||||||||||||||||||||||||||||||||||||||||||||||||||||||||||||||||||||||||||||||||||||||||||||||||||||||||||||||||||||||||||||||||||||||||
|
|||||||||||||||||||||||||||||||||||||||||||||||||||||||||||||||||||||||||||||||||||||||||||||||||||||||||||||||||||||||||||||||||||||||||||||||||||||||||||||||||||||||||||||||||||||||||||||||||||||||||||
|
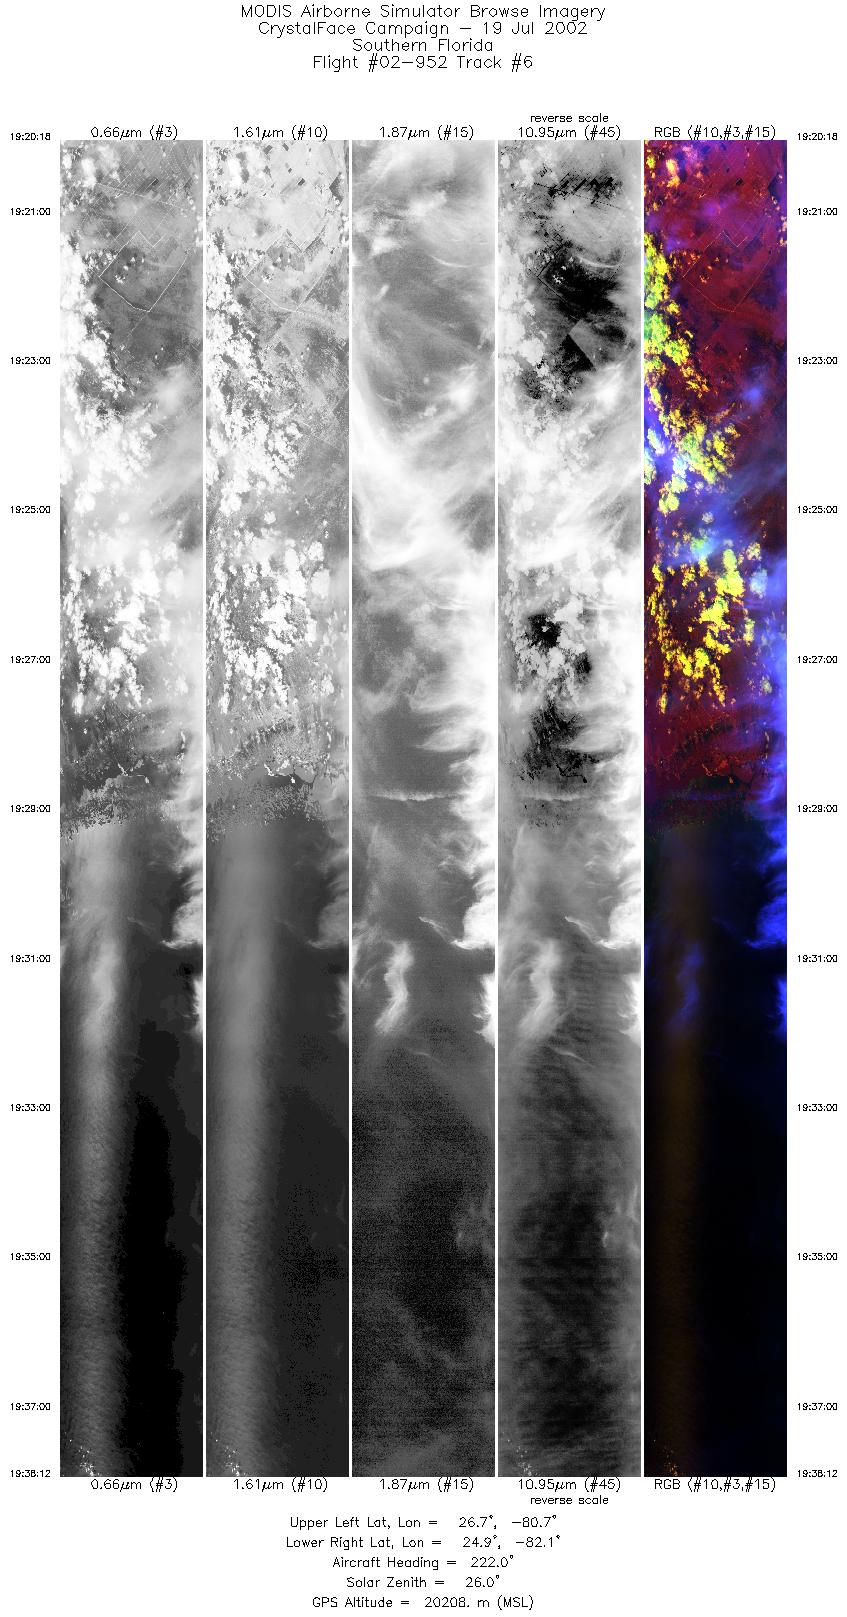
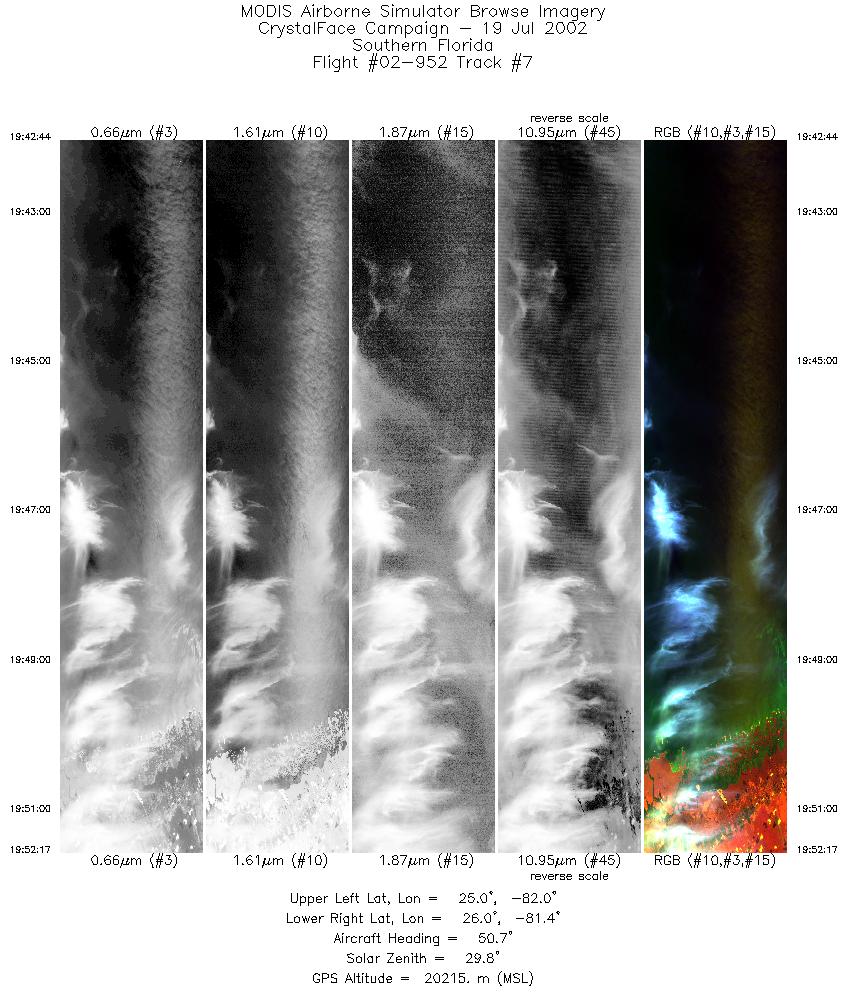
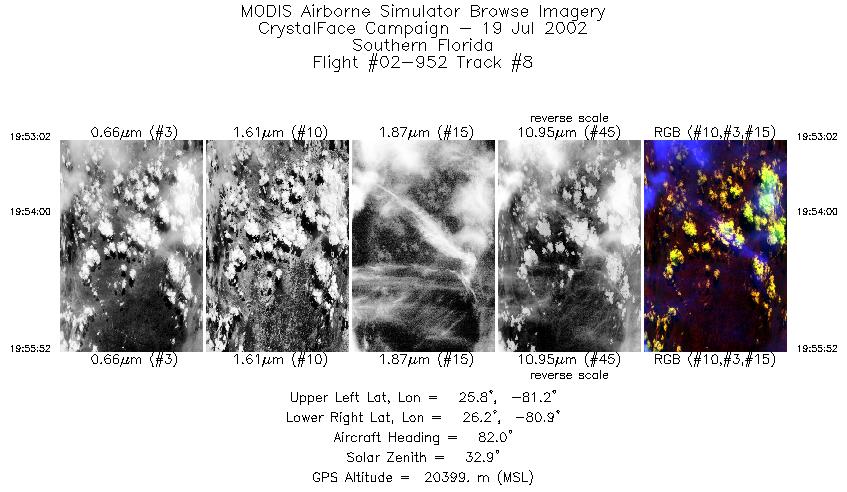
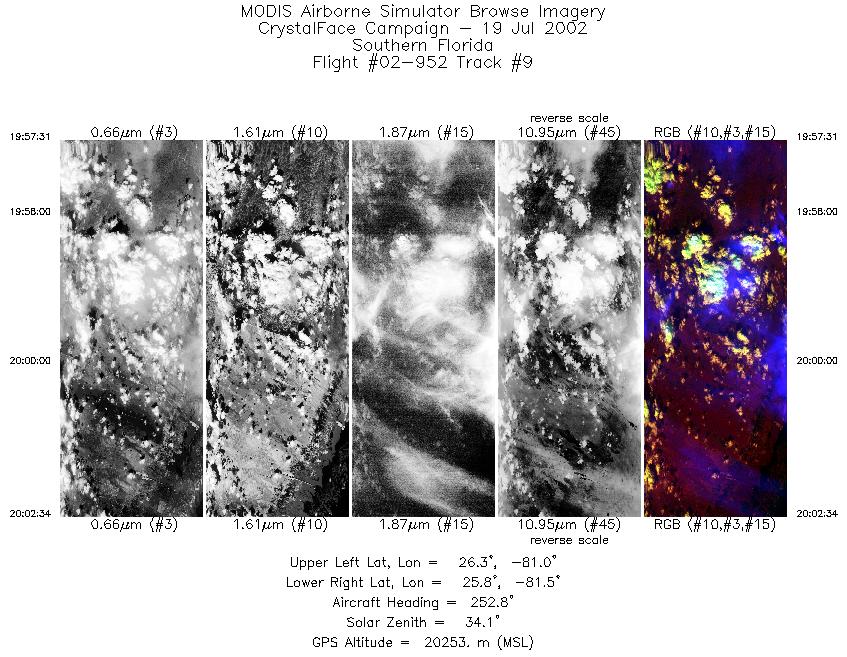
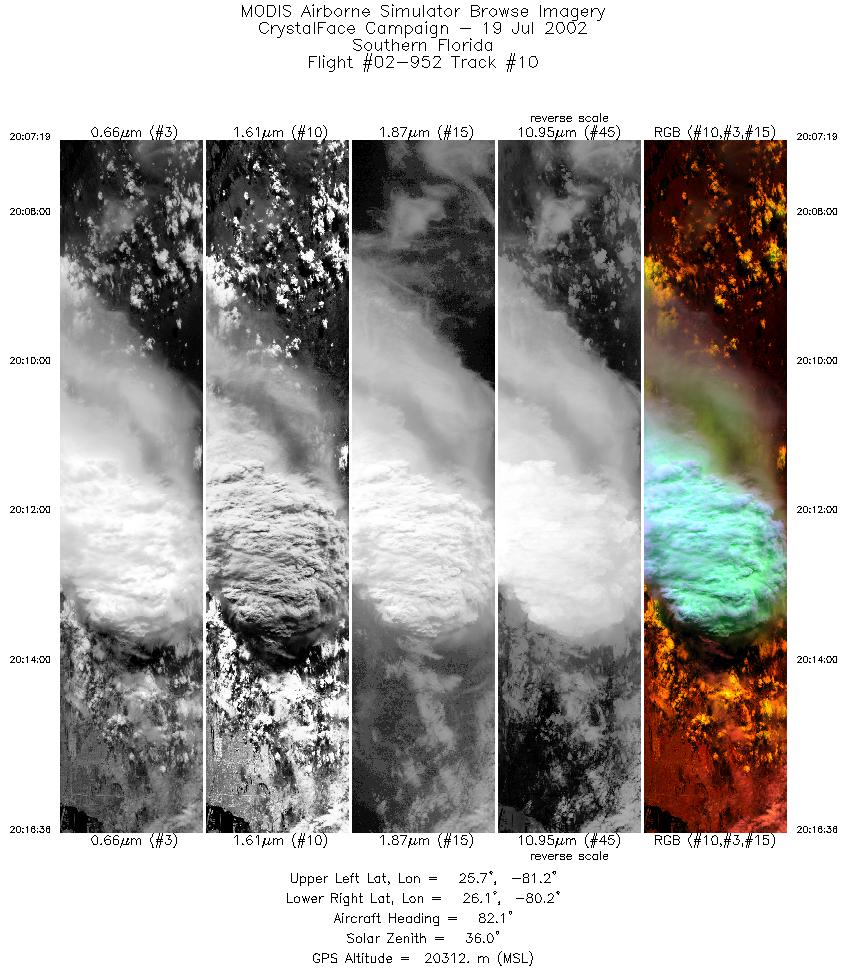
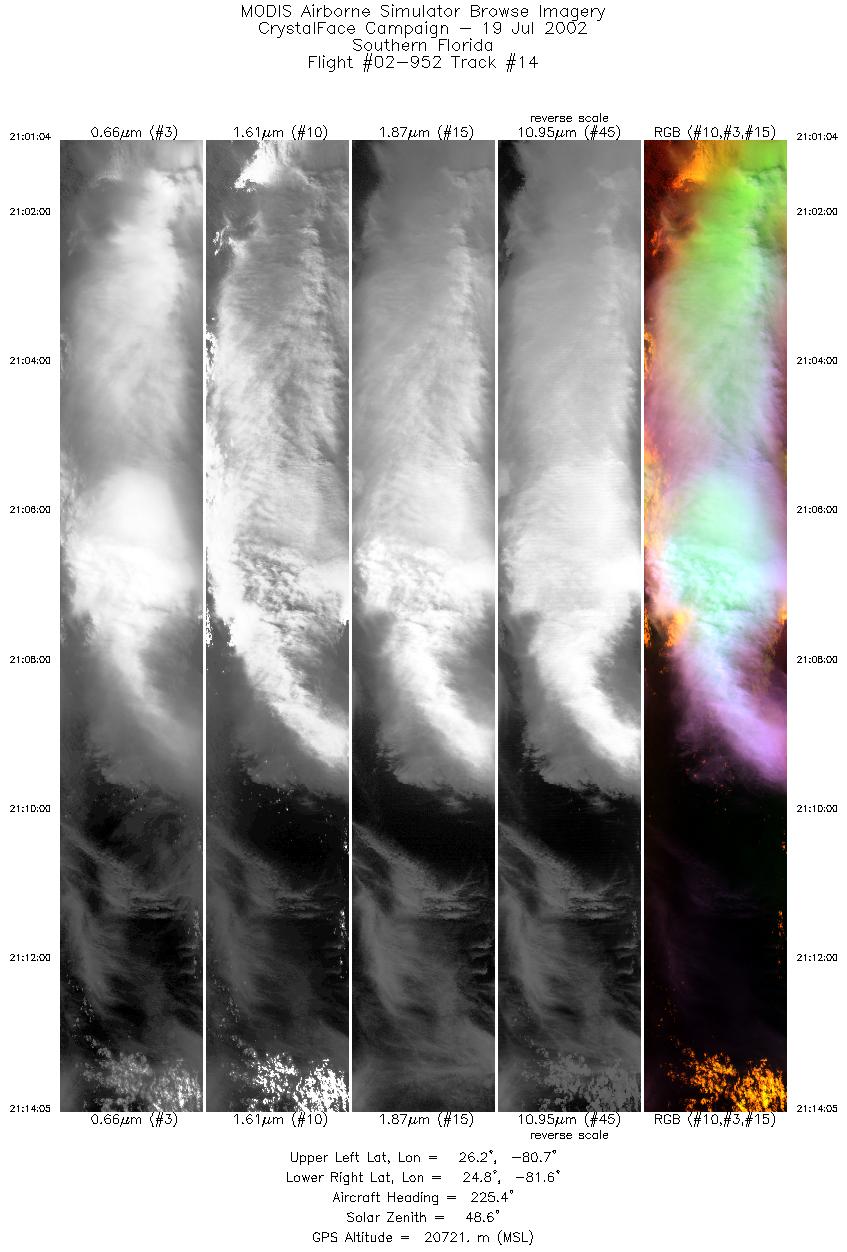
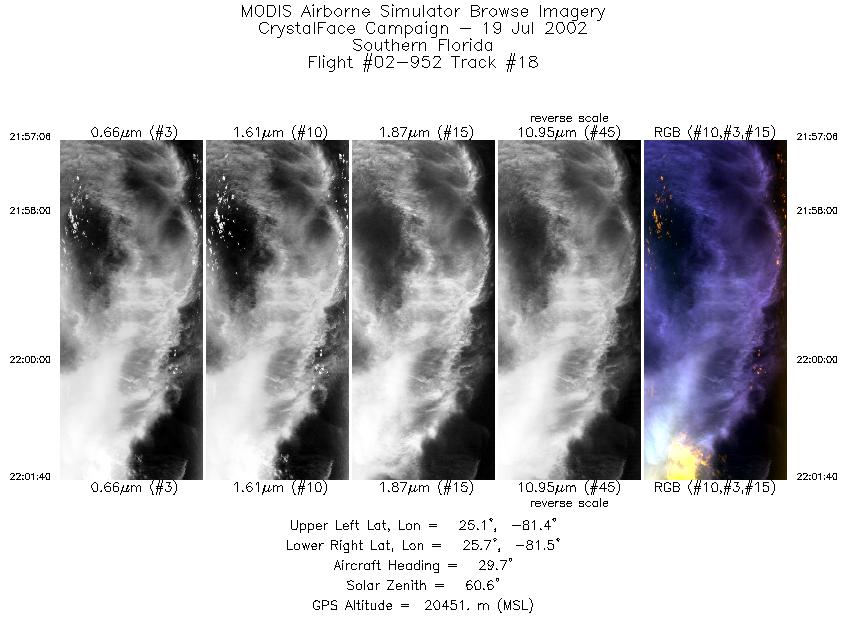
Flight Summary Report Mission Number: 7 Mission Scientists: M. King, P. Newman ER-2 Pilot: J. Barrilleaux Takeoff: 1700 (UTC) Landing: 2335 (UTC) Duration: 6:35 (h:mm) After climbing to altitude, the ER-2 proceeded to waypoint A (25° 05´ N, 82° 13´ W) and flew over the western ground site en route to the NE towards waypoint B (26° 41´ N, 80° 26´ W) and beyond to the Atlantic coast. NPOL re-directed the ER-2 into a number of shortened flight lines oriented roughly SW-NE parallel to the A-B track but to the south over the Everglades. These tracks coincided with a convective cloud complex overflown by TRMM at 2013 UTC. One dropsonde was pickled into cirrus over the western Atlantic at 27° 20´ N, 79° 46´ W at 1811 UTC to support Proteus overflights of a flight track at the time of the AQUA overpass (1834 UTC). Four additional dropsondes were released over the Gulf of Mexico. At 1700 UT strong NE flow @ 100-200 hPa was moving blow-off from Atlantic convection into Florida along a 100 nm stretch centered on Palm Beach. Convection in the Miami region decreased over the period from 1700-1830 as the ER-2 flew the AQUA satellite track from the SW to the NE. At 1930, a 50 nm long line of convection developed that was oriented roughly SW to NE cutting across the Tamiami Trail. This convection built over the period 1830 to 2030. The cirrus blow off from this system was then carried approximately westward. Satellite & Ground Site Information
AQUA Overpass @ 1834 (UTC); VZA = 14.72° (relative to ER-2 track)
Western Site: PARSL, Everglades National Park, Gulf Coast Visitor's Center
|
|||||||||||||||||||||||||||||||||||||||||||||||||||||||||||||||||||||||||||||||||||||||||||||||||||||||||||||||||||||||||||||||||||||||||||||||||||||||||||||||||||||||||||||||||||||||||||||||||||||||||||

Flight 02-952


| Sample Imagery |
| Click image for full resolution |
|
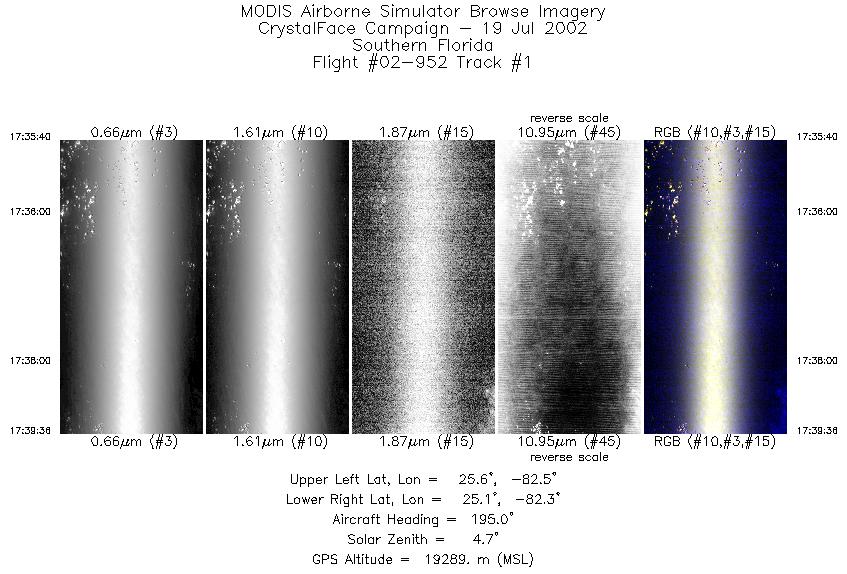
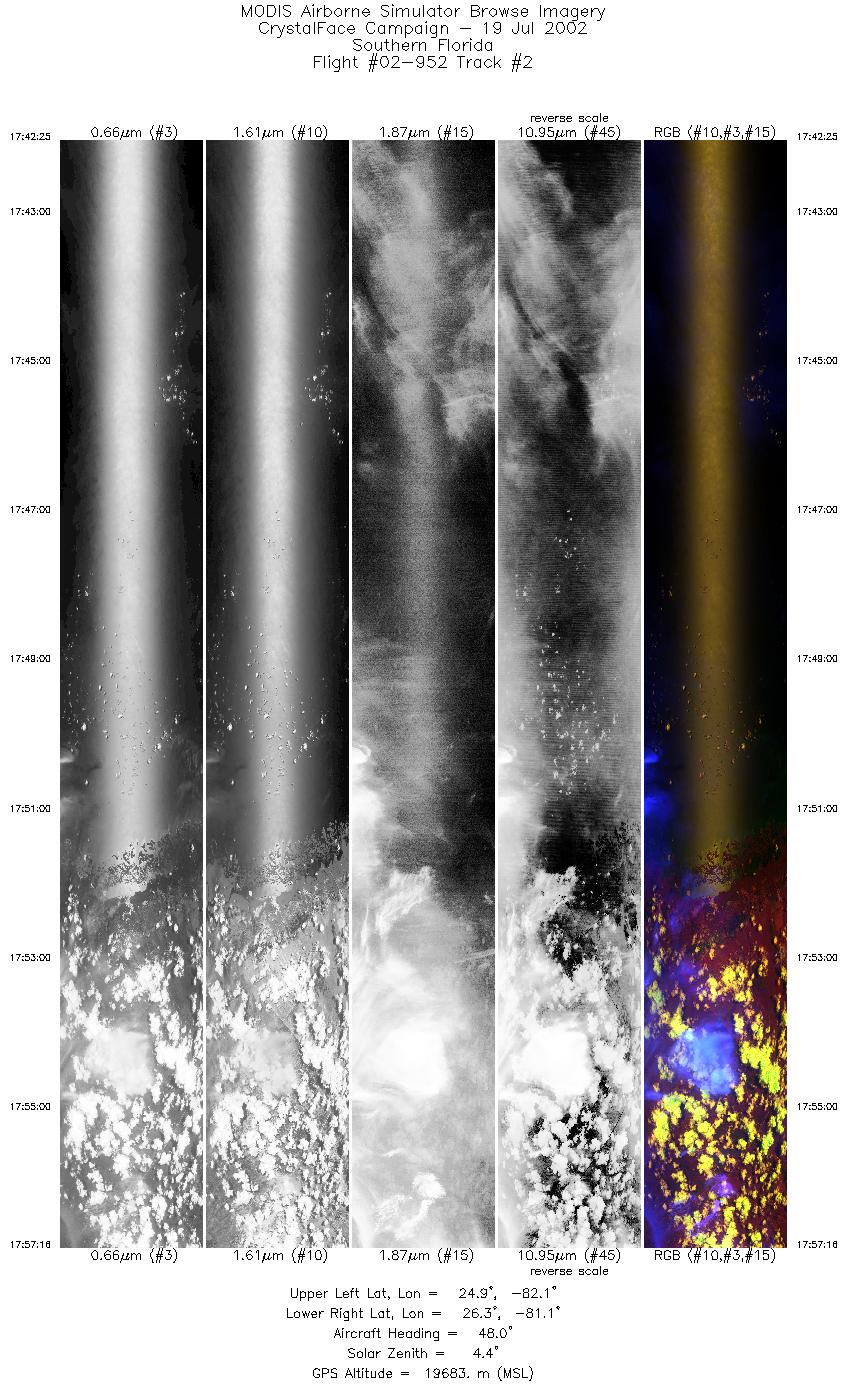
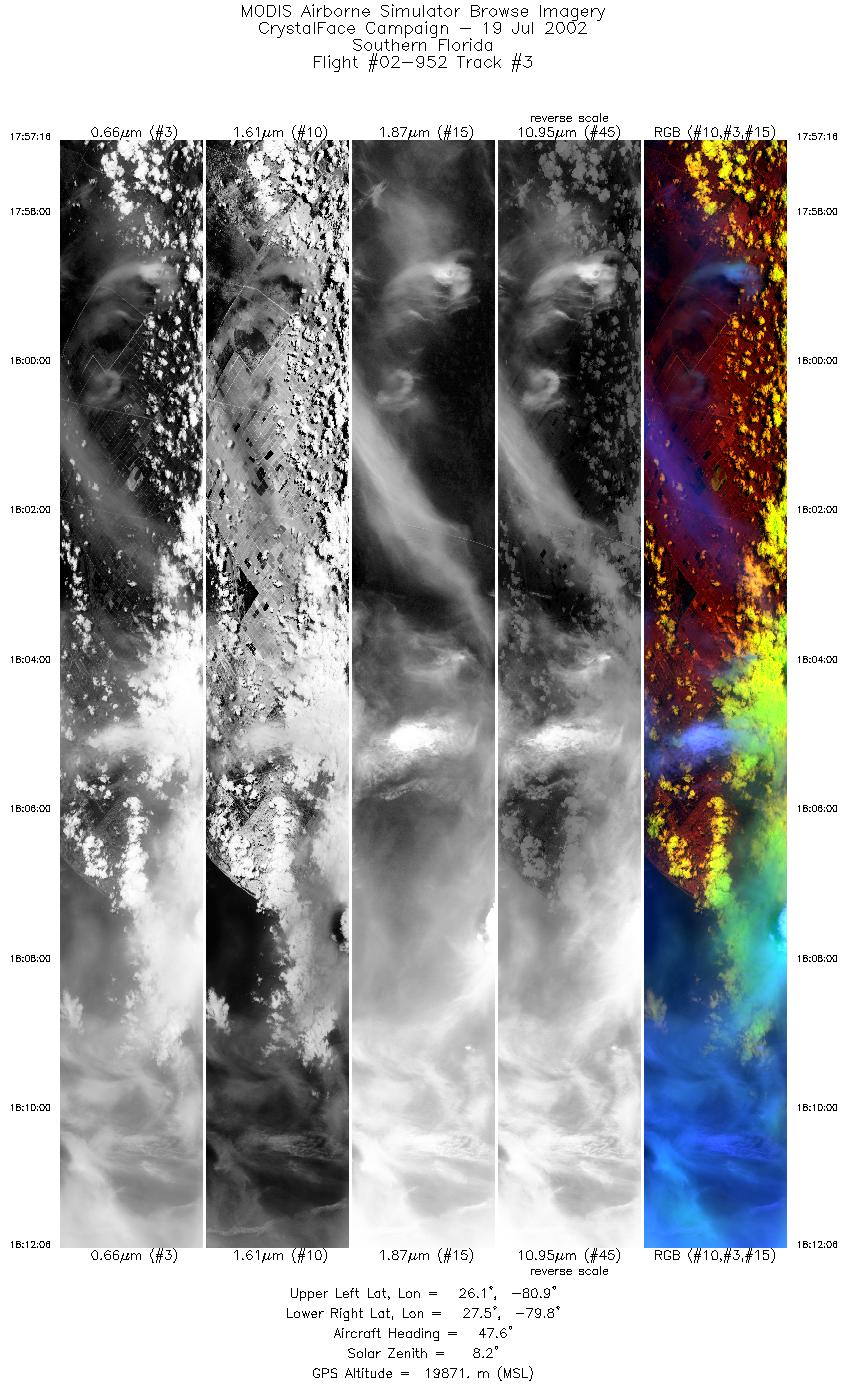
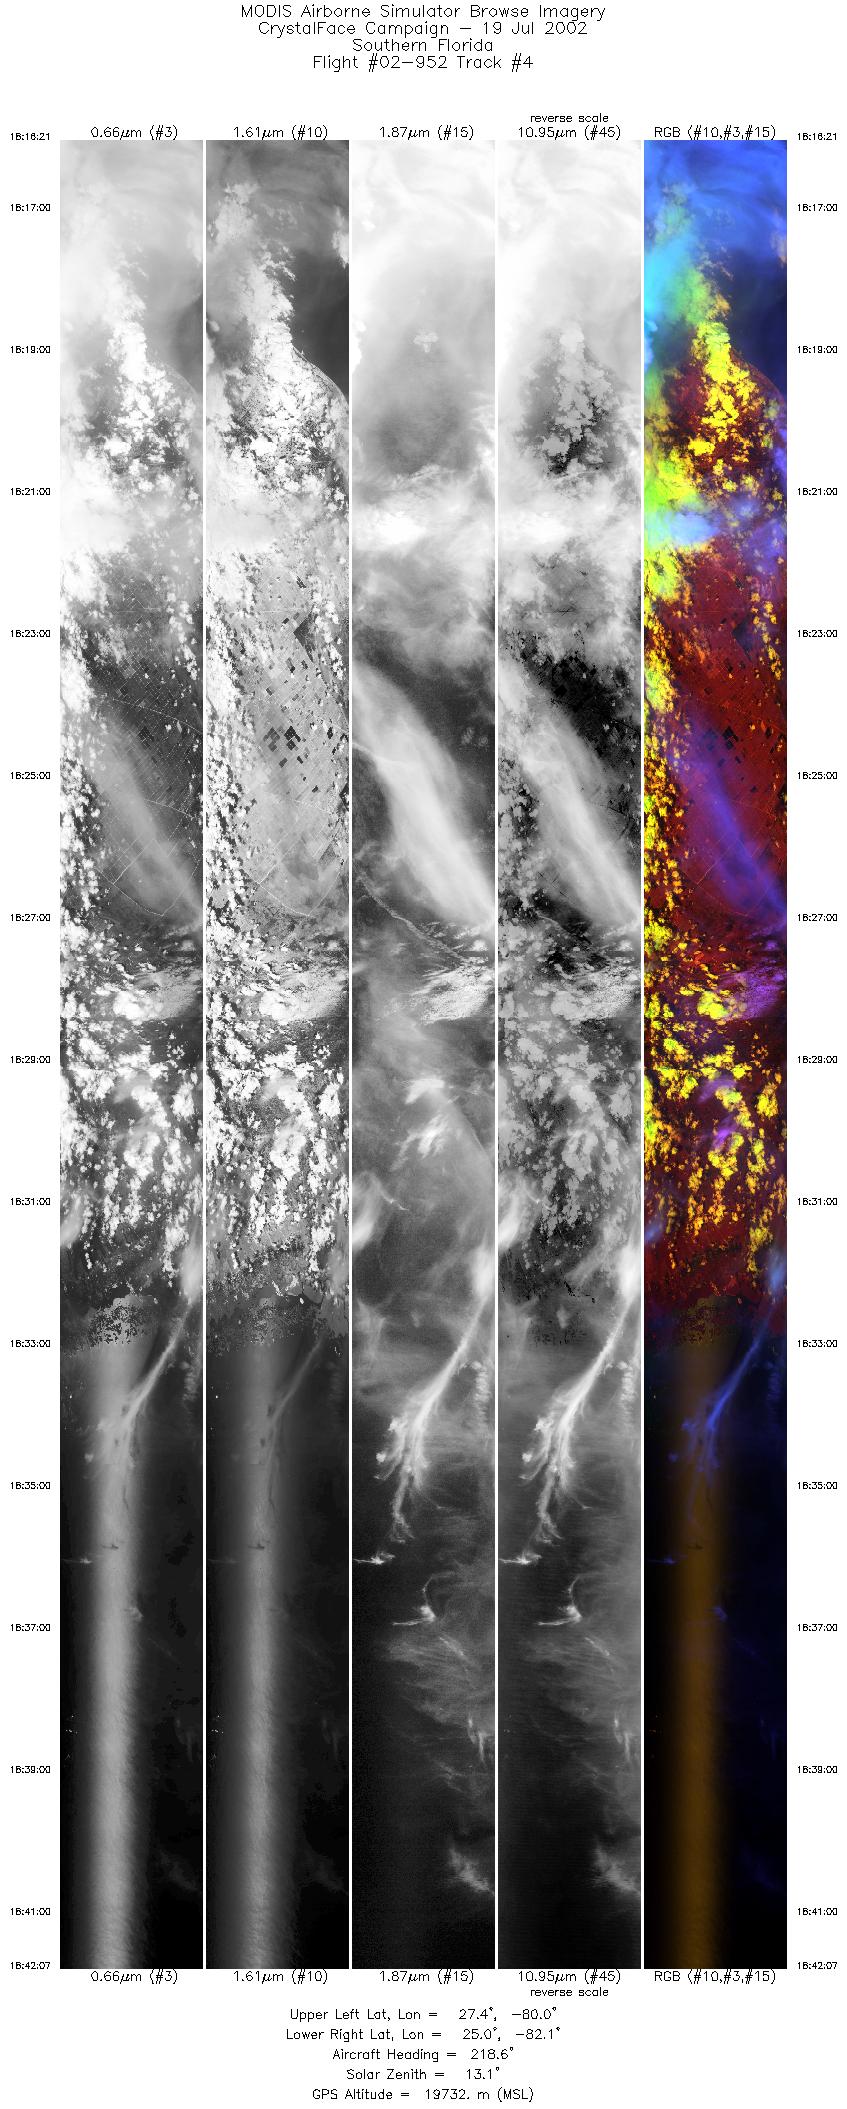
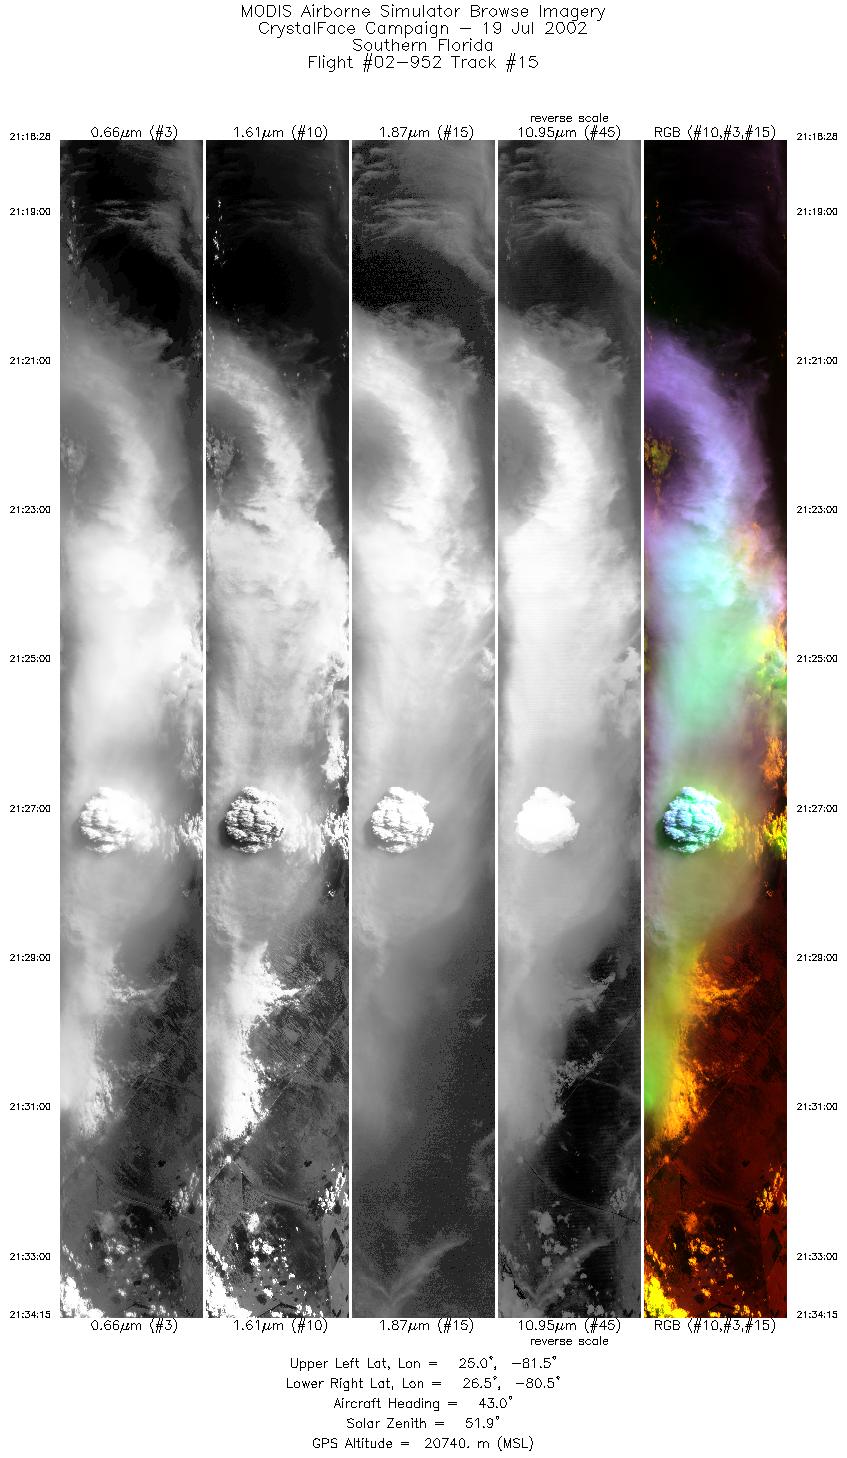
Track #15 Southern Florida |


|
|
R: 1.64µm G: 0.66µm B: 1.90µm |
|
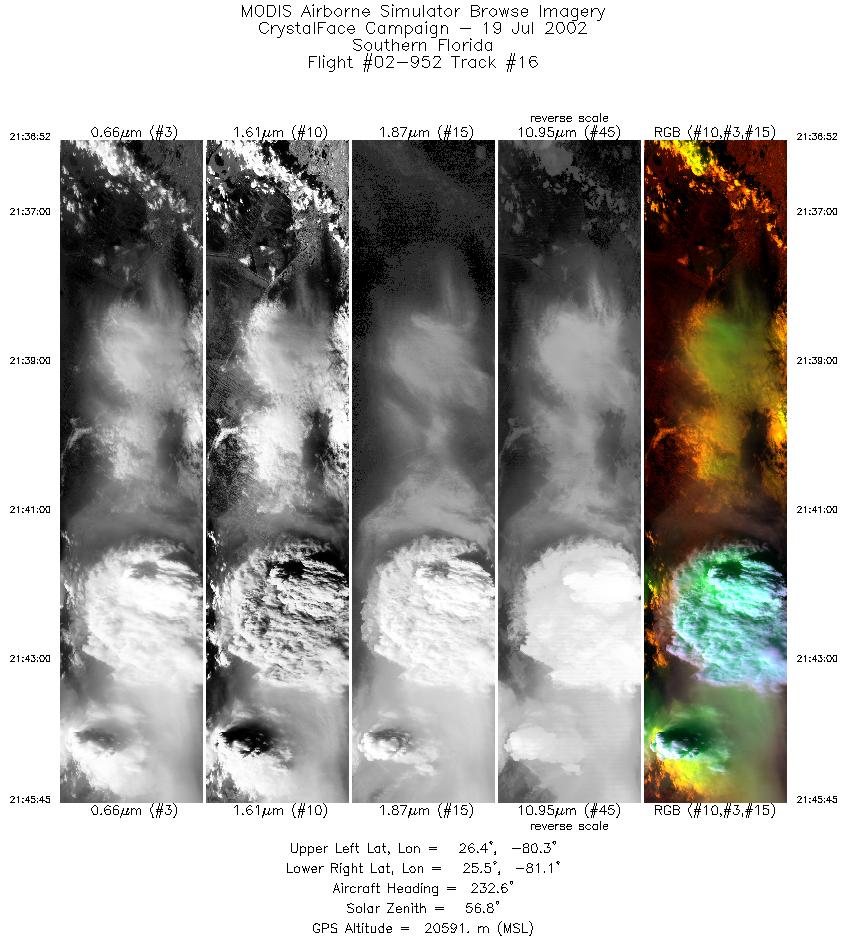
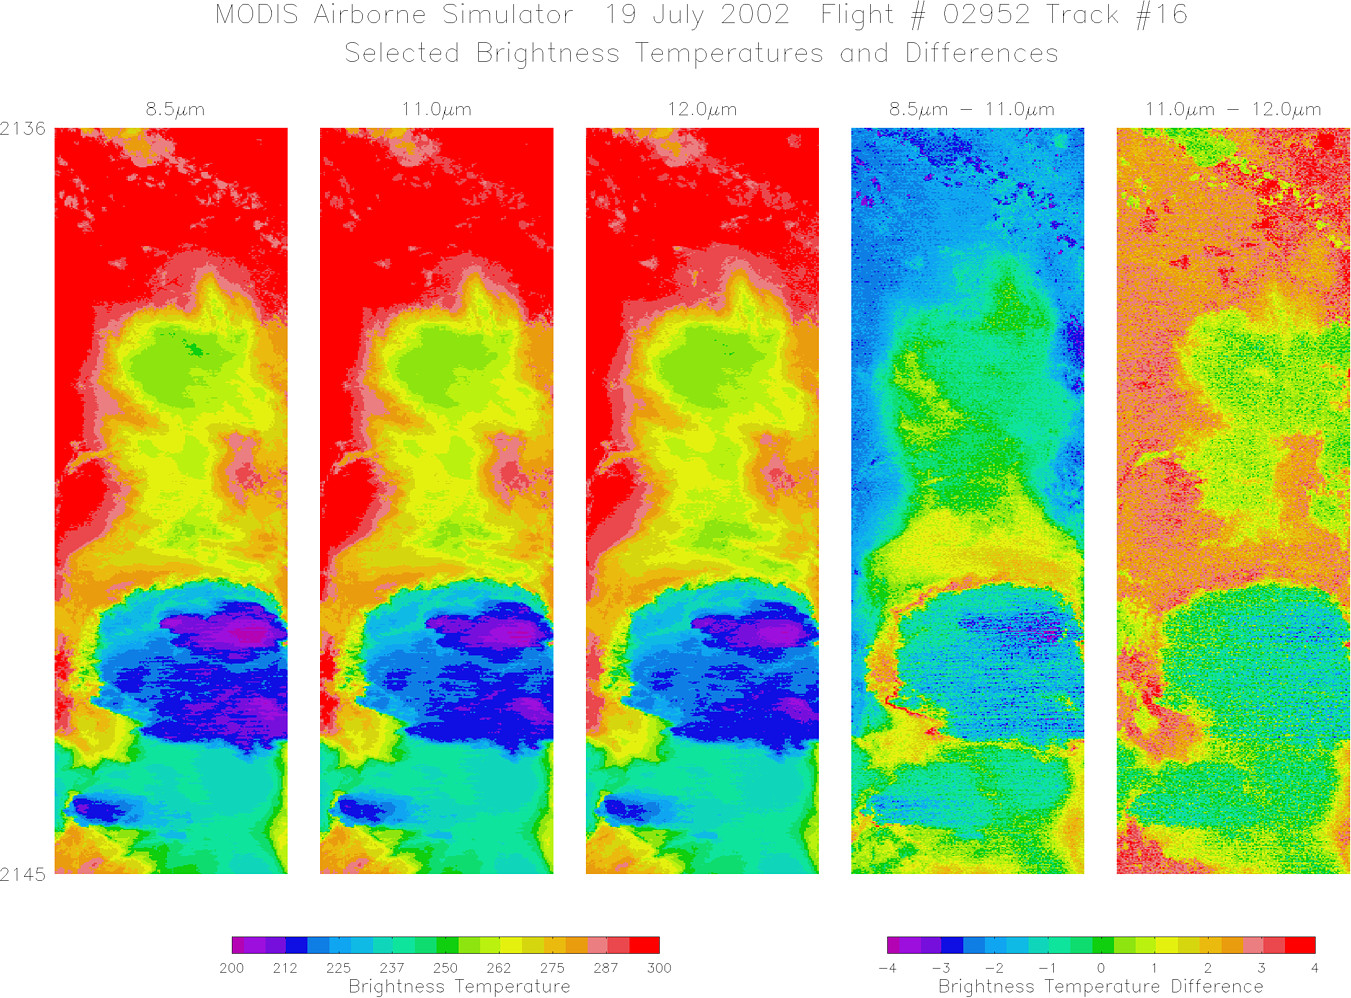
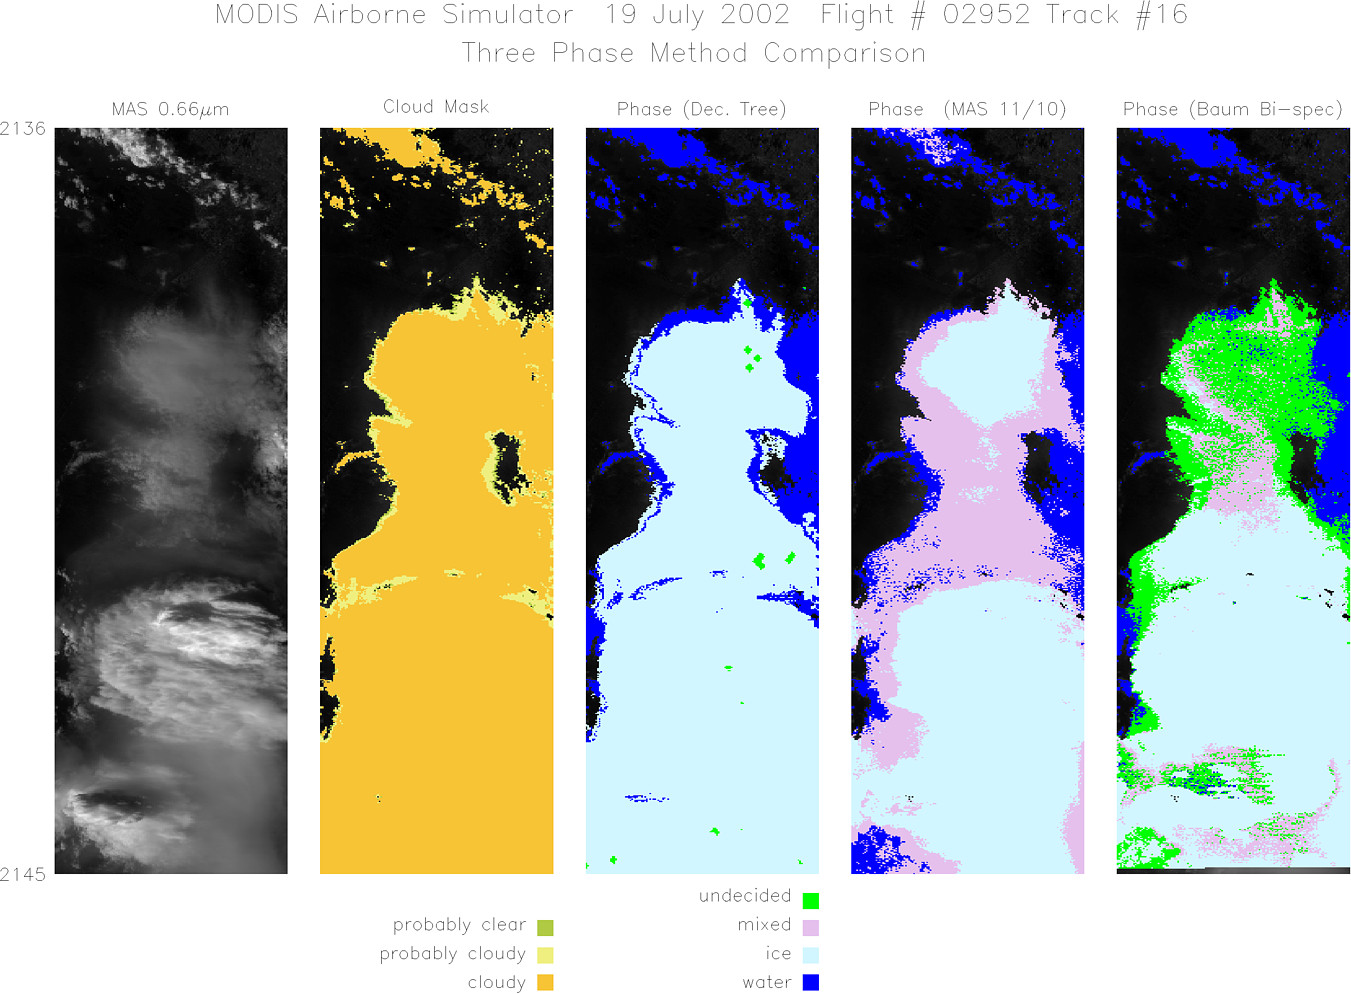
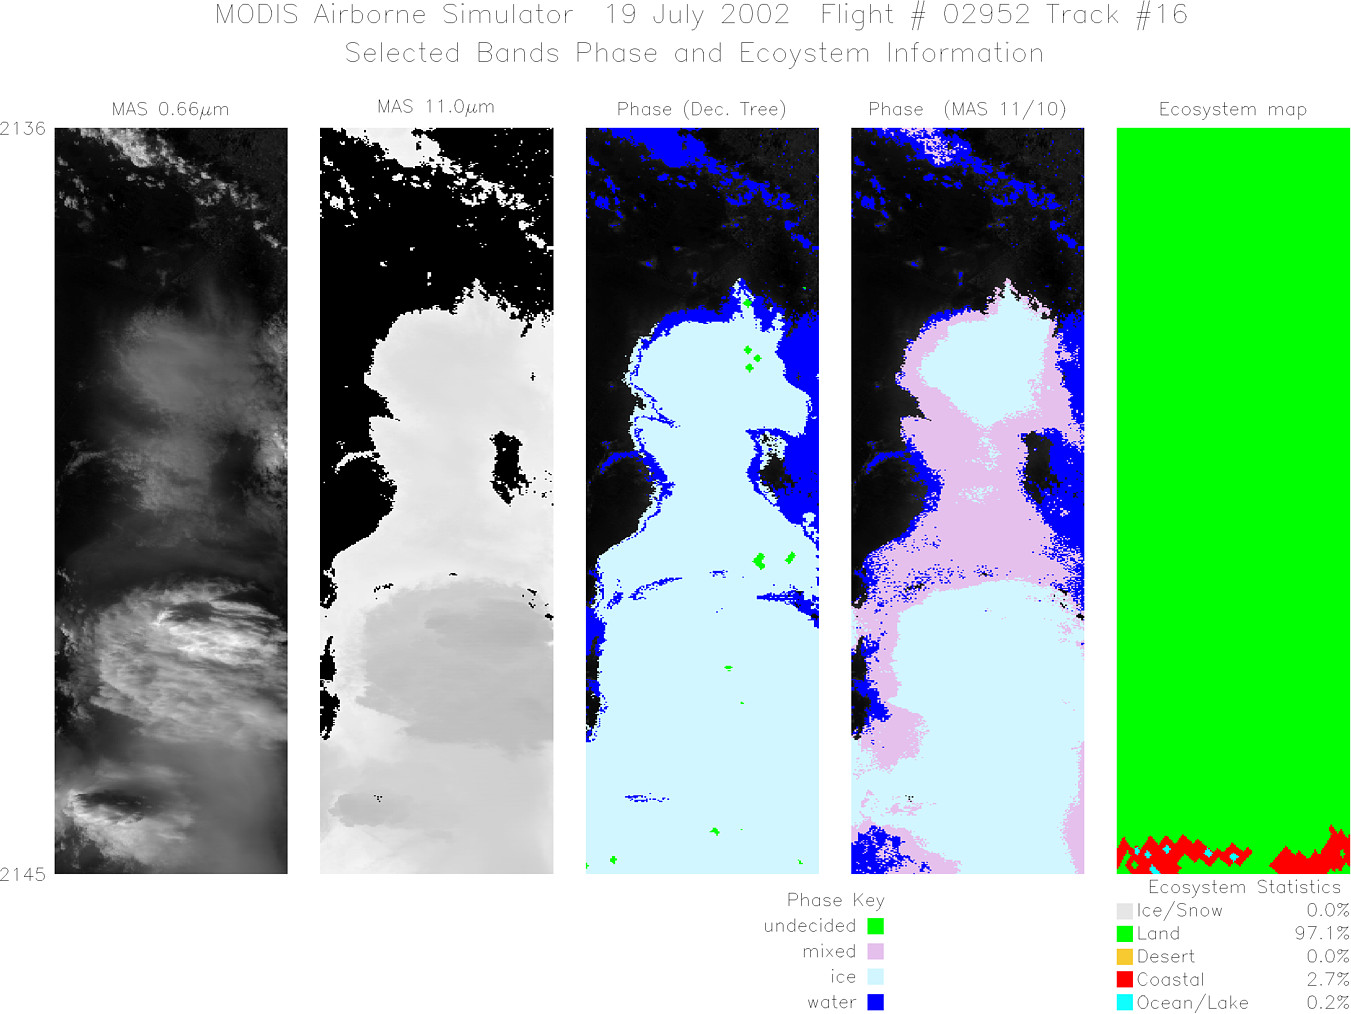
Track #16 Southern Florida |

|
|
R: 1.64µm G: 0.66µm B: 1.90µm |
|
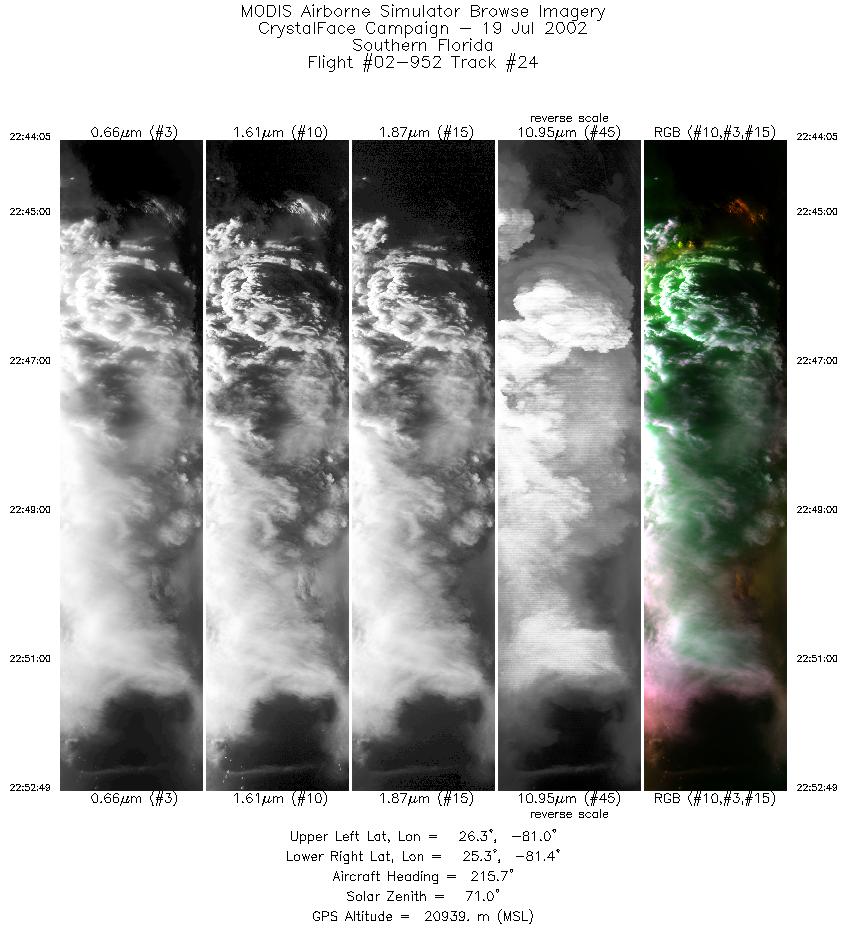
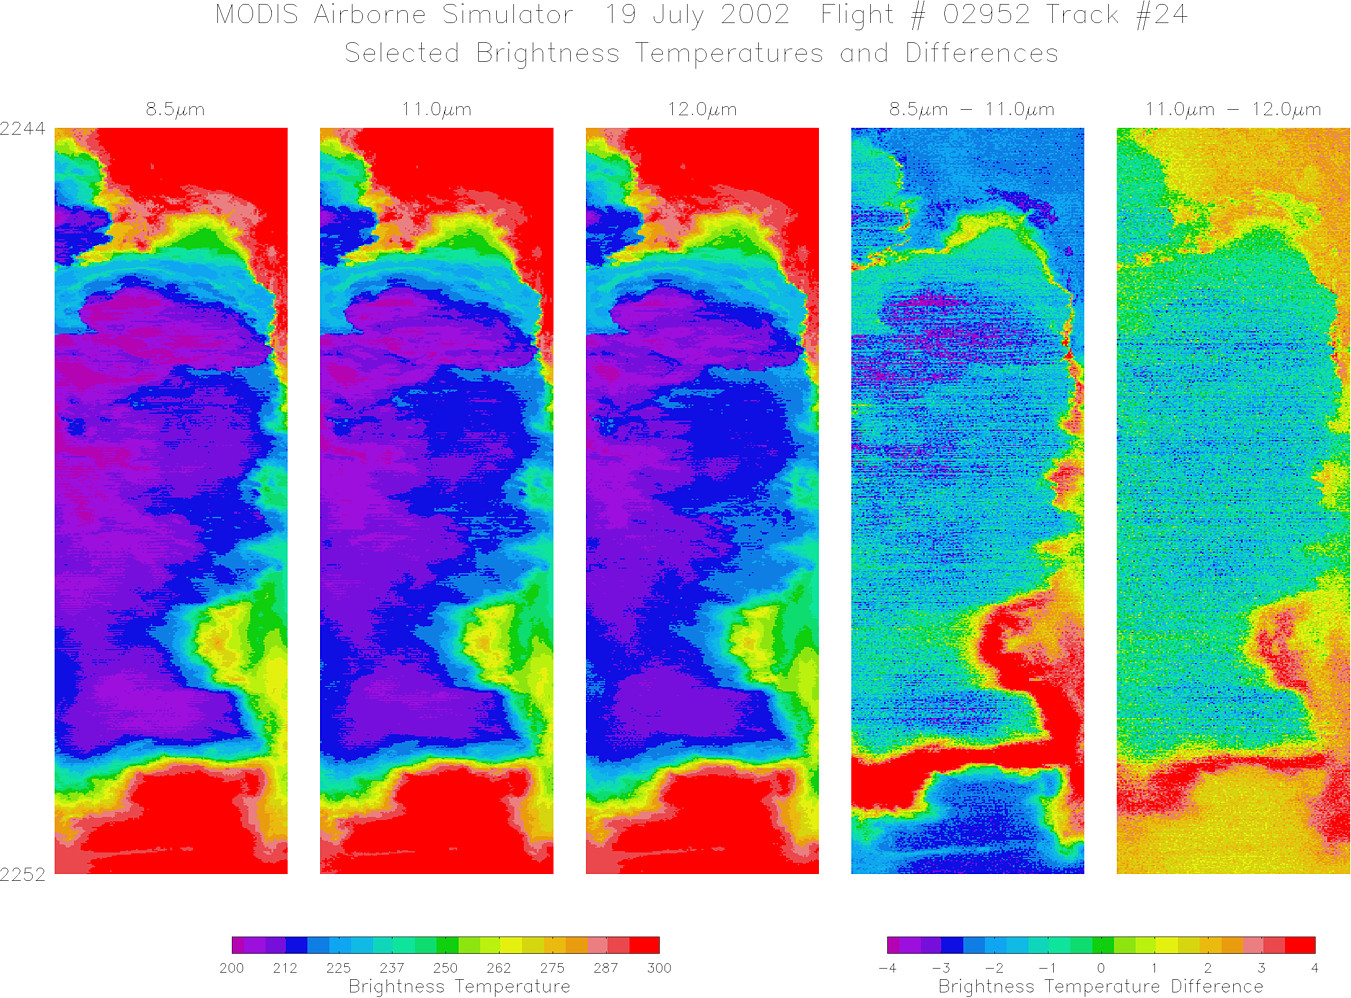
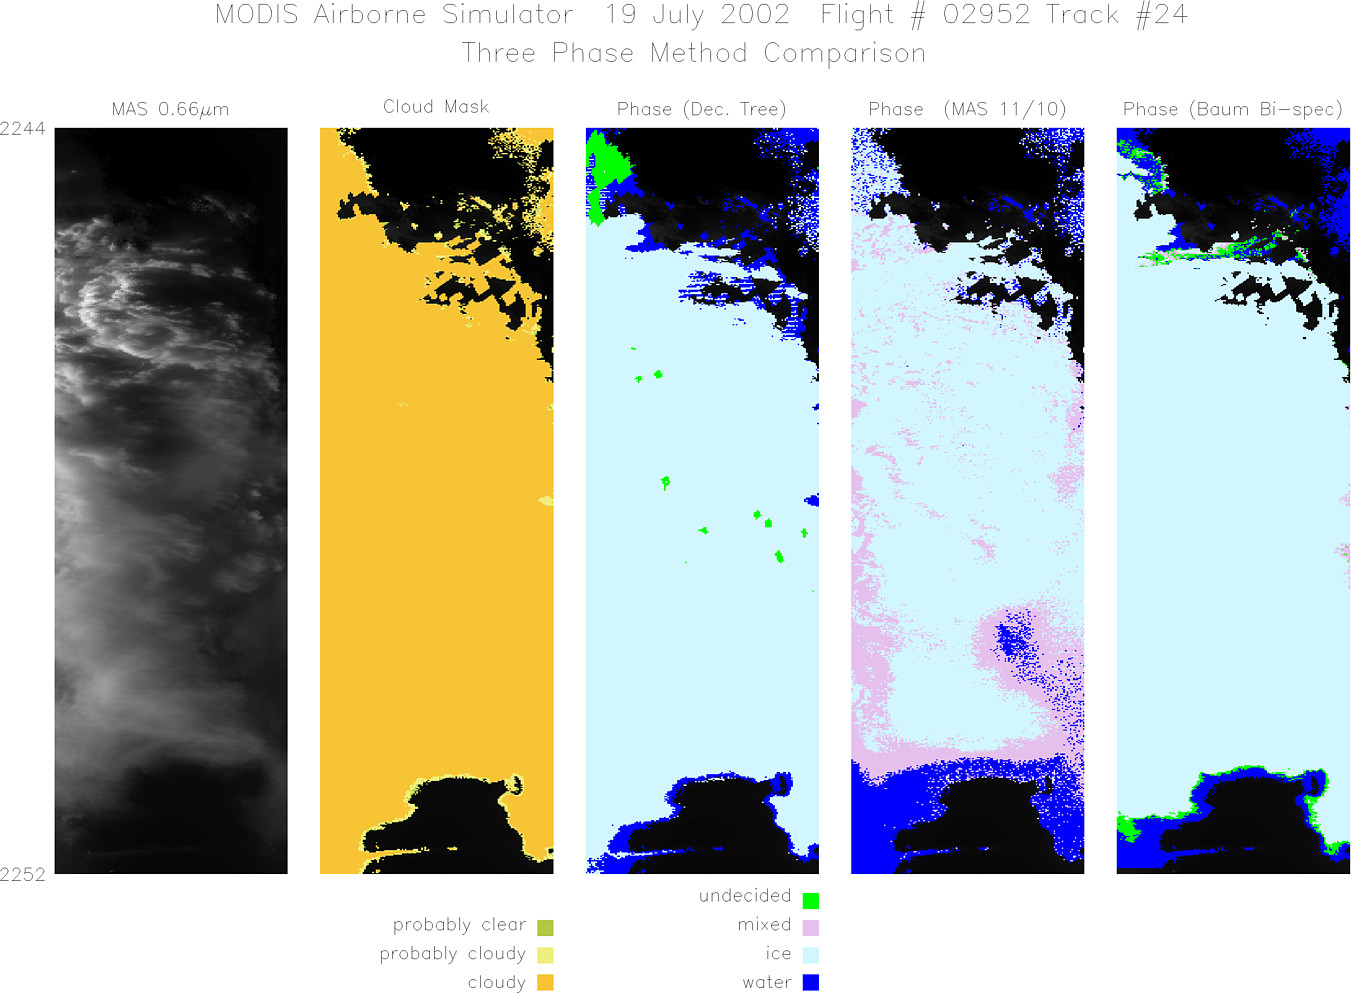
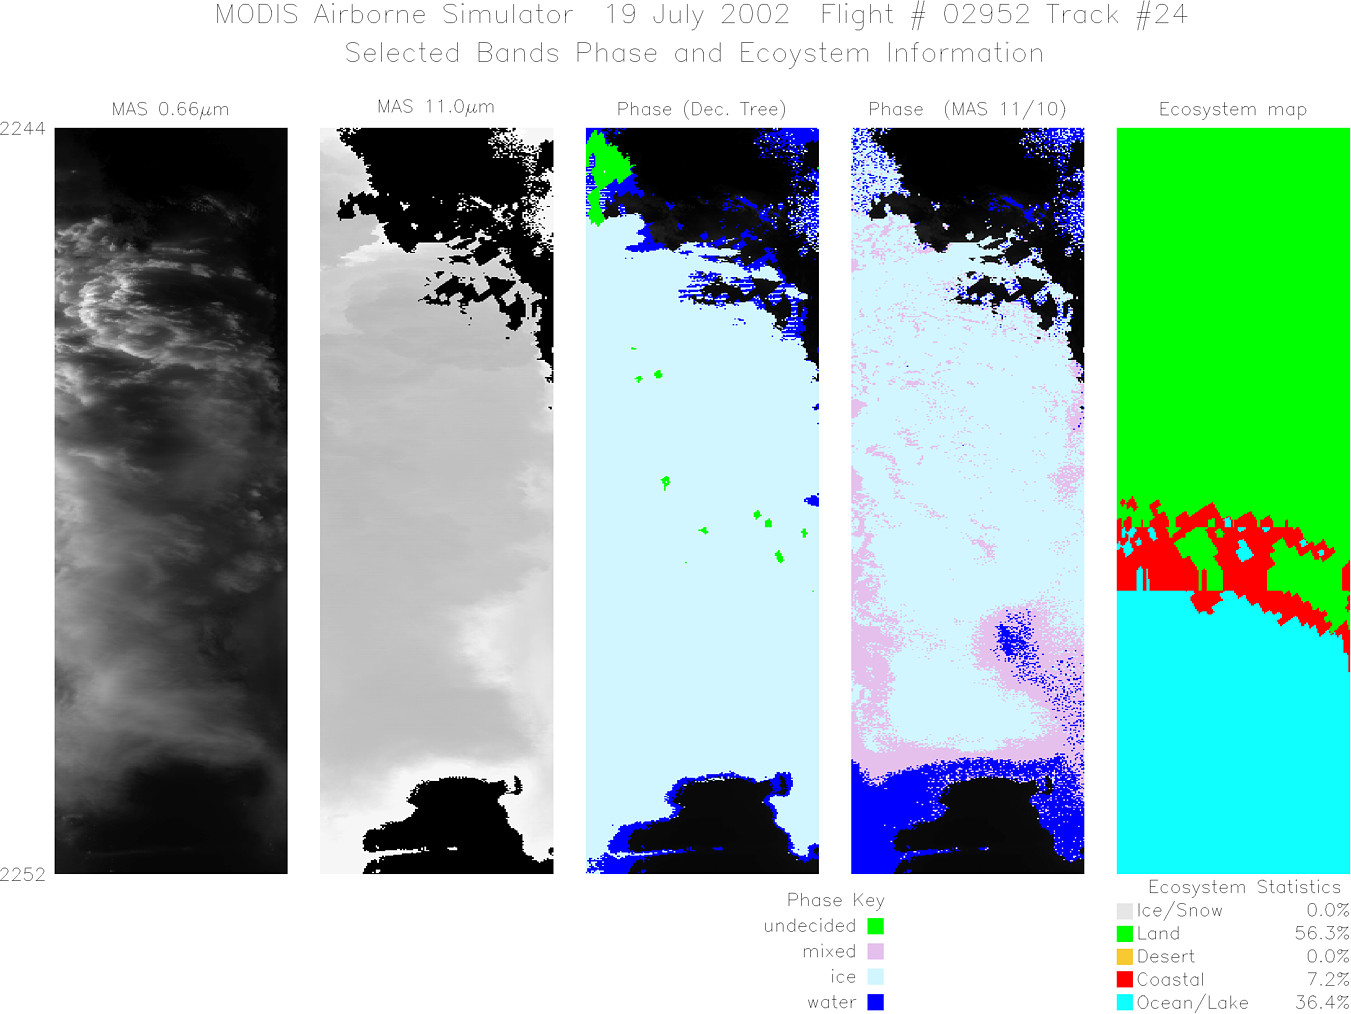
Track #24 Southern Florida |

|
|
R: 1.64µm G: 0.66µm B: 1.90µm |
- NASA Official: Matt Fladeland
- Project Manager: James Jacobson
- Website Editor: Eric Fraim
- Last Updated: November 16, 2021


