


MODIS Airborne Simulator (MAS)
FLIGHT SUMMARY INFORMATION


|
Flight: 02-951 Date: 16 July 2002 Location: Gulf of Mexico / Florida / Atlantic Ocean Deployment: CRYSTAL-FACE Principal Investigators: Drs. Michael King & Steven Platnick (NASA GSFC) Additional Sensors: CoSSIR, CPL, CRS, Dropsondes, EDOP, JLH, MMS, MTP, RAMS, SSFR |
||||||||||||||||||||||||||||||||||||||||||||||||||||||||||||||||||||||||||||||||||||||||||||||||||||||||||||||||||||||||||||||||||||||||||||||||||||||||||
|
Data Evaluation Overall quality is good AQUA Underflight @ 18:03 TERRA Underflight @ 16:34 |
||||||||||||||||||||||||||||||||||||||||||||||||||||||||||||||||||||||||||||||||||||||||||||||||||||||||||||||||||||||||||||||||||||||||||||||||||||||||||
|
Processing Information Level-1B Data in HDF format is available Flight Line Summary Spectral Band Configuration Spectral Response Function Table |
||||||||||||||||||||||||||||||||||||||||||||||||||||||||||||||||||||||||||||||||||||||||||||||||||||||||||||||||||||||||||||||||||||||||||||||||||||||||||
|
Browse Imagery Flight Tracks: 18 Scanlines: 80288 |
||||||||||||||||||||||||||||||||||||||||||||||||||||||||||||||||||||||||||||||||||||||||||||||||||||||||||||||||||||||||||||||||||||||||||||||||||||||||||
|
||||||||||||||||||||||||||||||||||||||||||||||||||||||||||||||||||||||||||||||||||||||||||||||||||||||||||||||||||||||||||||||||||||||||||||||||||||||||||
|
Flight Summary Report Mission Number: 6 Mission Scientists: S. Platnick, P. Newman ER-2 Pilot: J. Barrilleaux Takeoff: 1410 (UTC) Landing: 2005 (UTC) Duration: 5:55 (h:mm) Sea breeze was expected to develop convection over central Florida in mid-to-late afternoon. Strong ENE winds at 200 hPa and above were expected to advect cirrus blow-off across Florida to the Gulf. Takeoff (2 PM EDT) was timed to the development of the Cb, measurements of the cirrus blow-off, and coordination with eastern ground site observations. After climbing to altitude, the ER-2 proceeded to waypoint A (25°38' N, 81°04' W) and flew an ENE ground track over the eastern ground site (25° 40' N, 80°25' W) towards waypoint B (25°44' N, 78°33' W). Strong convection developed south of the Tamiami trail with blow-off being carried across Fla into the Gulf region to the west of Florida. NPOL re-directed the ER-2 into a shortened racetrack pattern oriented roughly E-W along the A-B track. This track was then superceded by NPOL for sampling of cirrus blow-off over the Gulf. Three dropsondes were pickled into this cirrus over the Gulf. Satellite & Ground Site Information
AQUA Overpass @ 1803 (UTC); VZA = 60.91° (relative to ER-2 track)
Western Site: PARSL, Everglades National Park, Gulf Coast Visitor's Center
|
||||||||||||||||||||||||||||||||||||||||||||||||||||||||||||||||||||||||||||||||||||||||||||||||||||||||||||||||||||||||||||||||||||||||||||||||||||||||||

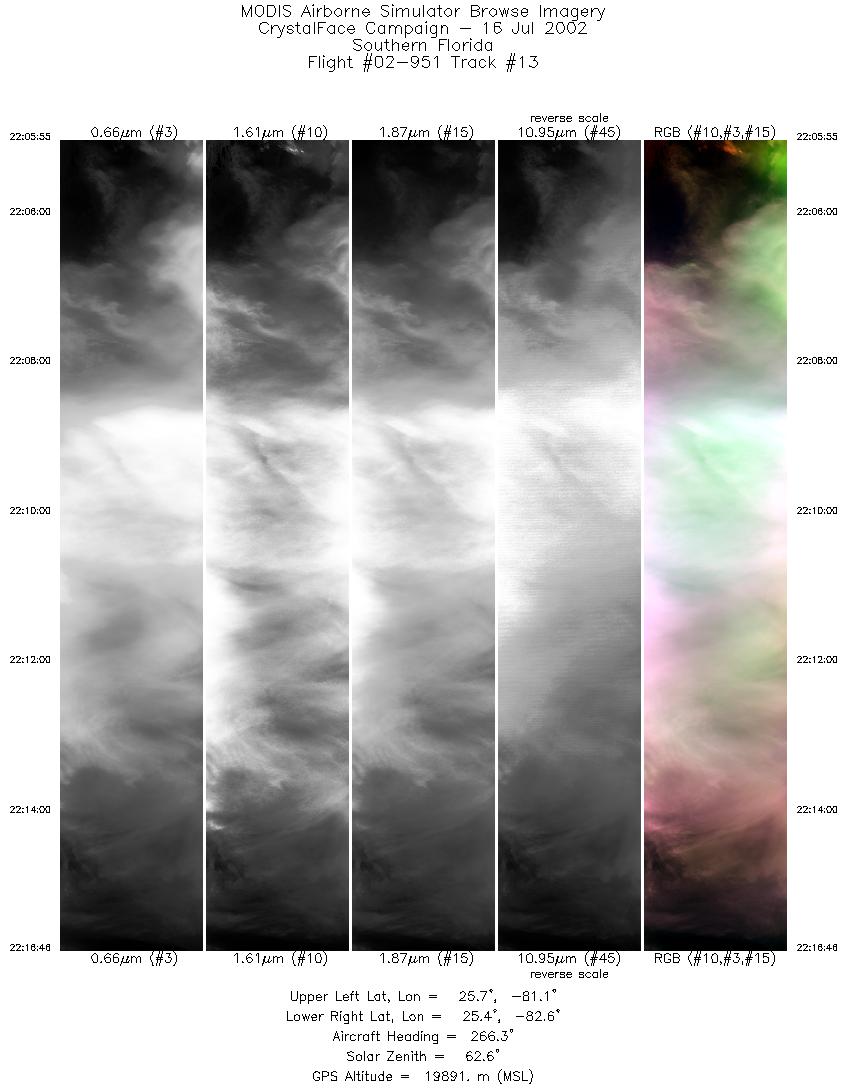
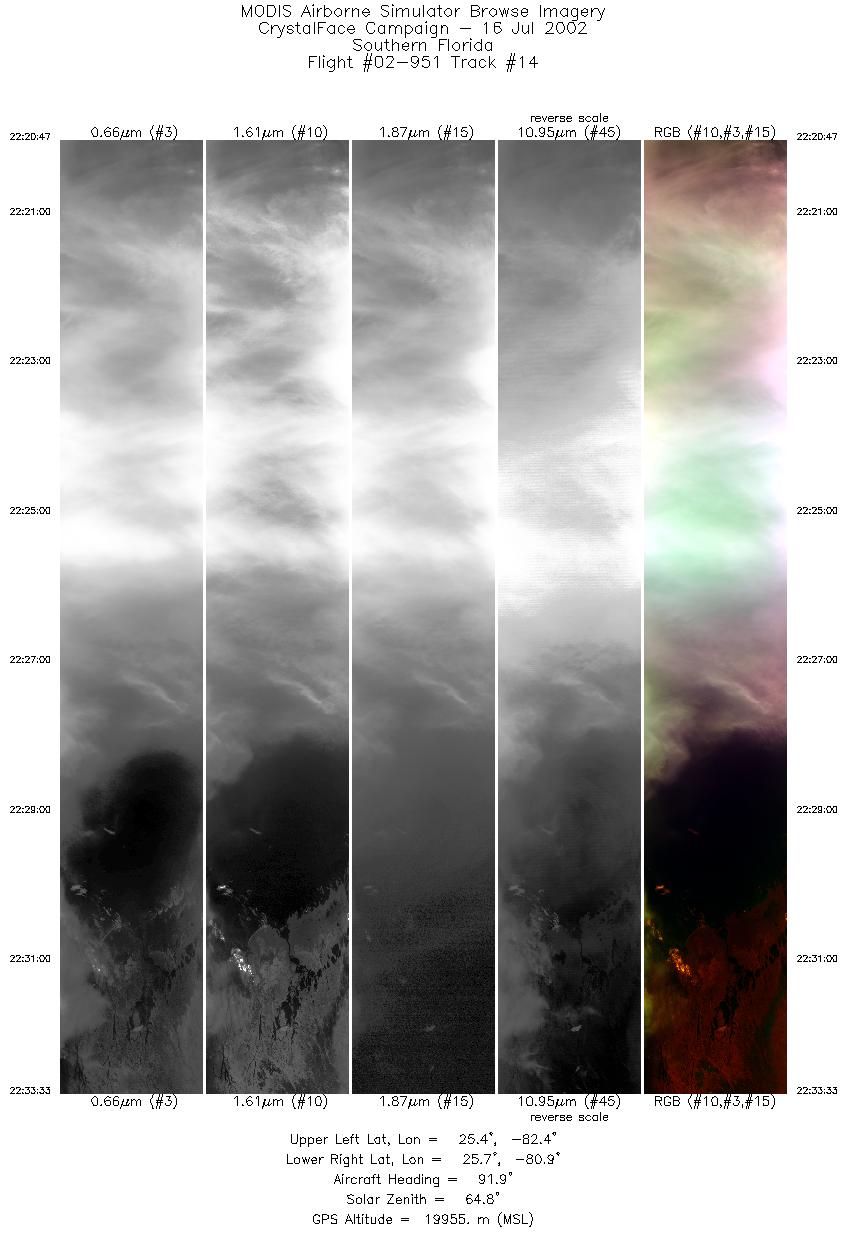
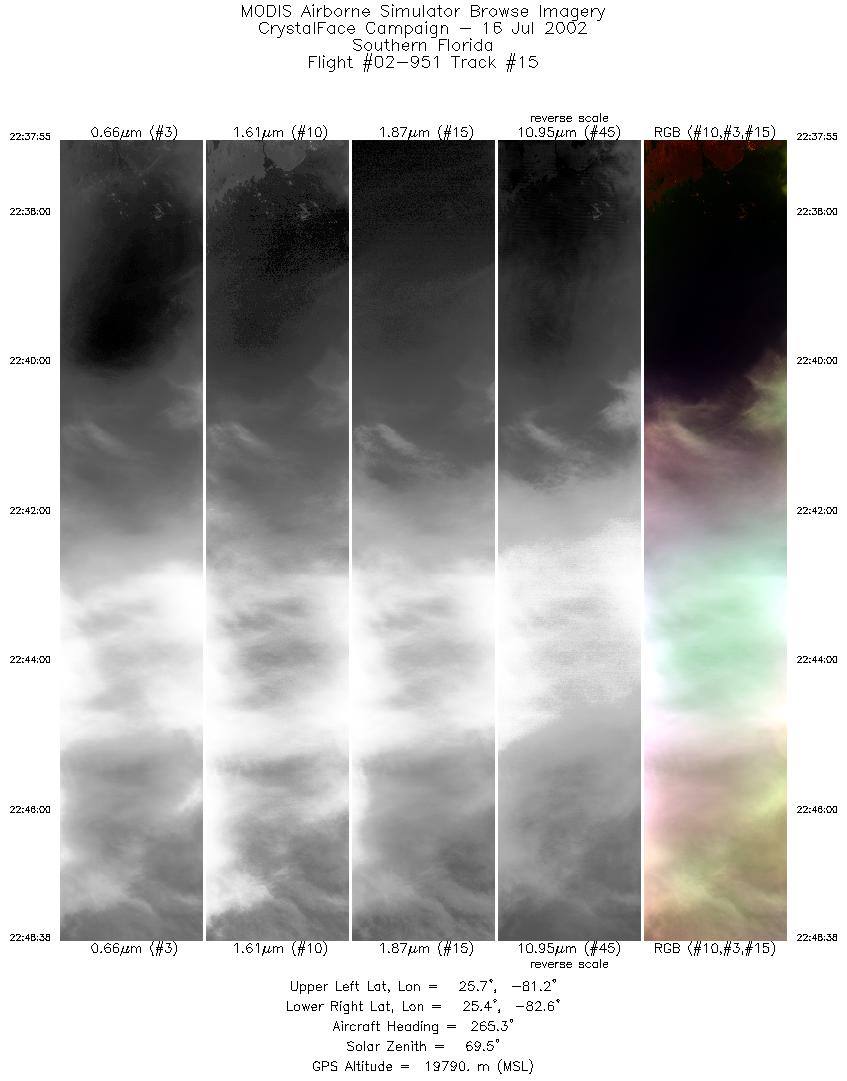
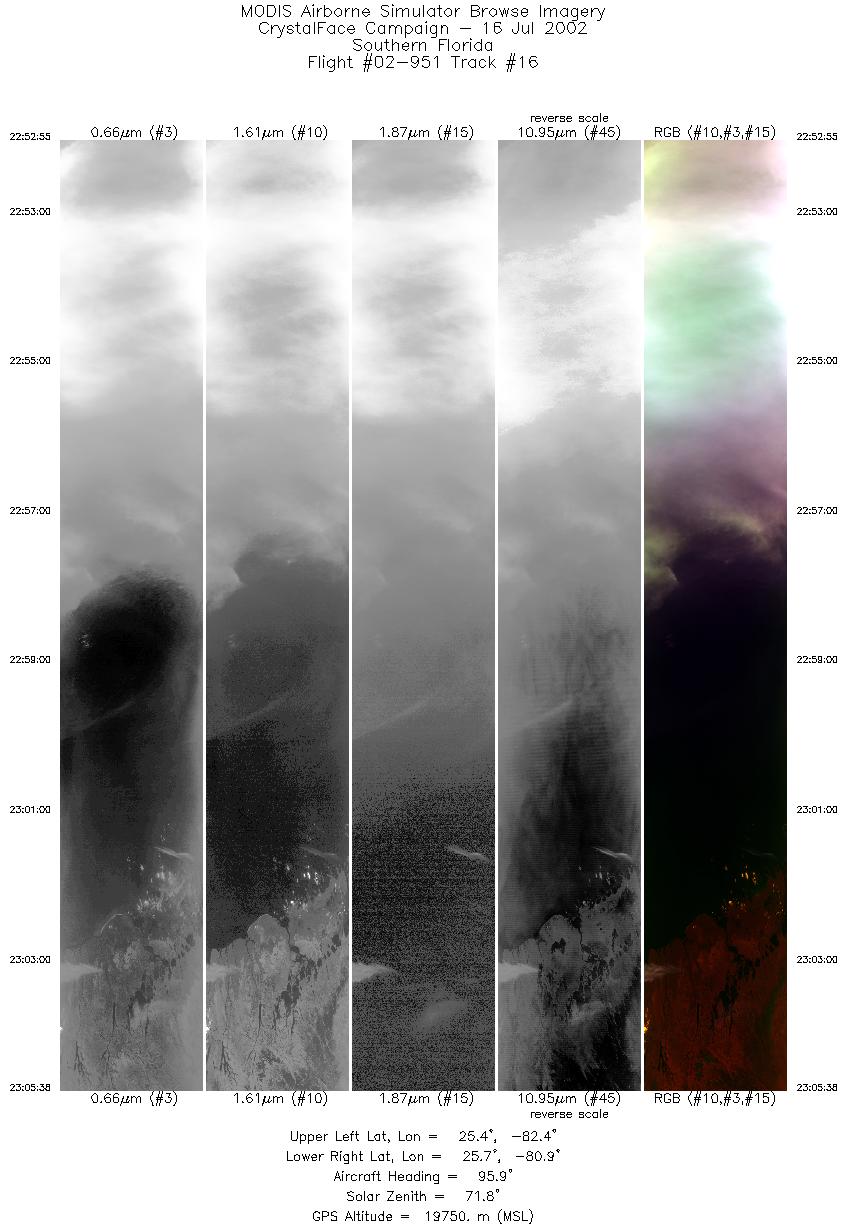
Flight 02-951


| Sample Imagery |
| Click image for full resolution |
|
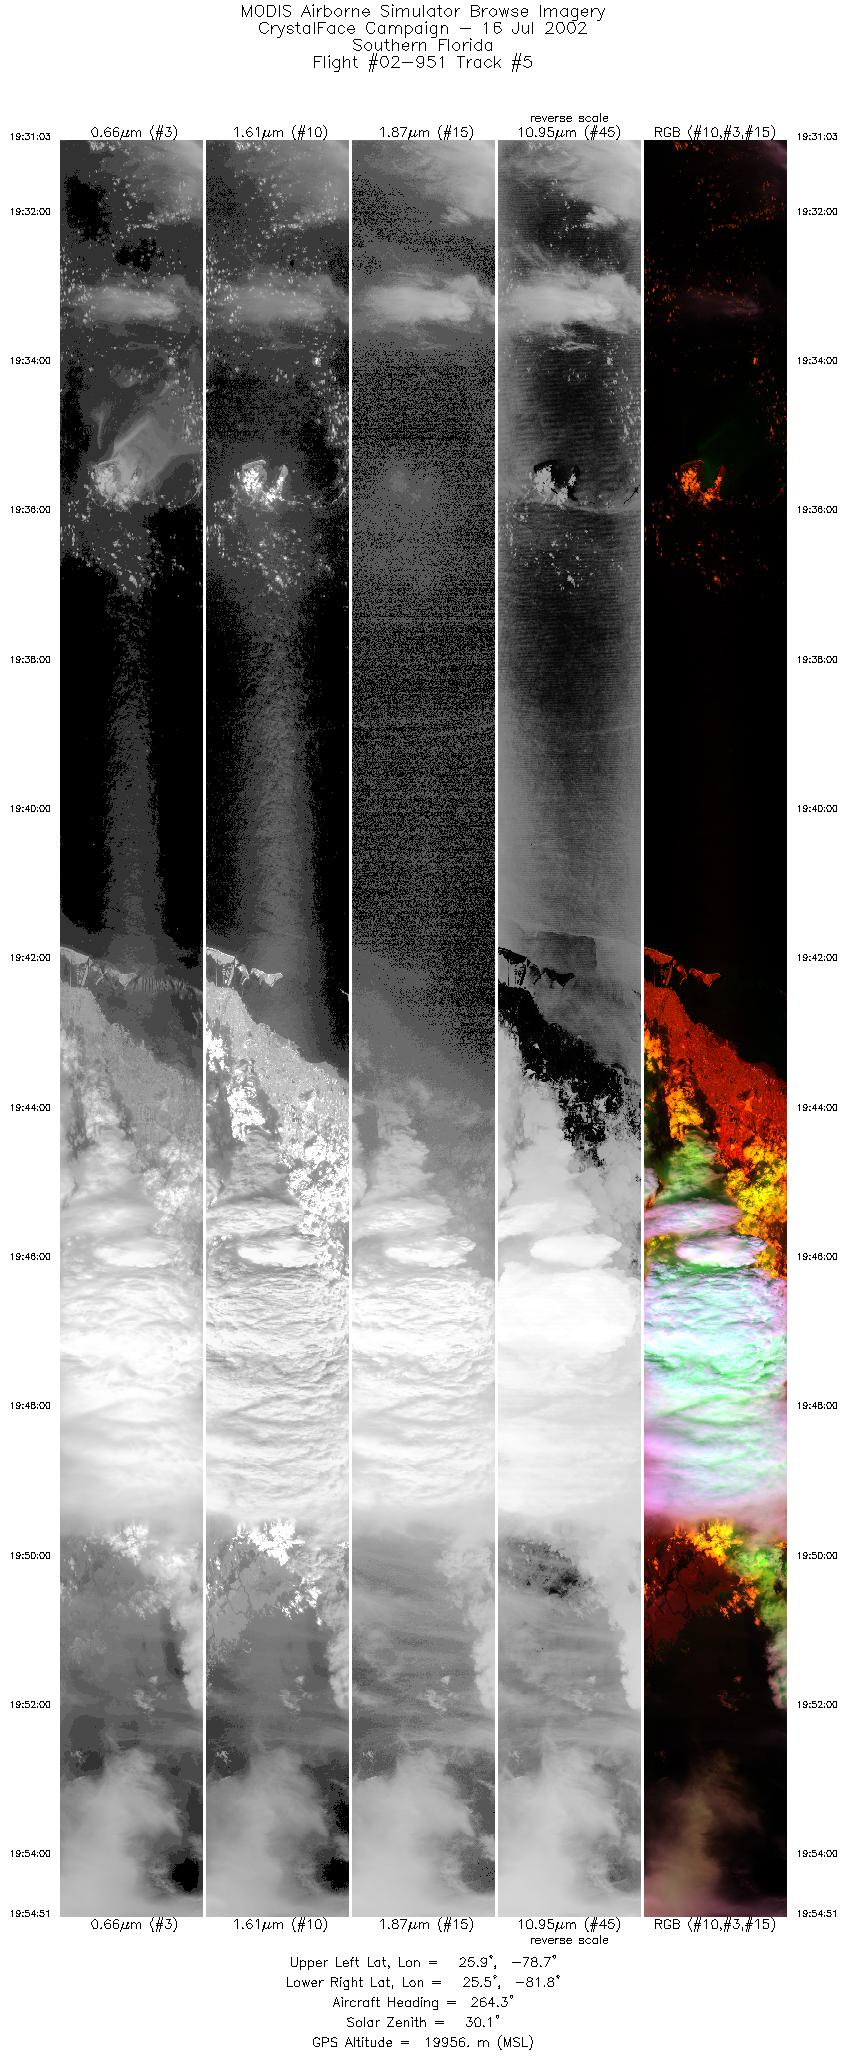
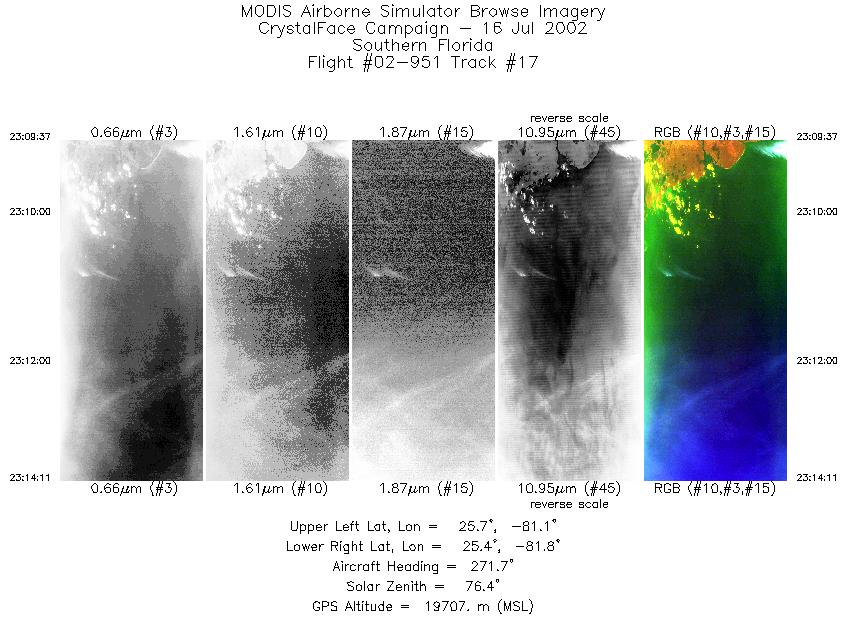
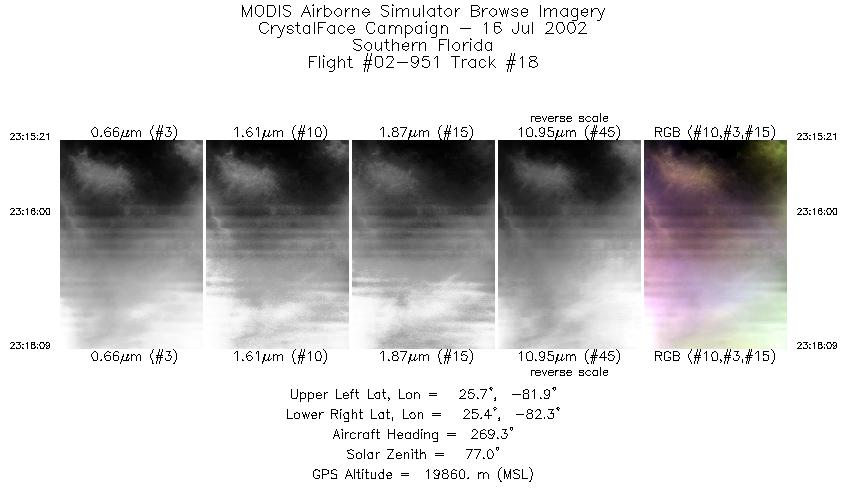
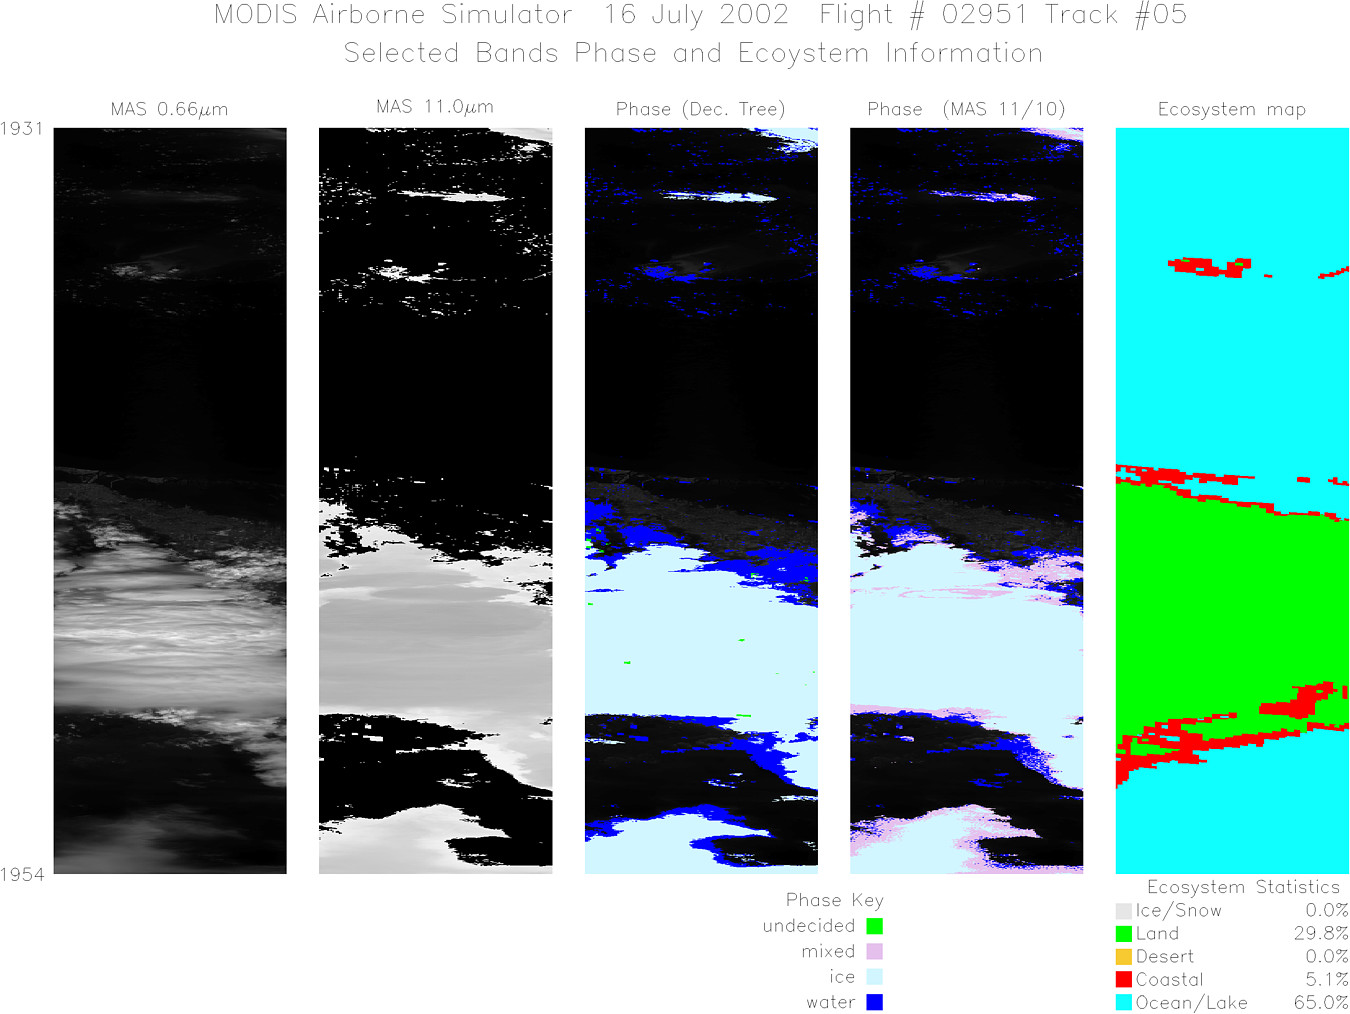
Track #05 Southern Florida |


|
|
R: 1.64µm G: 0.66µm B: 1.90µm |
|
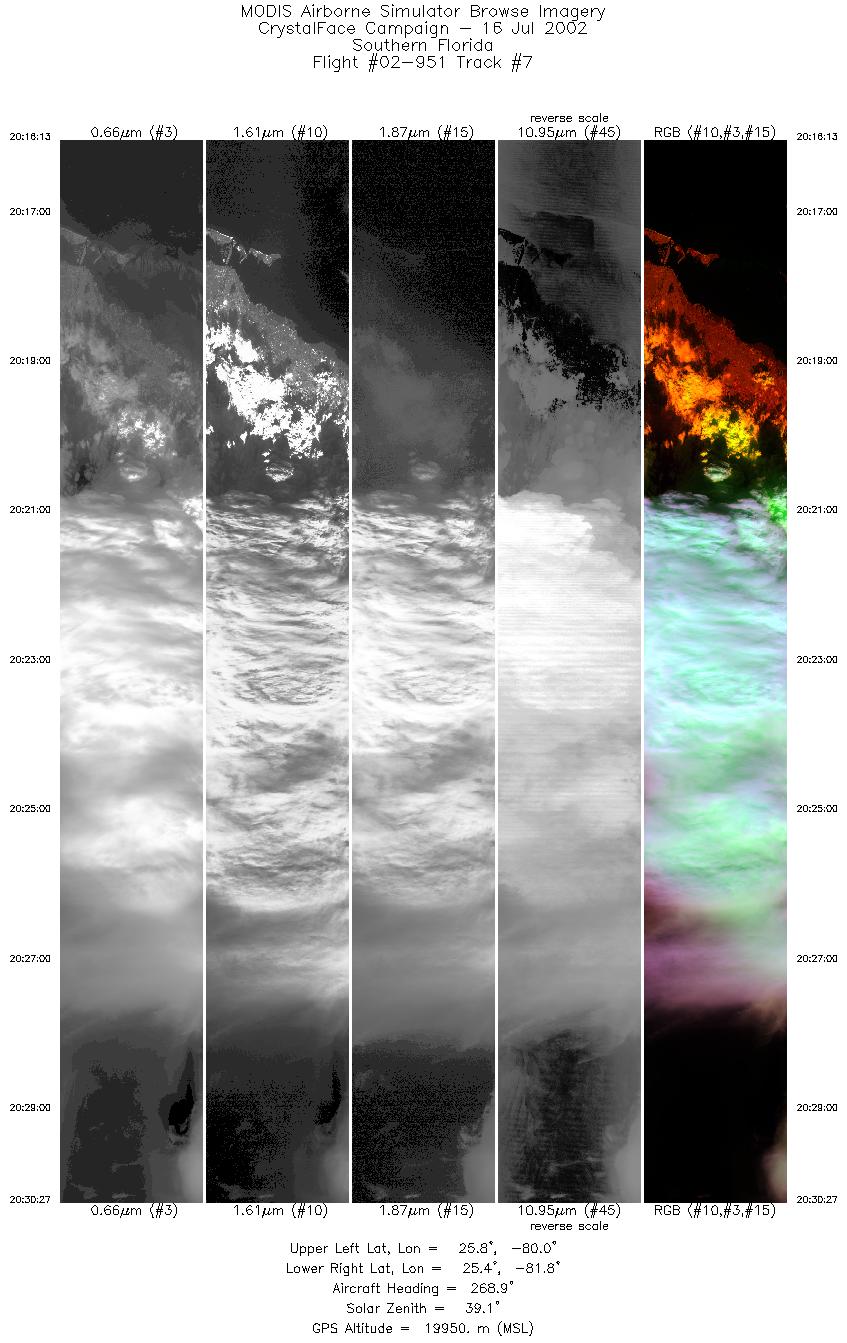
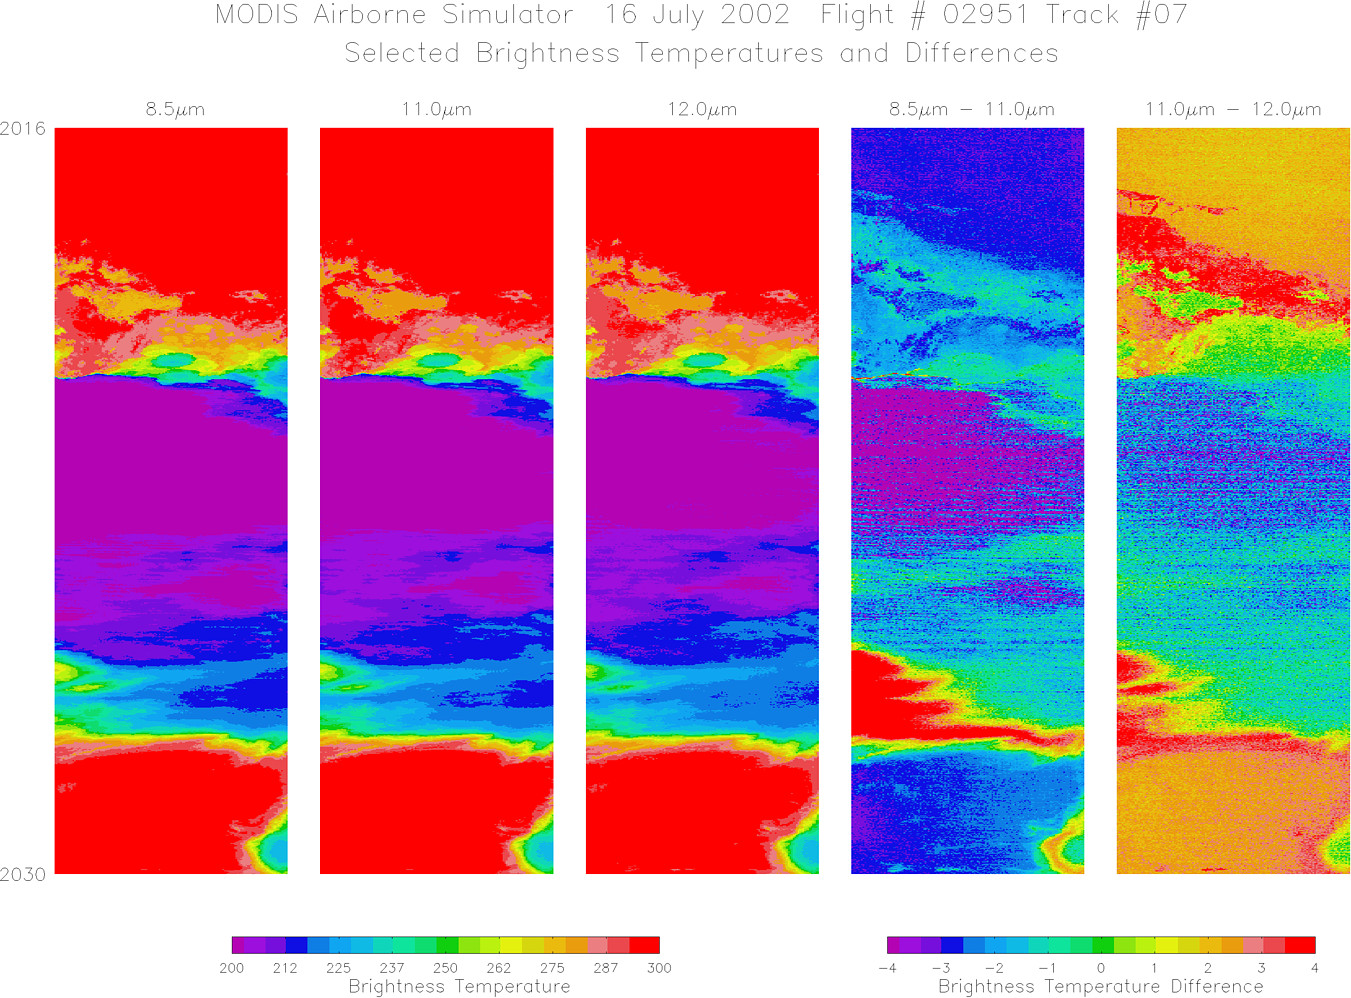
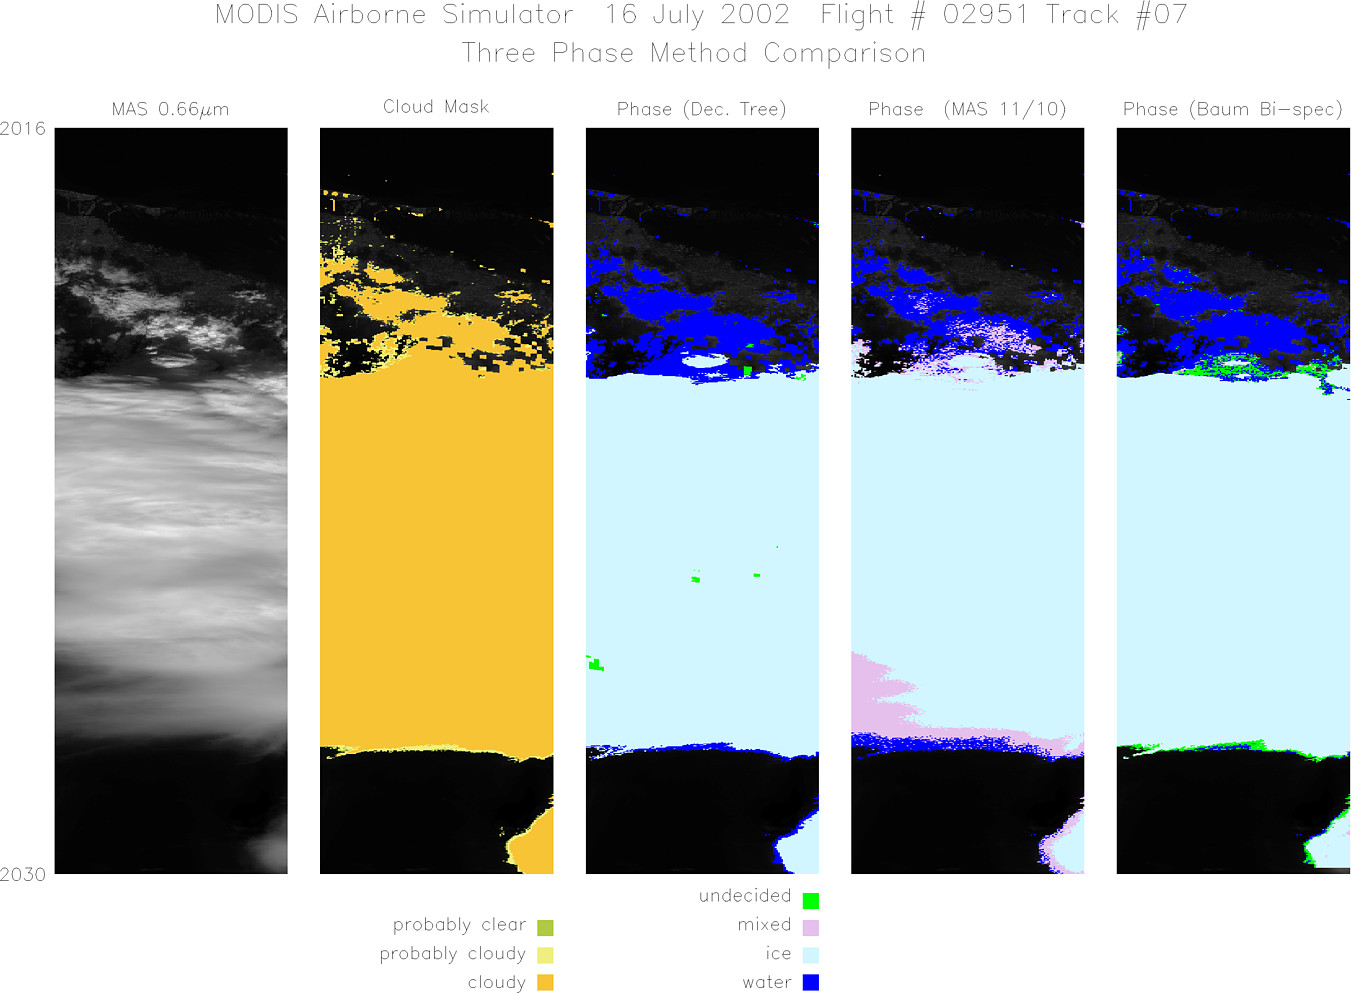
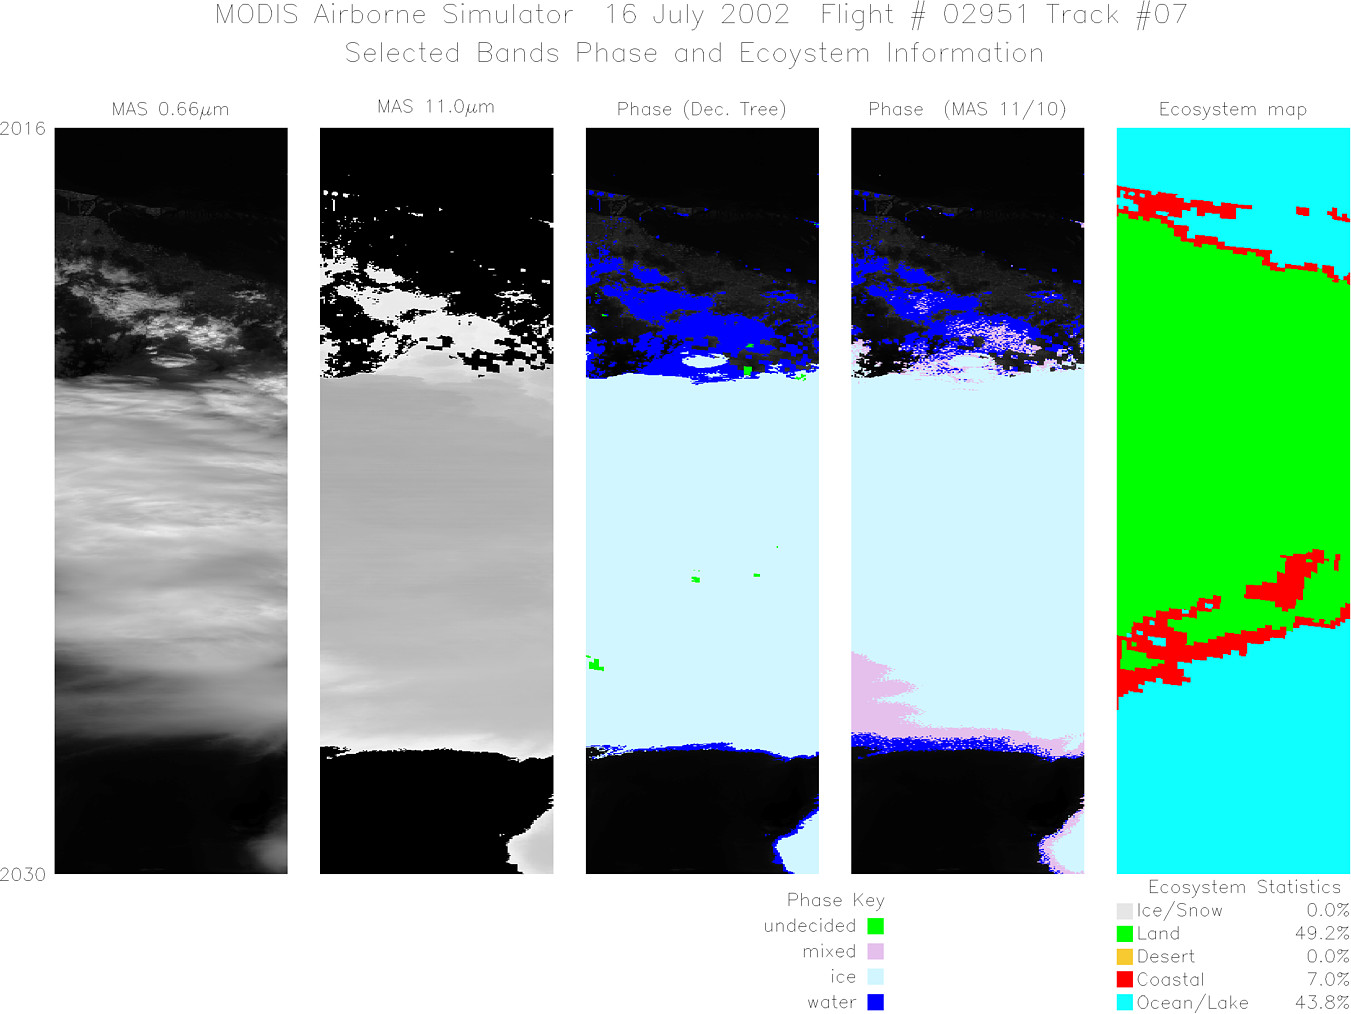
Track #07 Southern Florida |

|
|
R: 1.64µm G: 0.66µm B: 1.90µm |
- NASA Official: Matt Fladeland
- Project Manager: James Jacobson
- Website Editor: Eric Fraim
- Last Updated: November 16, 2021


