


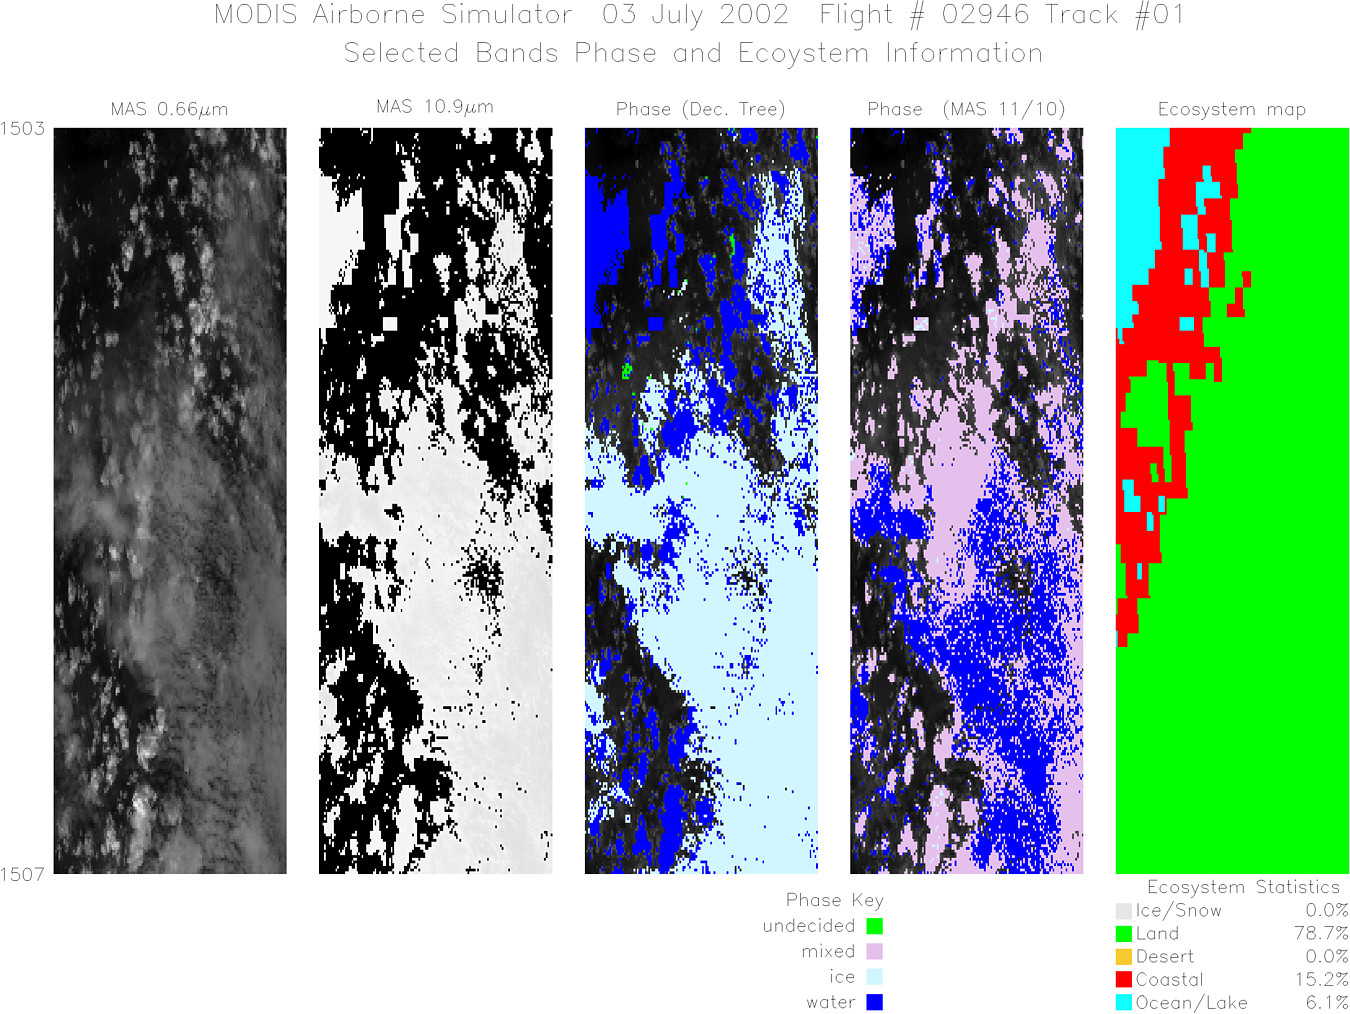
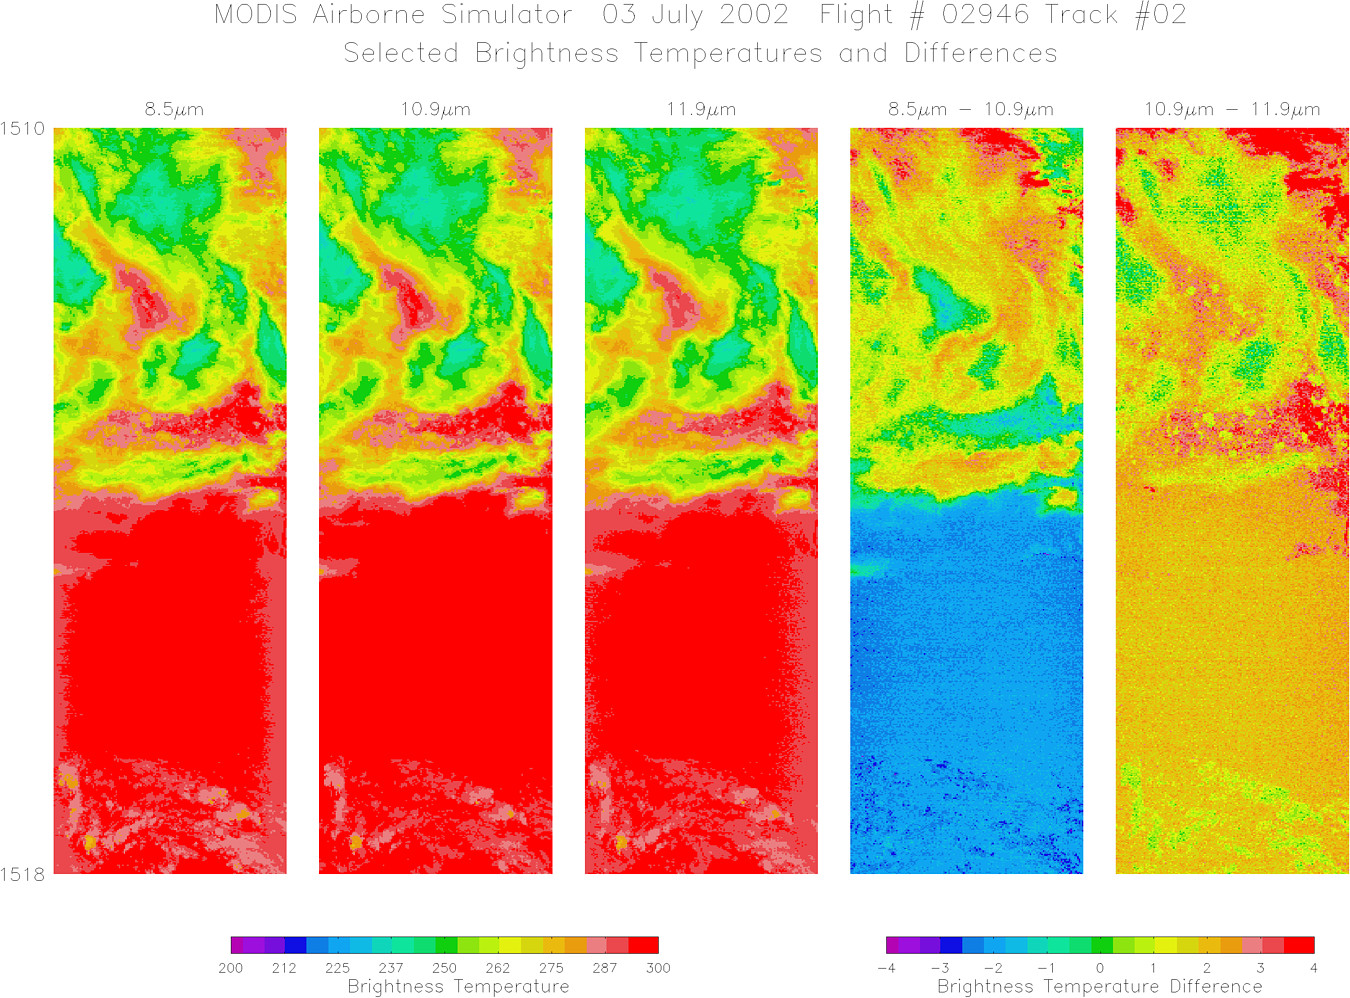
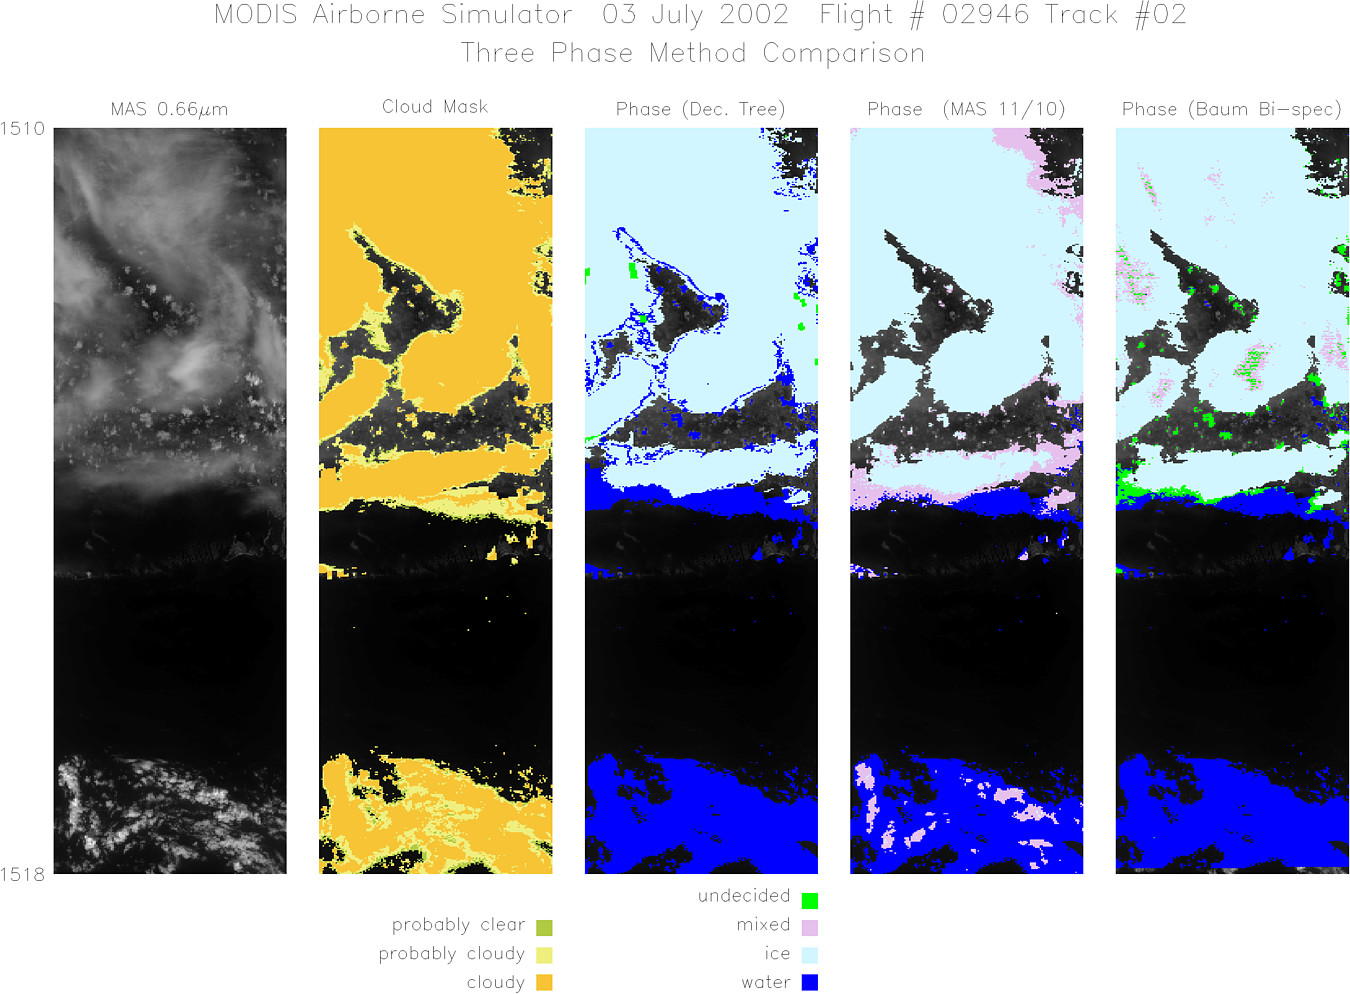
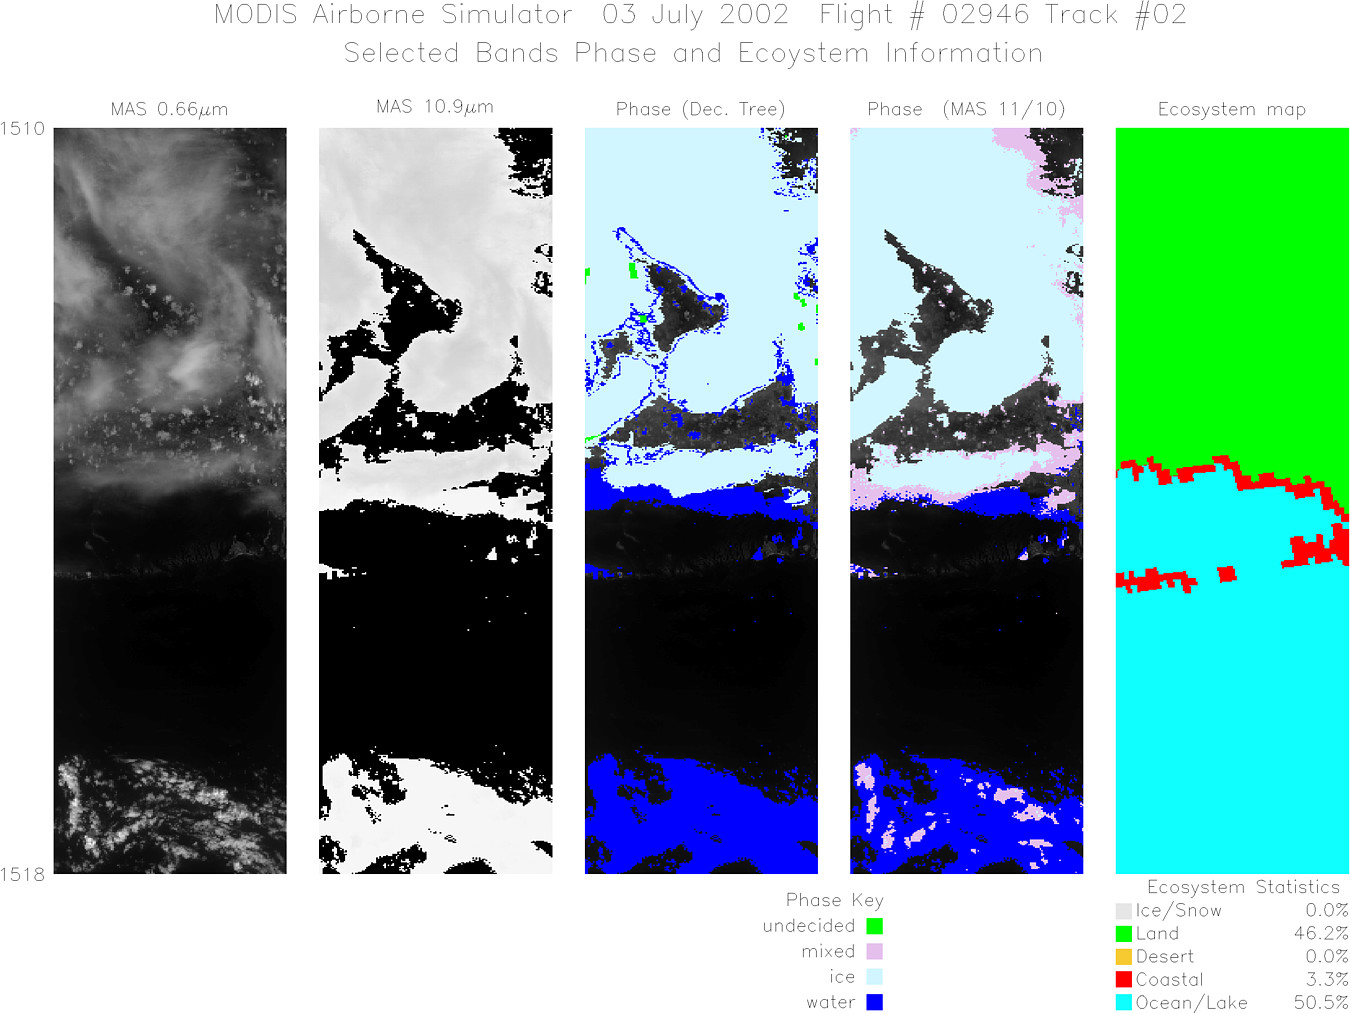
MODIS Airborne Simulator (MAS)
FLIGHT SUMMARY INFORMATION


|
Flight: 02-946 Date: 03 July 2002 Location: Gulf of Mexico / Florida / Atlantic Ocean Deployment: CRYSTAL-FACE Principal Investigators: Drs. Michael King & Steven Platnick (NASA GSFC) Additional Sensors: CoSSIR, CPL, CRS, Dropsondes, EDOP, JLH, MMS, MTP, RAMS, SSFR |
||||||||||||||||||||||||||||||||||||||||||||||||||||||||||||||||||||||||||||||||||||||||||||||||||||||||||||||||||||||||||||||
|
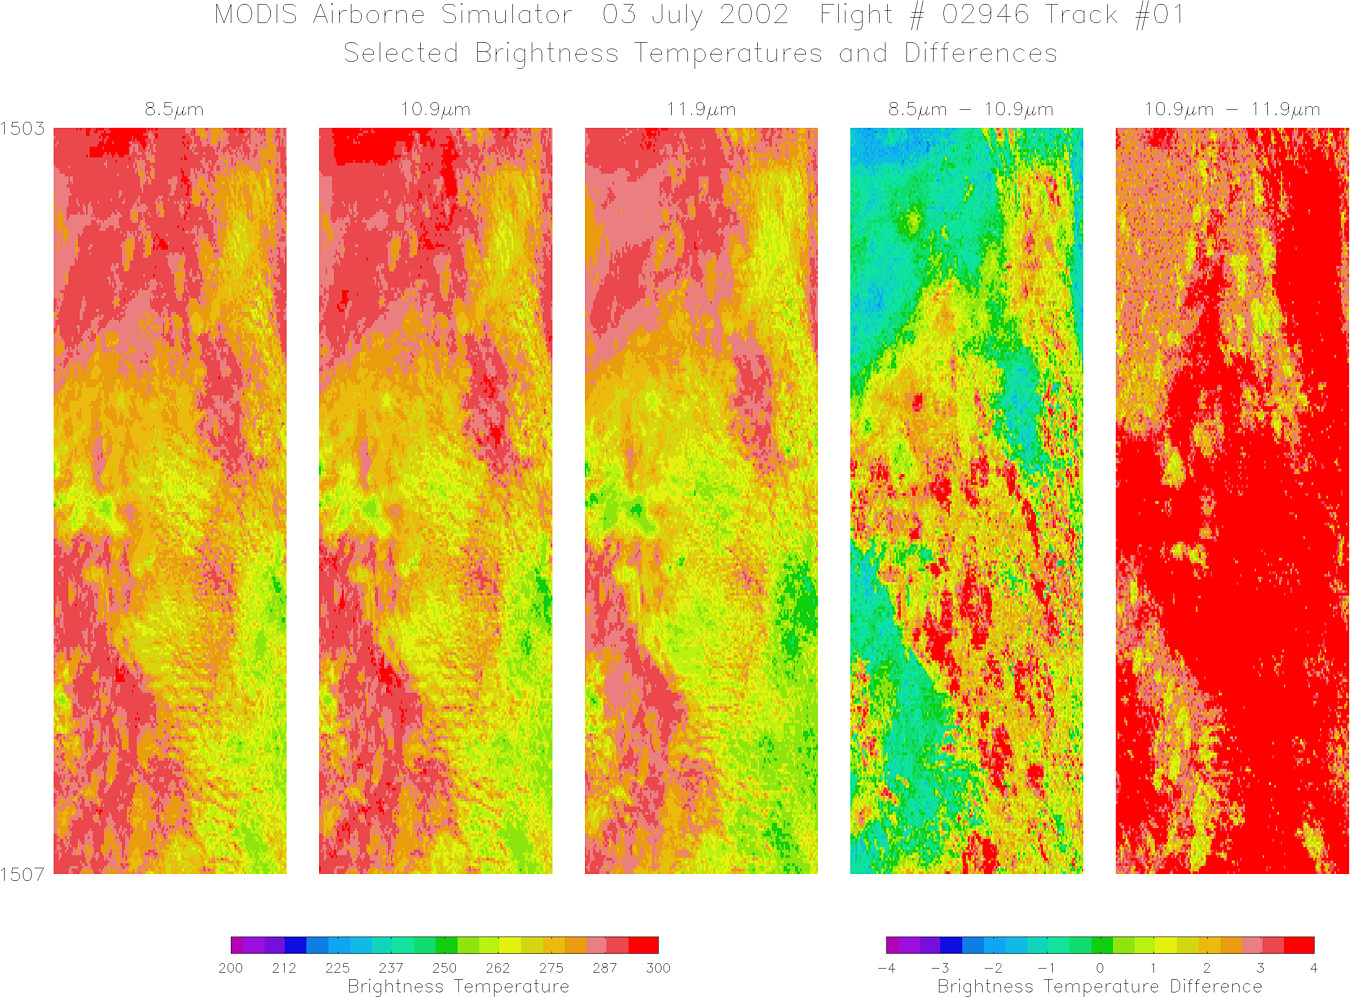
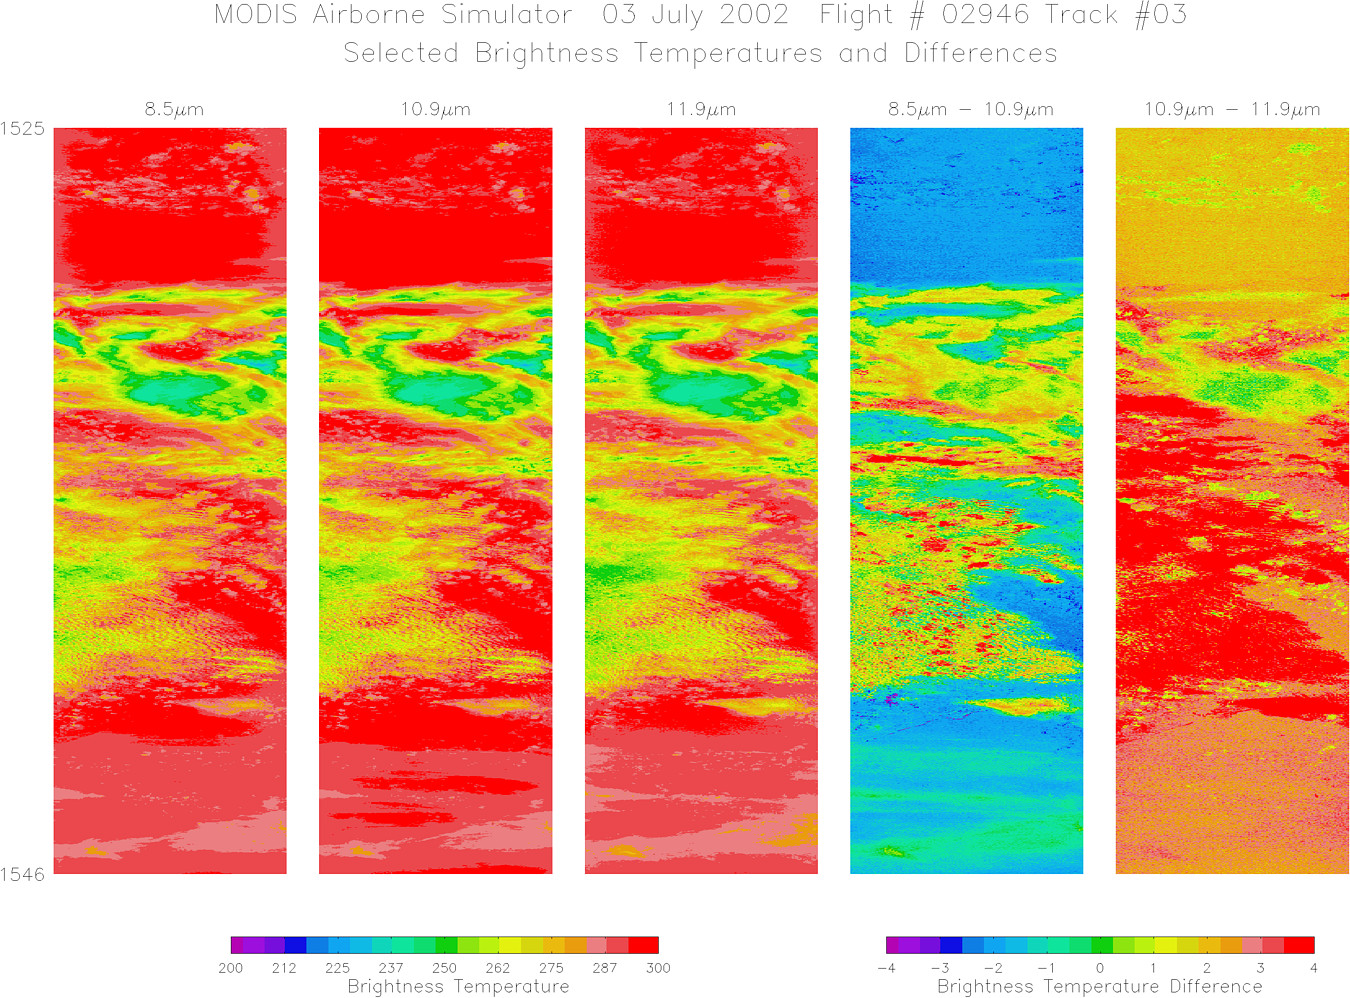
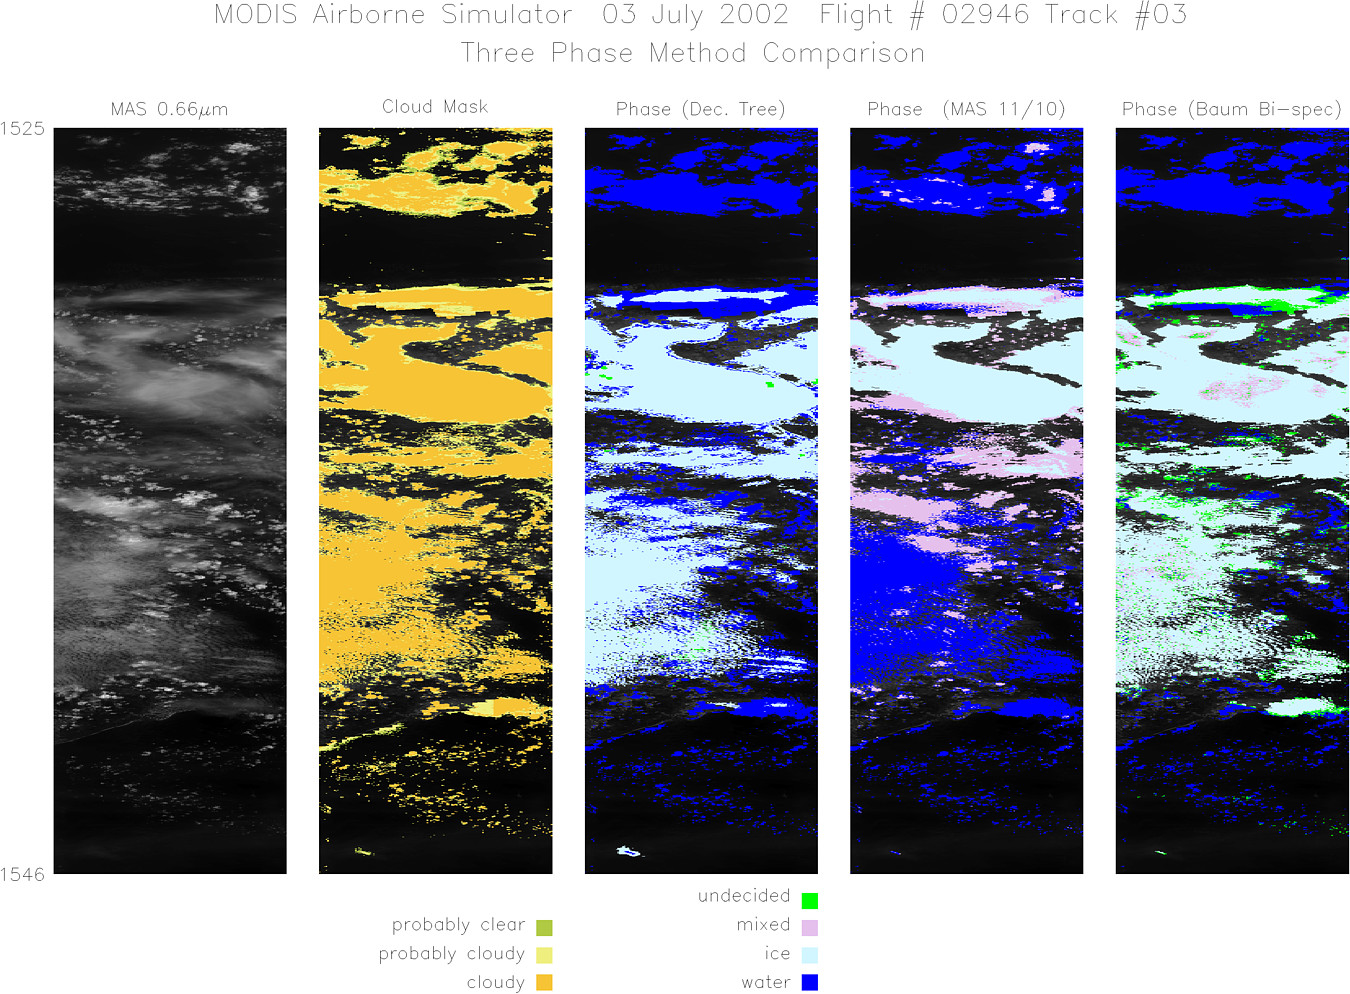
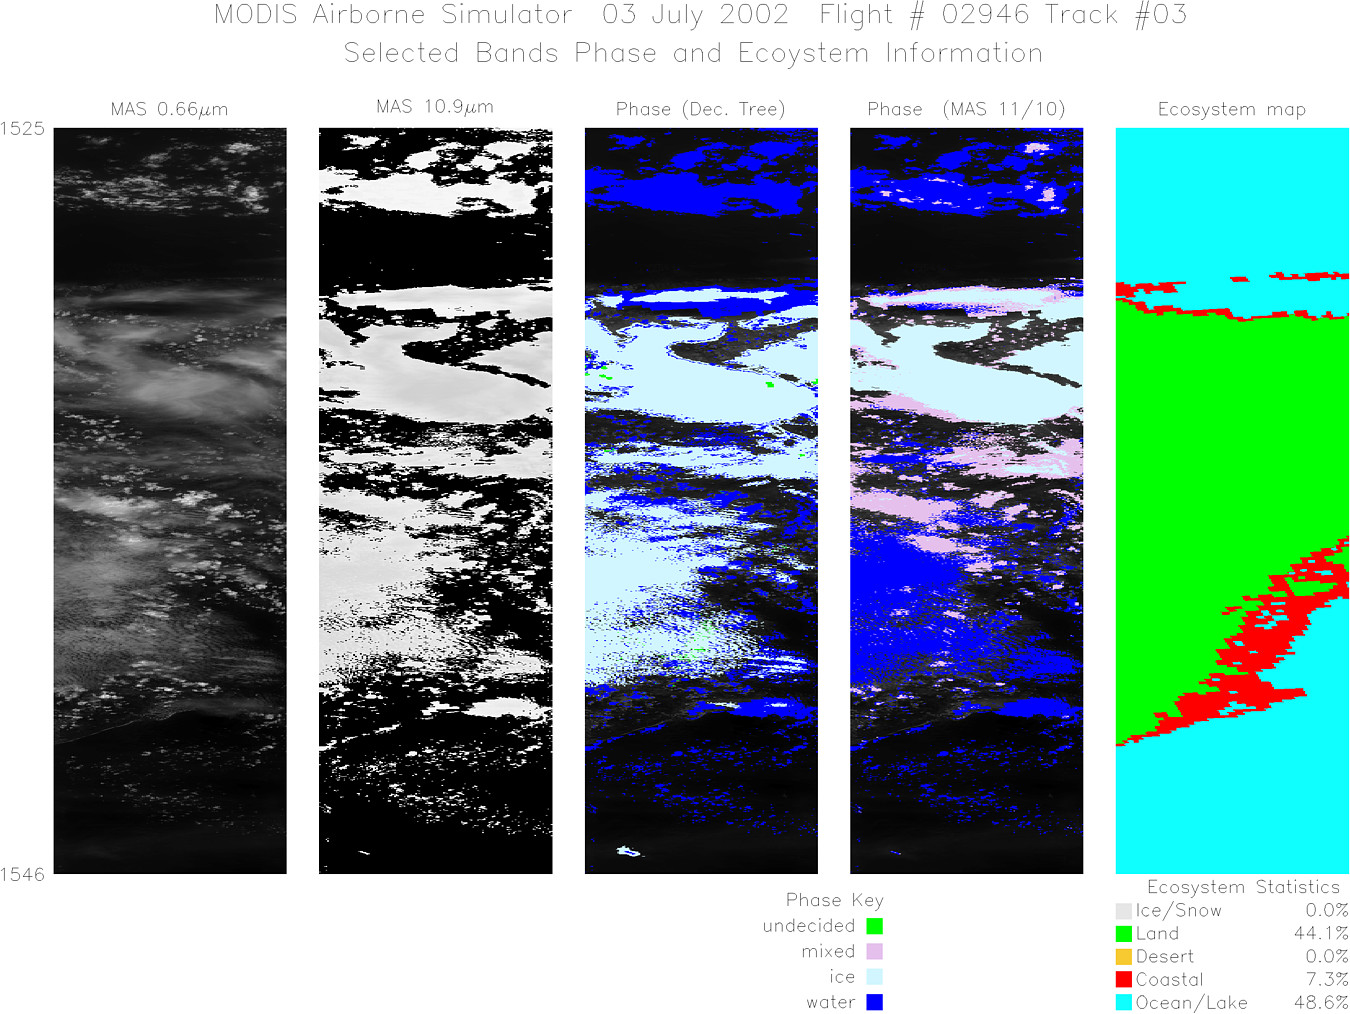
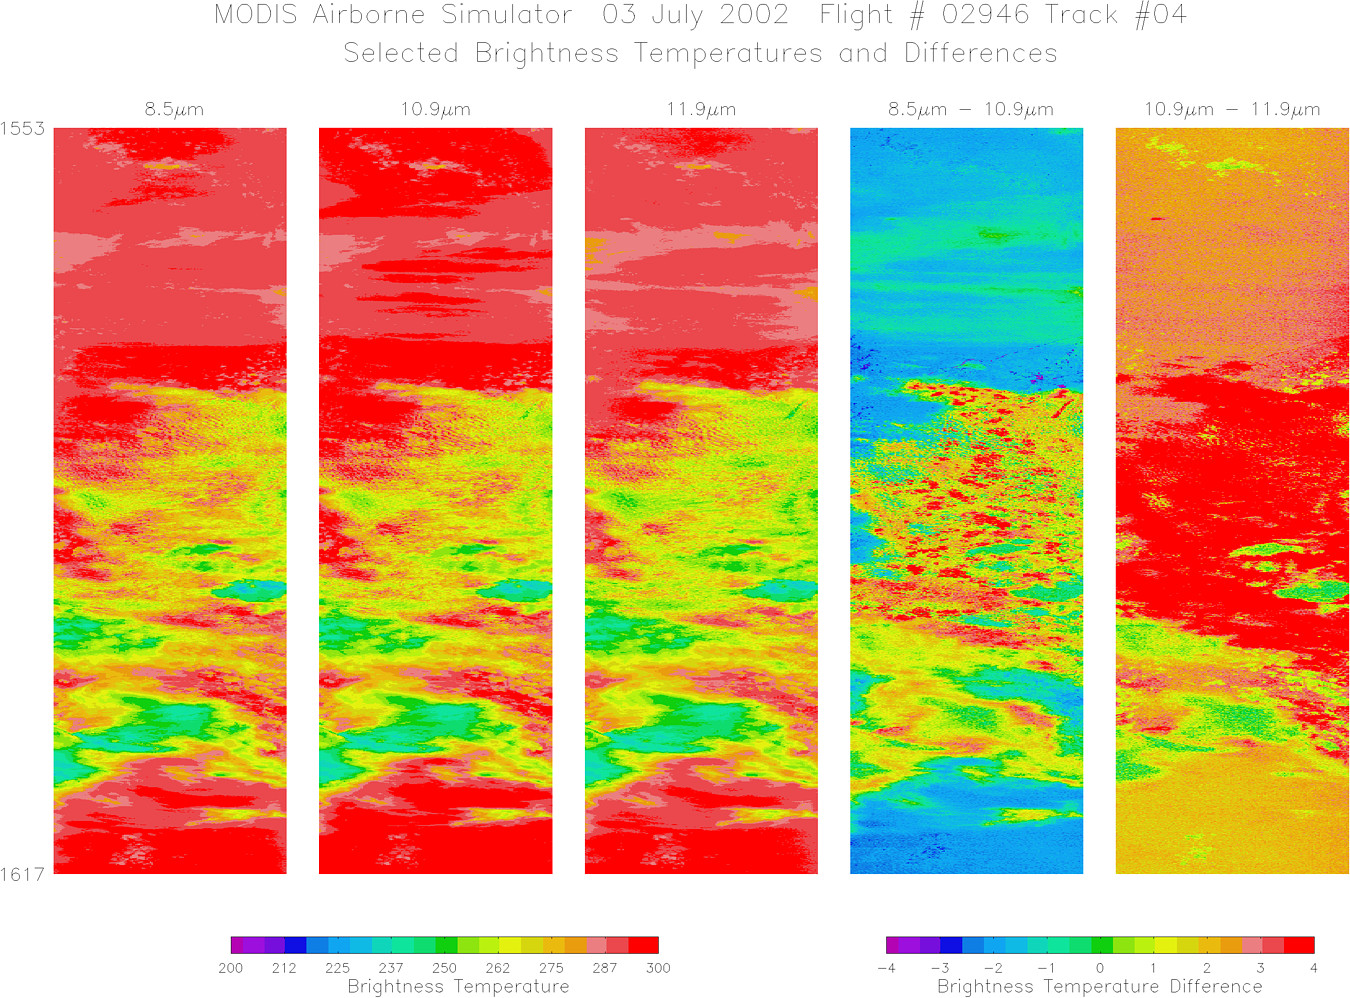
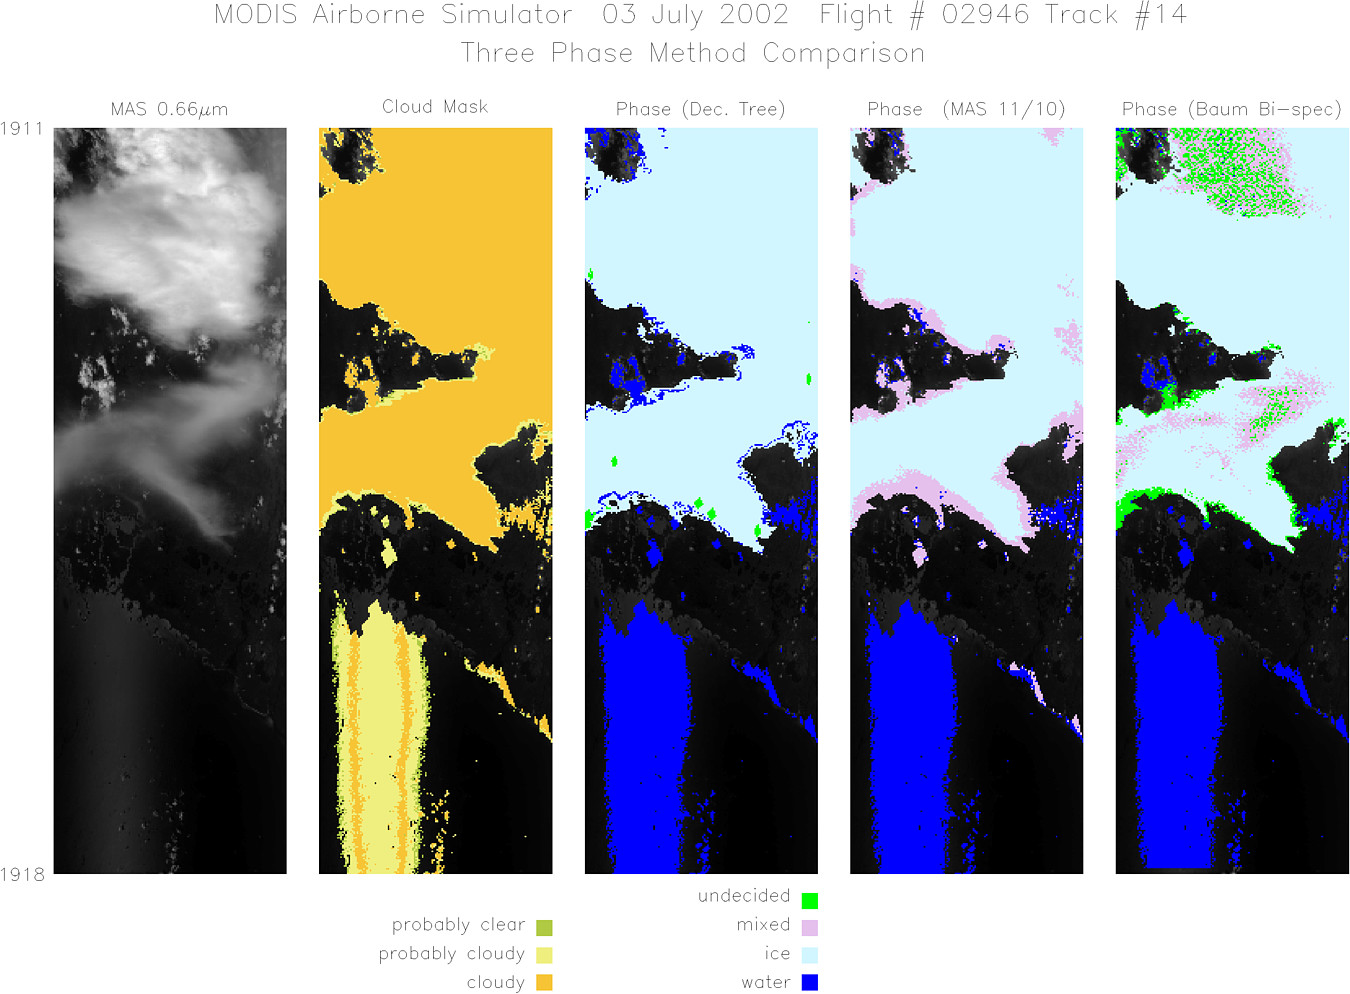
Data Evaluation 11µm channel had intermittent coherent noise AQUA Underflight @ 18:34 (MODIS non-functional; see note below) |
||||||||||||||||||||||||||||||||||||||||||||||||||||||||||||||||||||||||||||||||||||||||||||||||||||||||||||||||||||||||||||||
|
Processing Information Level-1B Data in HDF format is available Flight Line Summary Spectral Band Configuration Spectral Response Function Table |
||||||||||||||||||||||||||||||||||||||||||||||||||||||||||||||||||||||||||||||||||||||||||||||||||||||||||||||||||||||||||||||
|
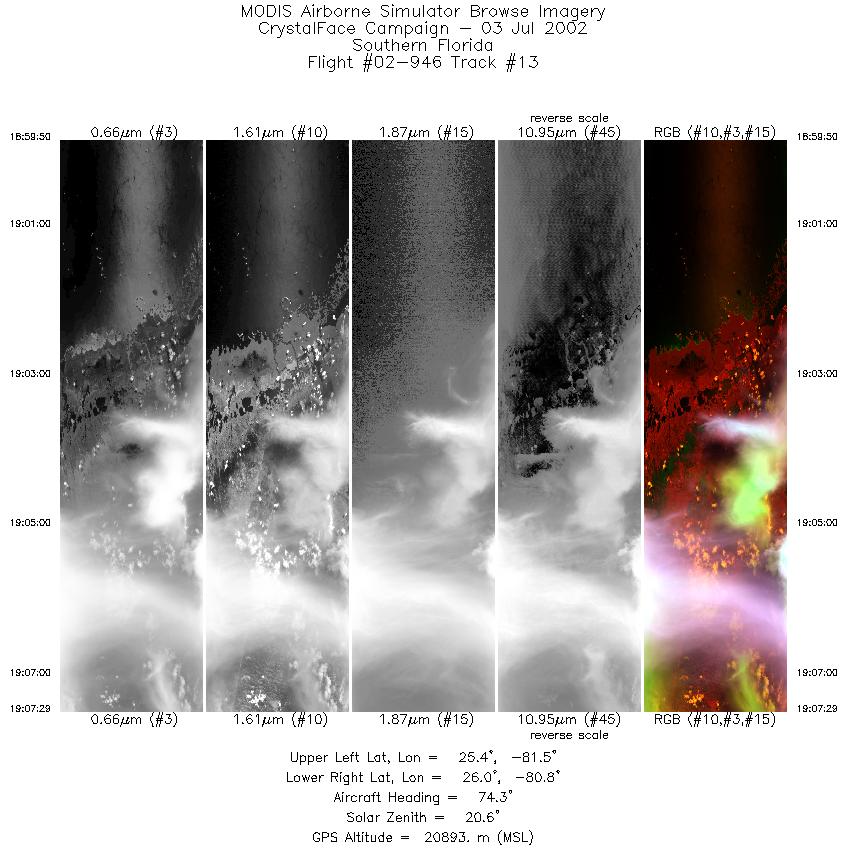
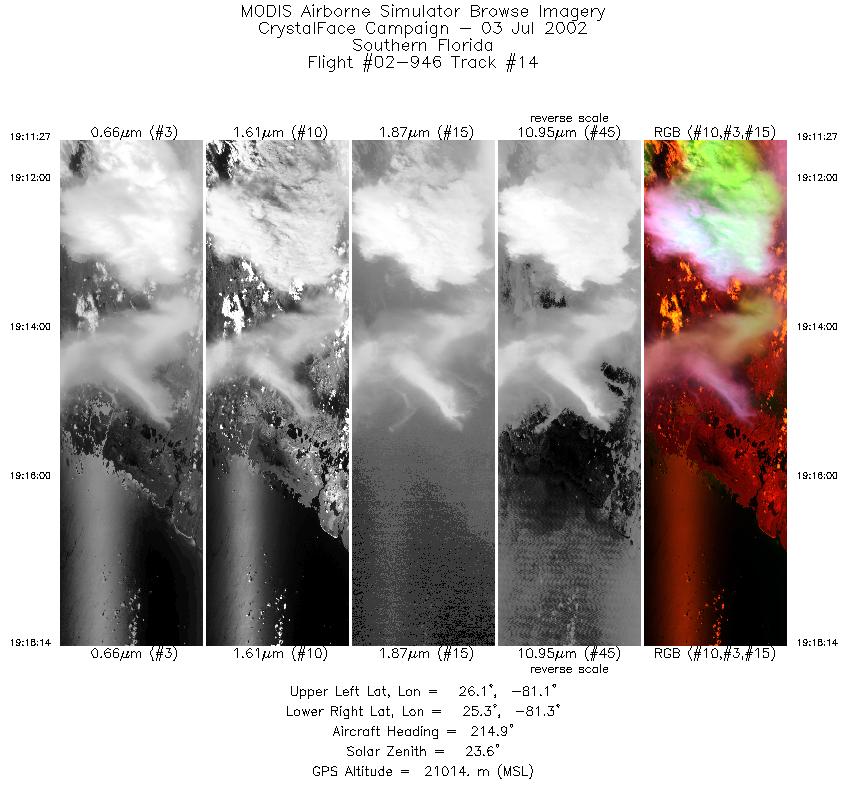
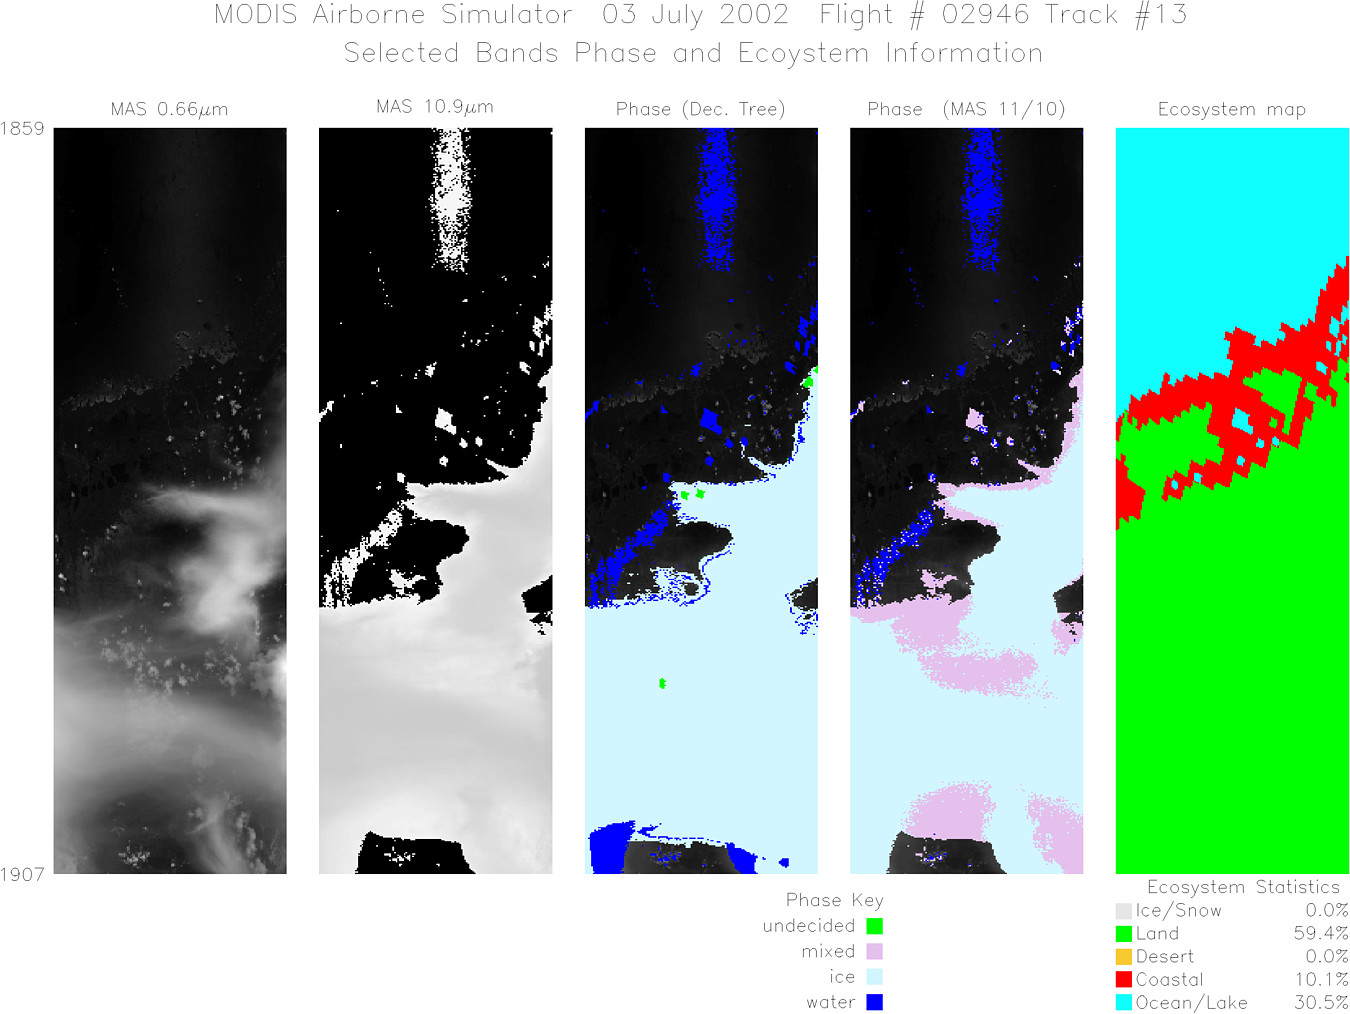
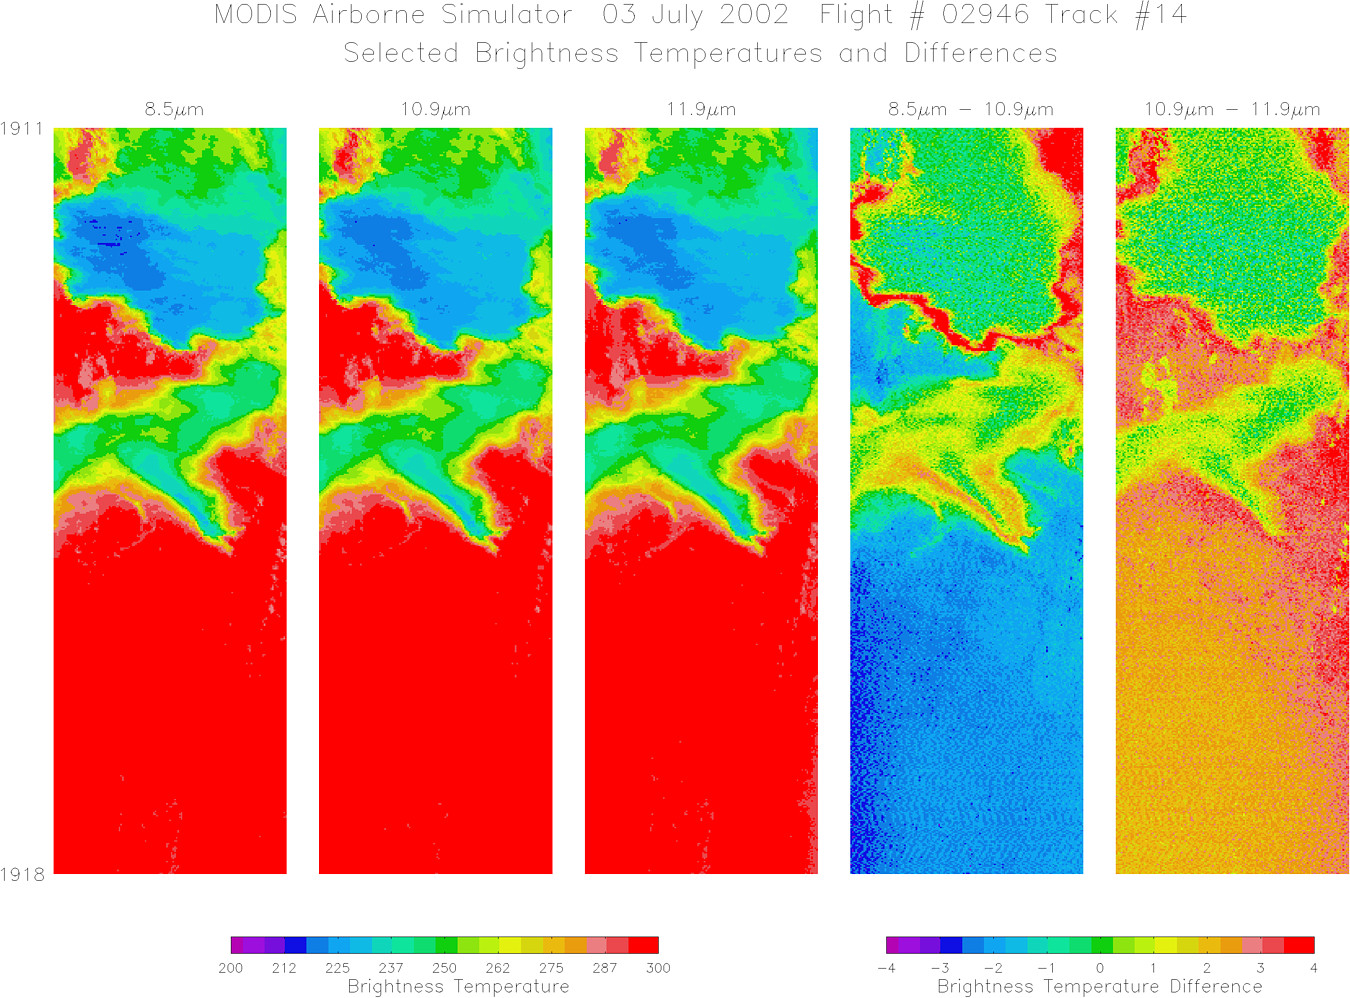
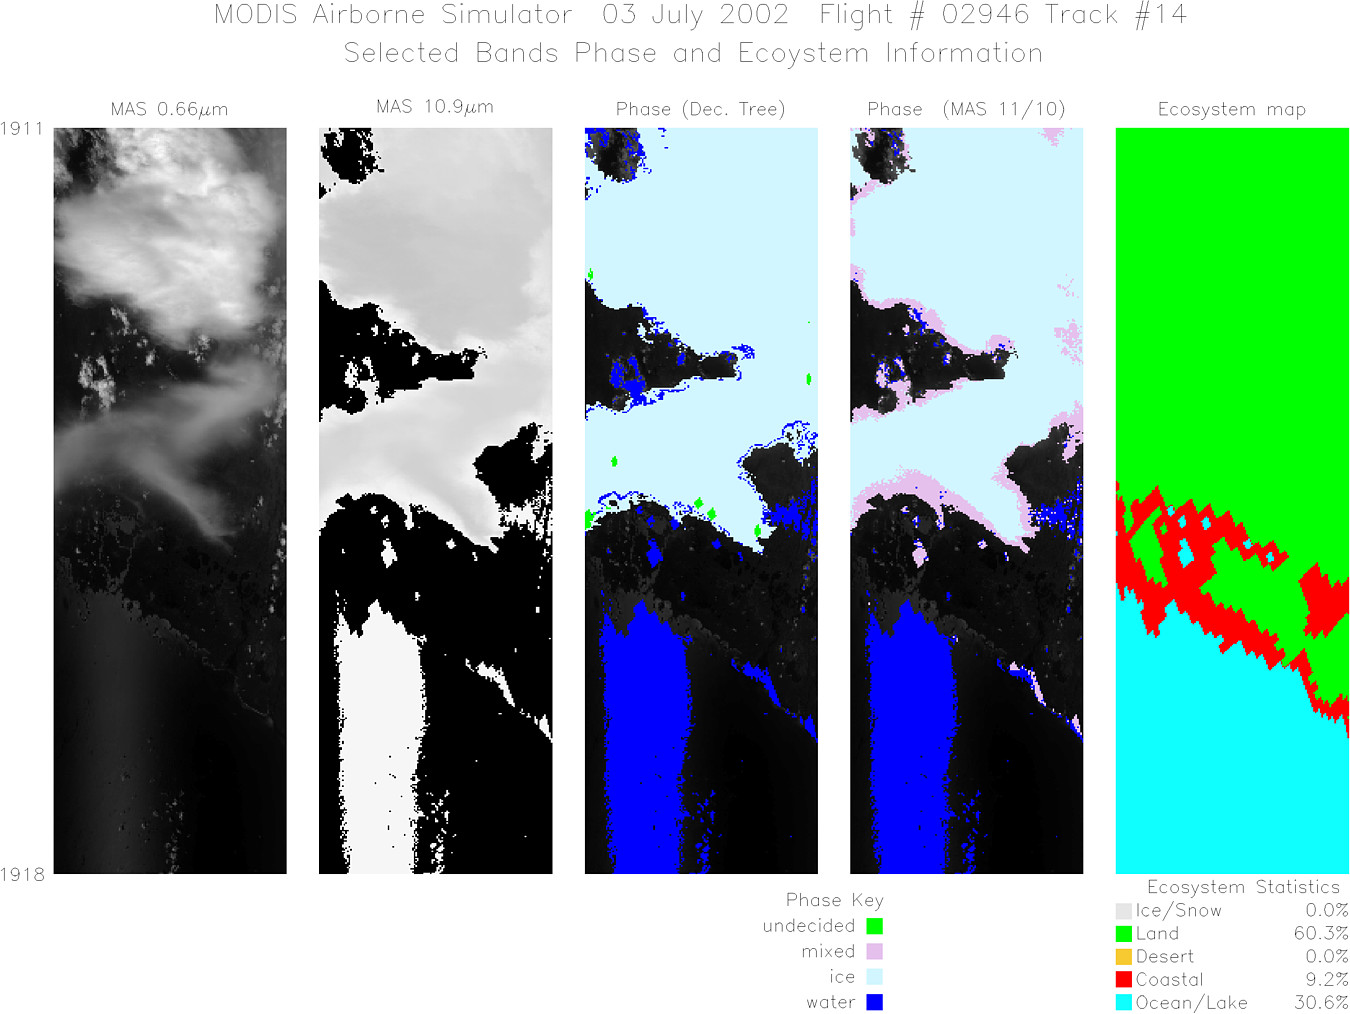
Browse Imagery Flight Tracks: 14 Scanlines: 71925 |
||||||||||||||||||||||||||||||||||||||||||||||||||||||||||||||||||||||||||||||||||||||||||||||||||||||||||||||||||||||||||||||
|
||||||||||||||||||||||||||||||||||||||||||||||||||||||||||||||||||||||||||||||||||||||||||||||||||||||||||||||||||||||||||||||
|
||||||||||||||||||||||||||||||||||||||||||||||||||||||||||||||||||||||||||||||||||||||||||||||||||||||||||||||||||||||||||||||
|
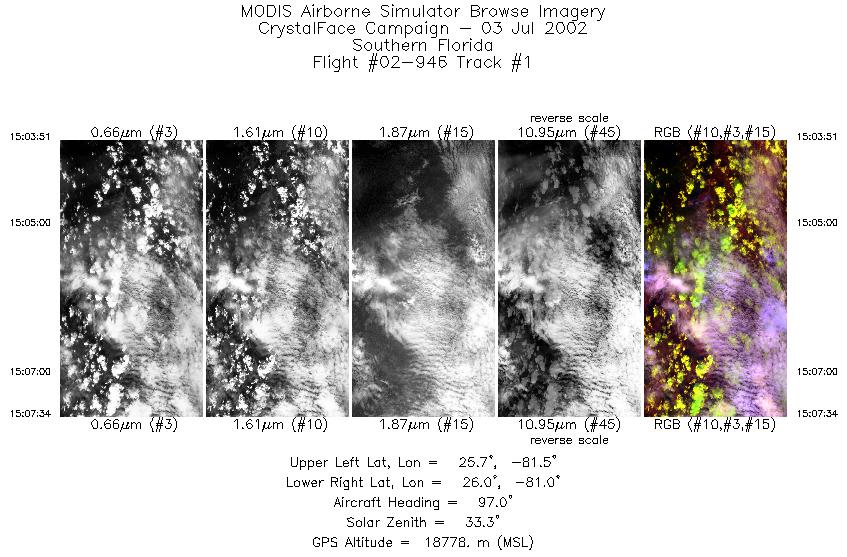
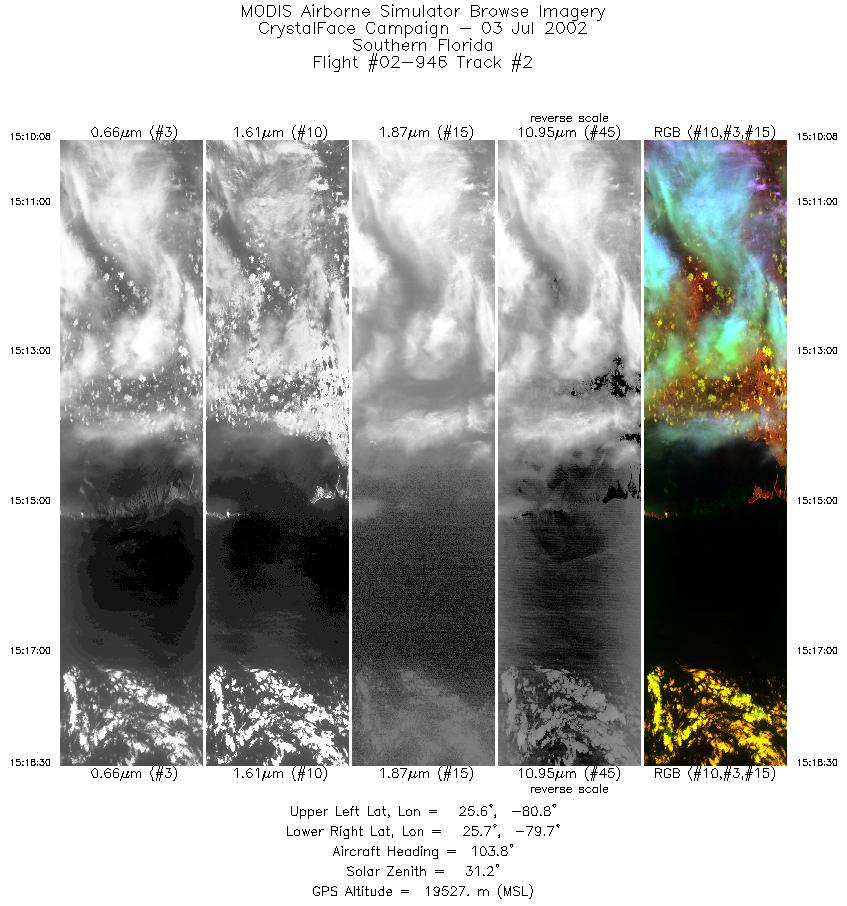
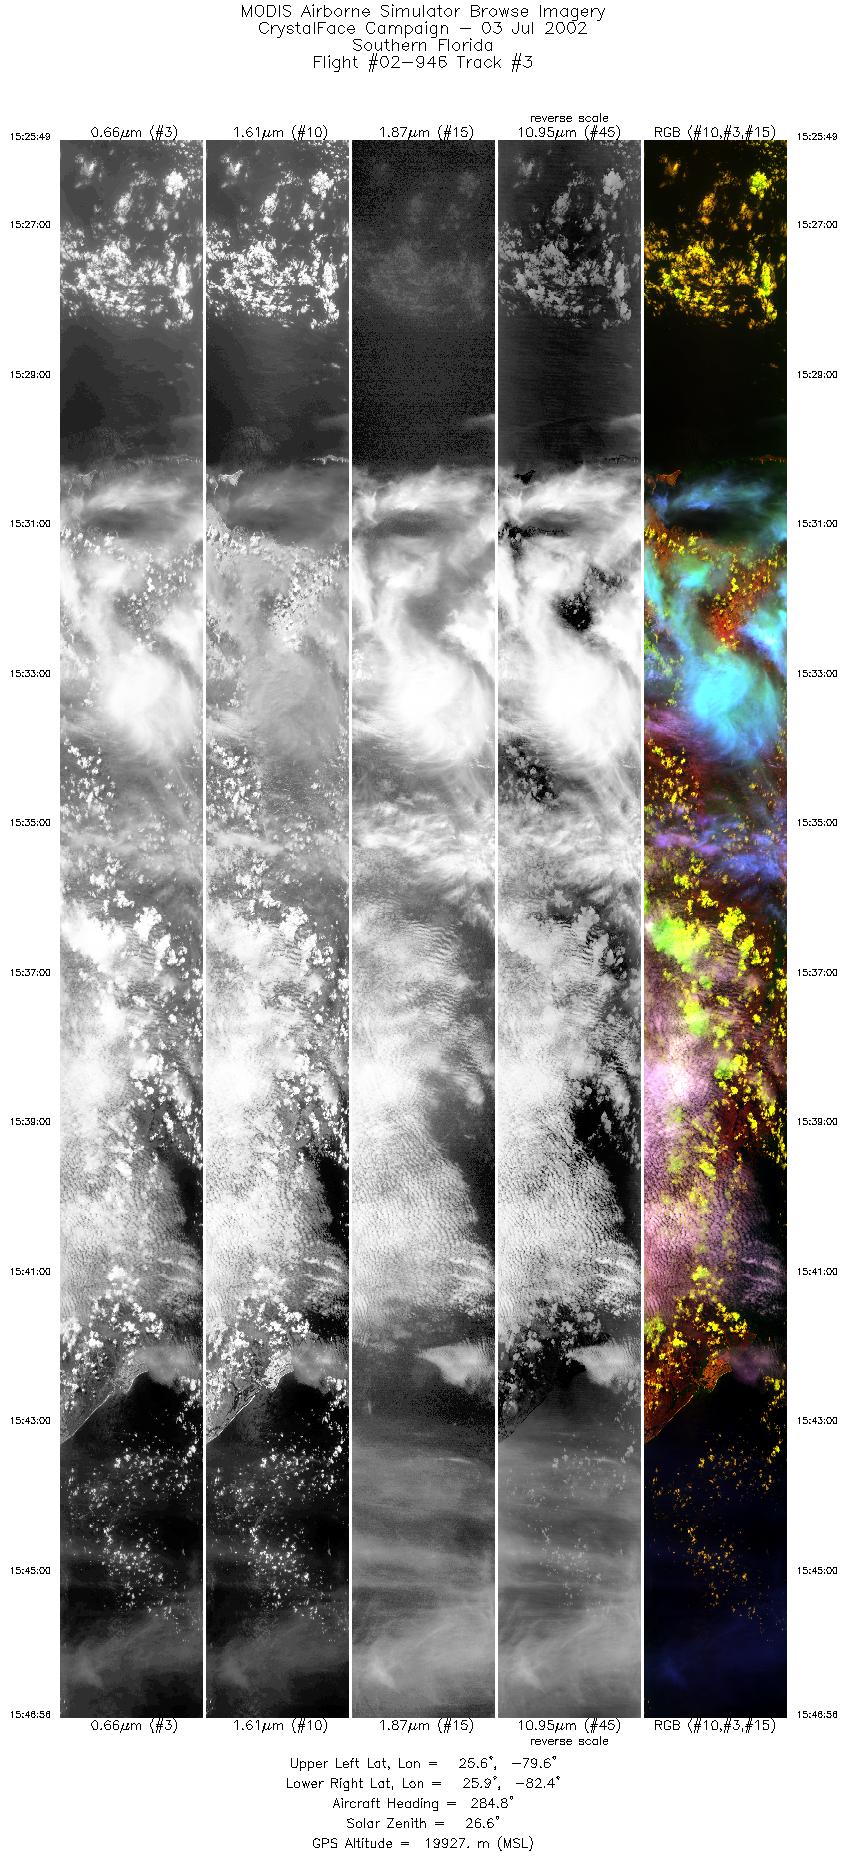
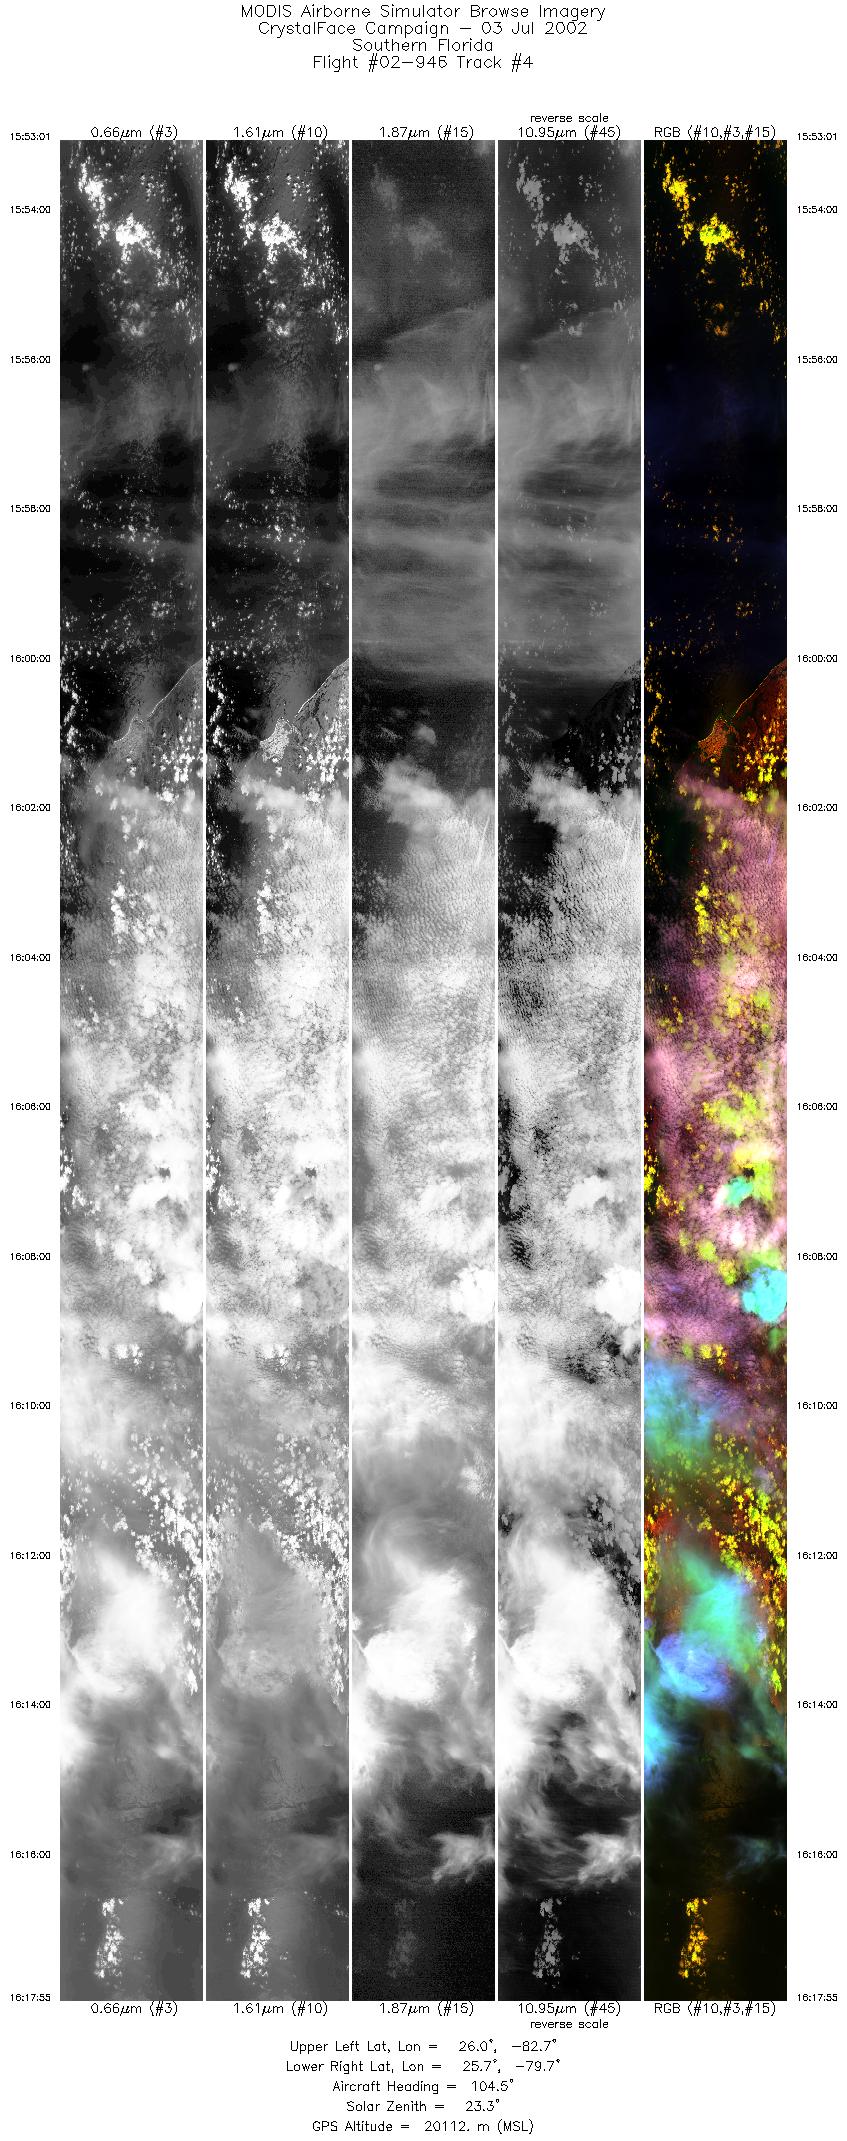
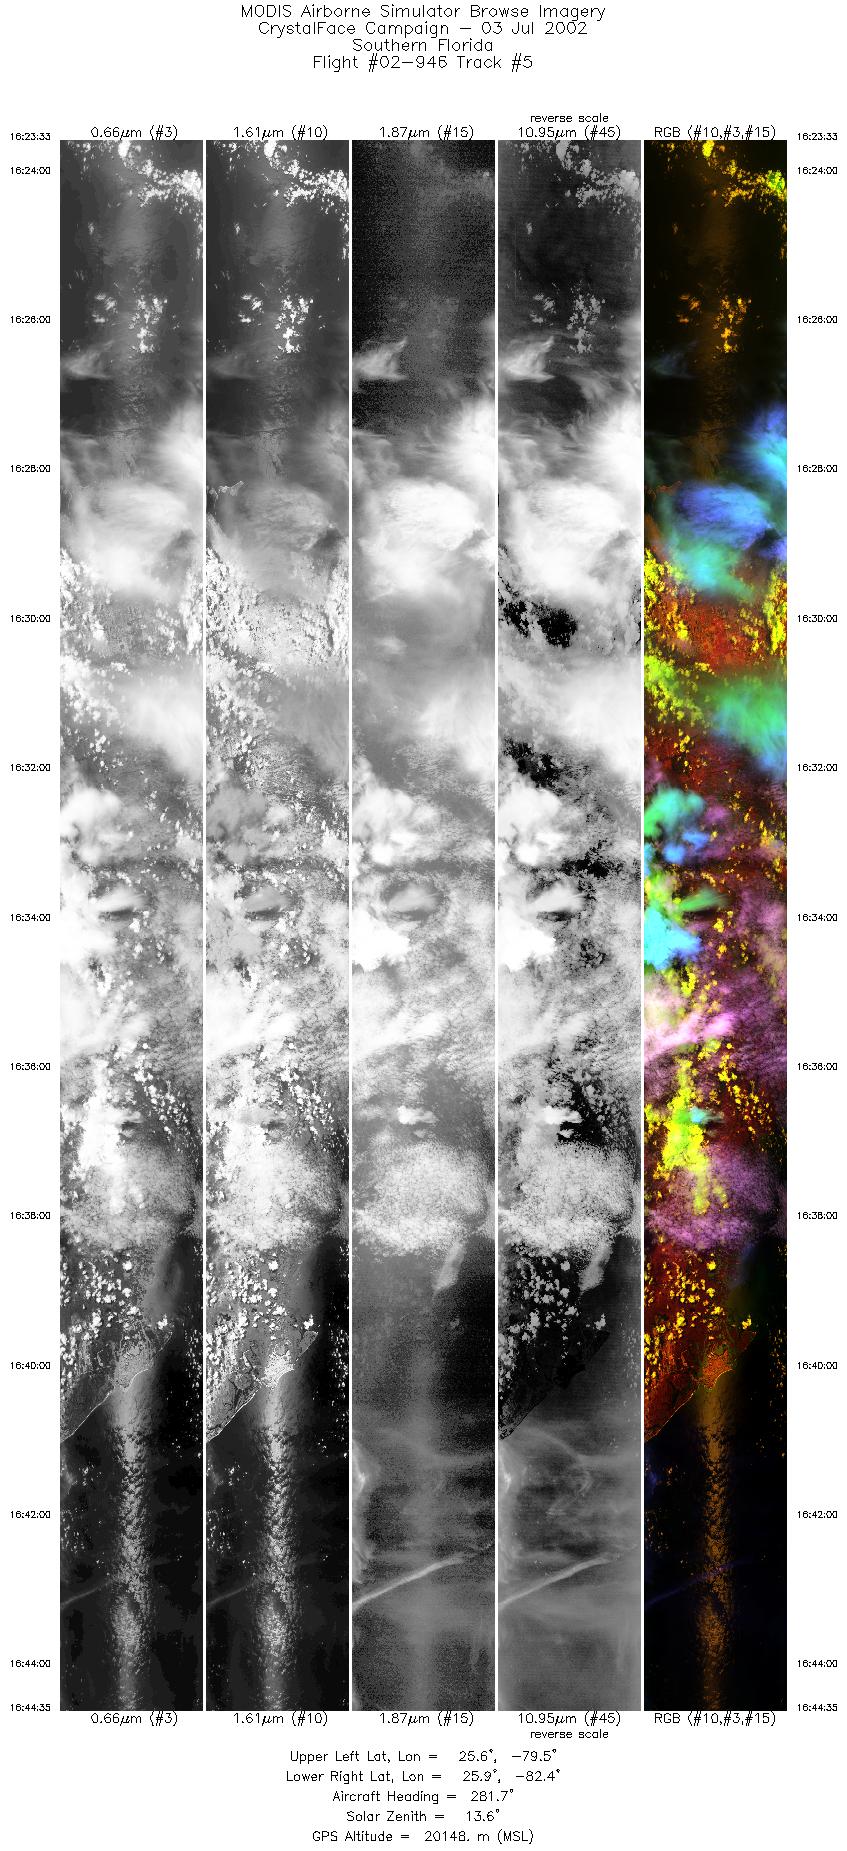
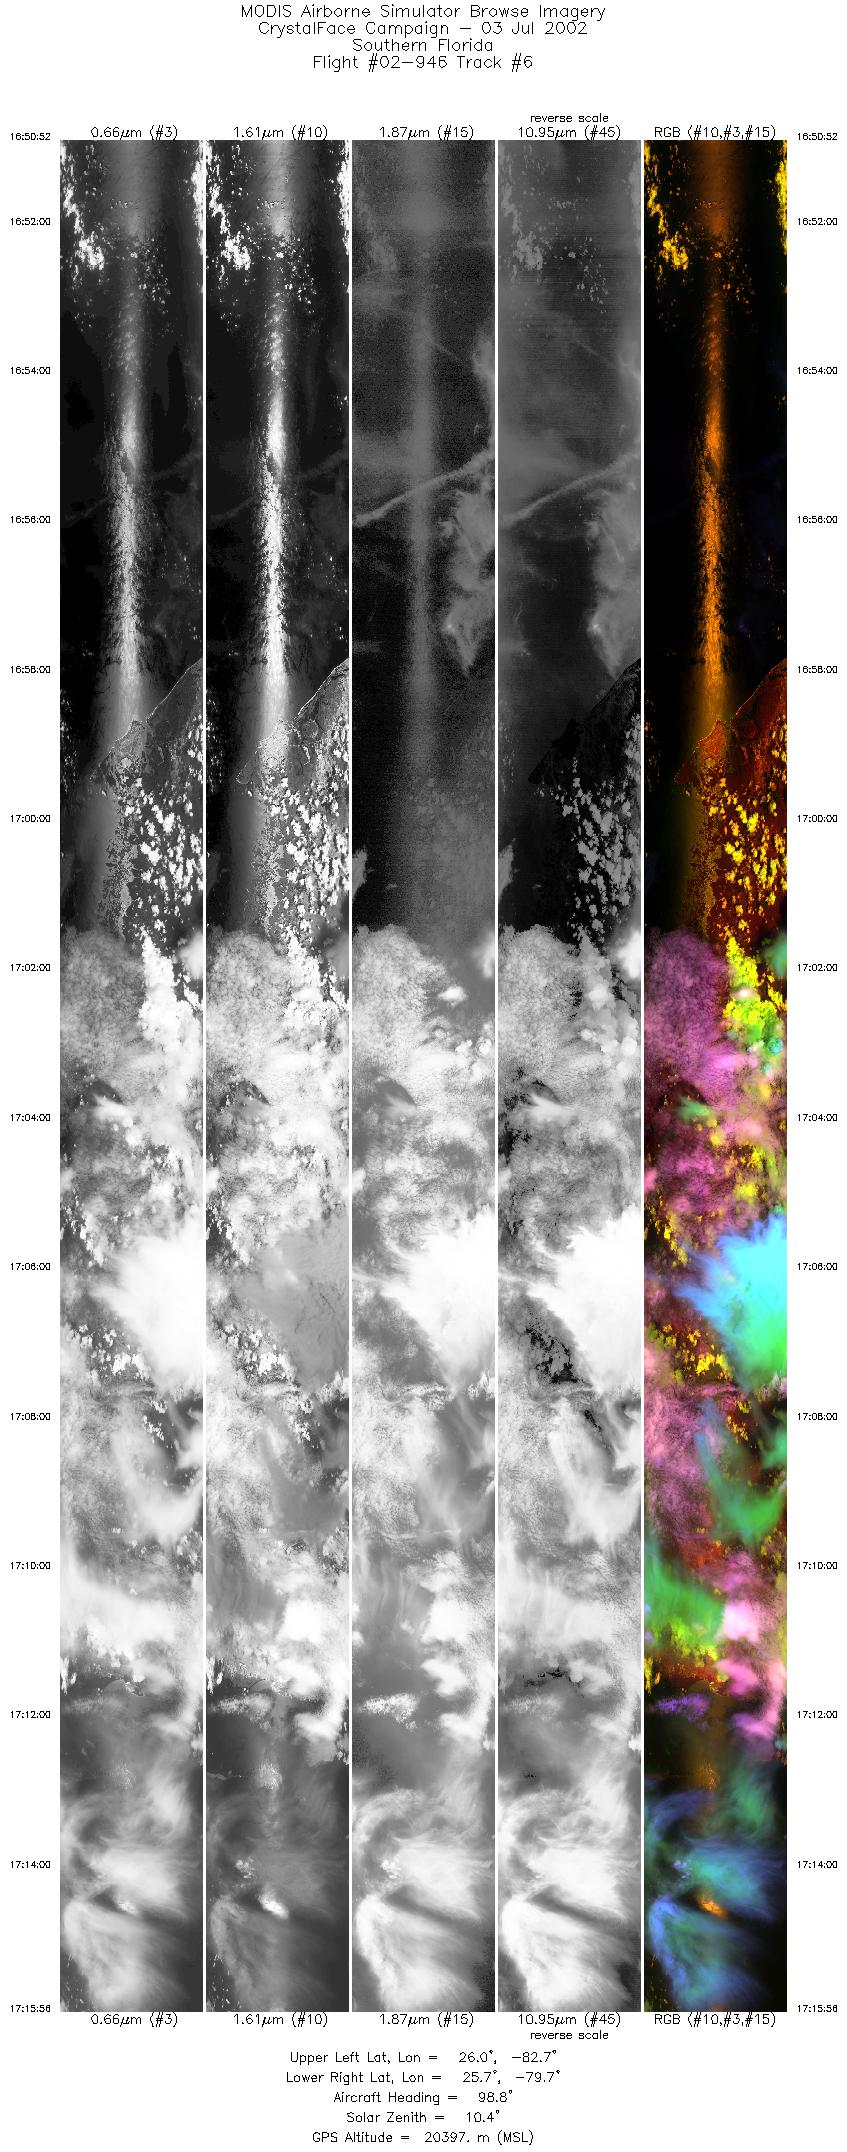
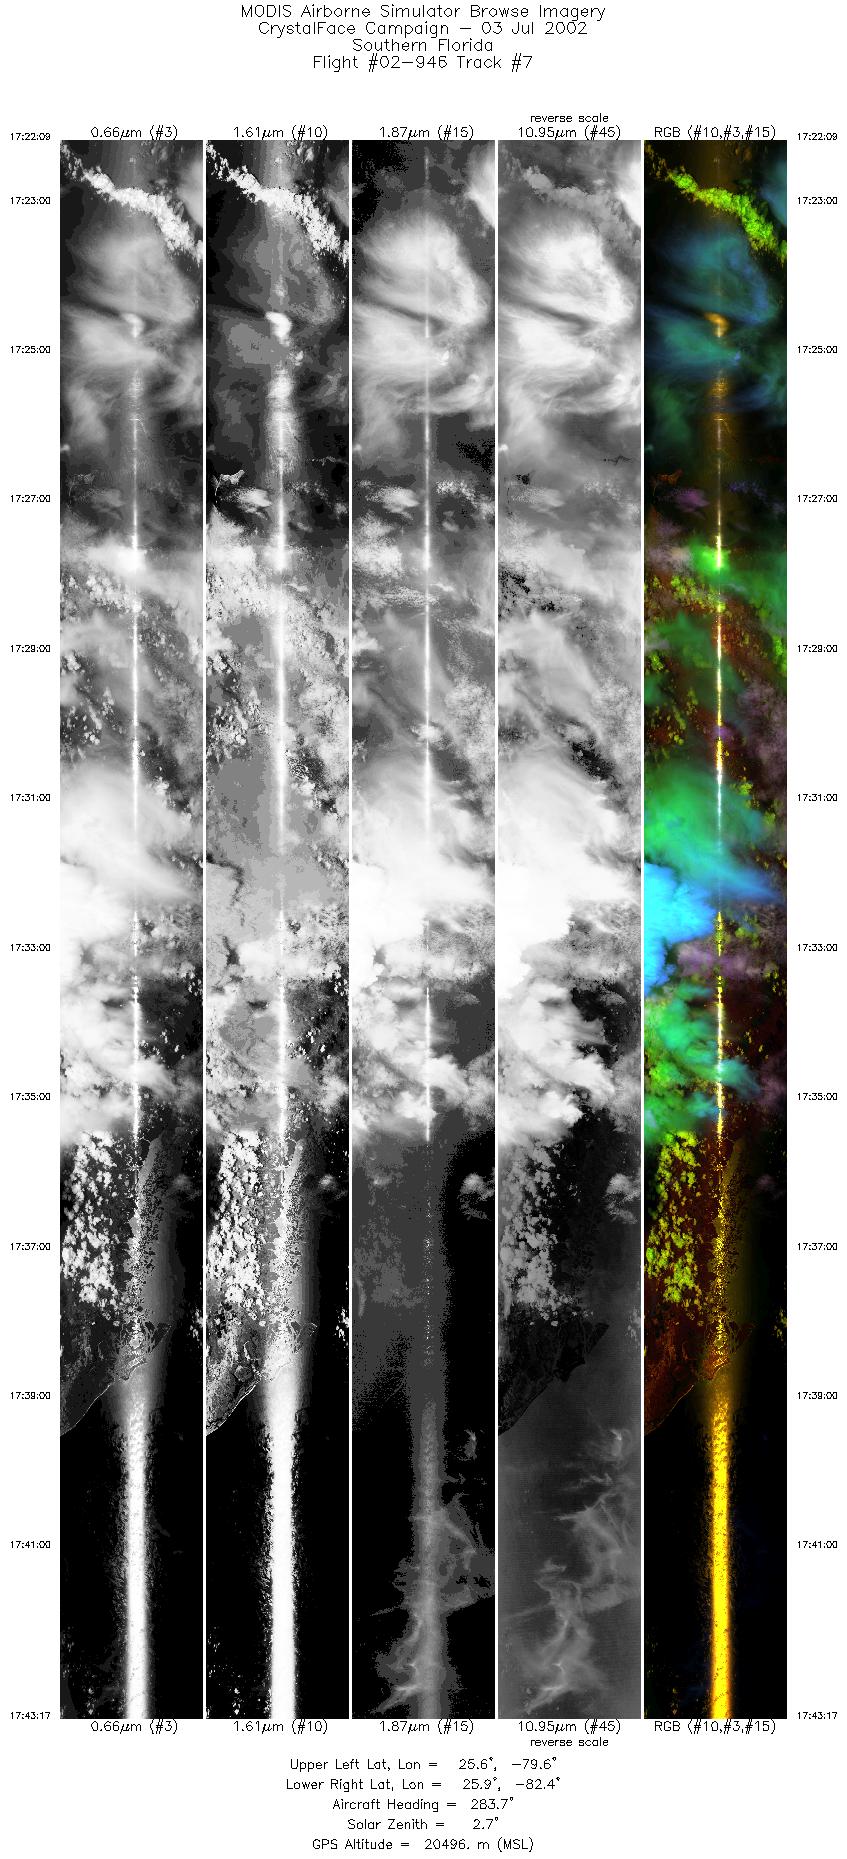
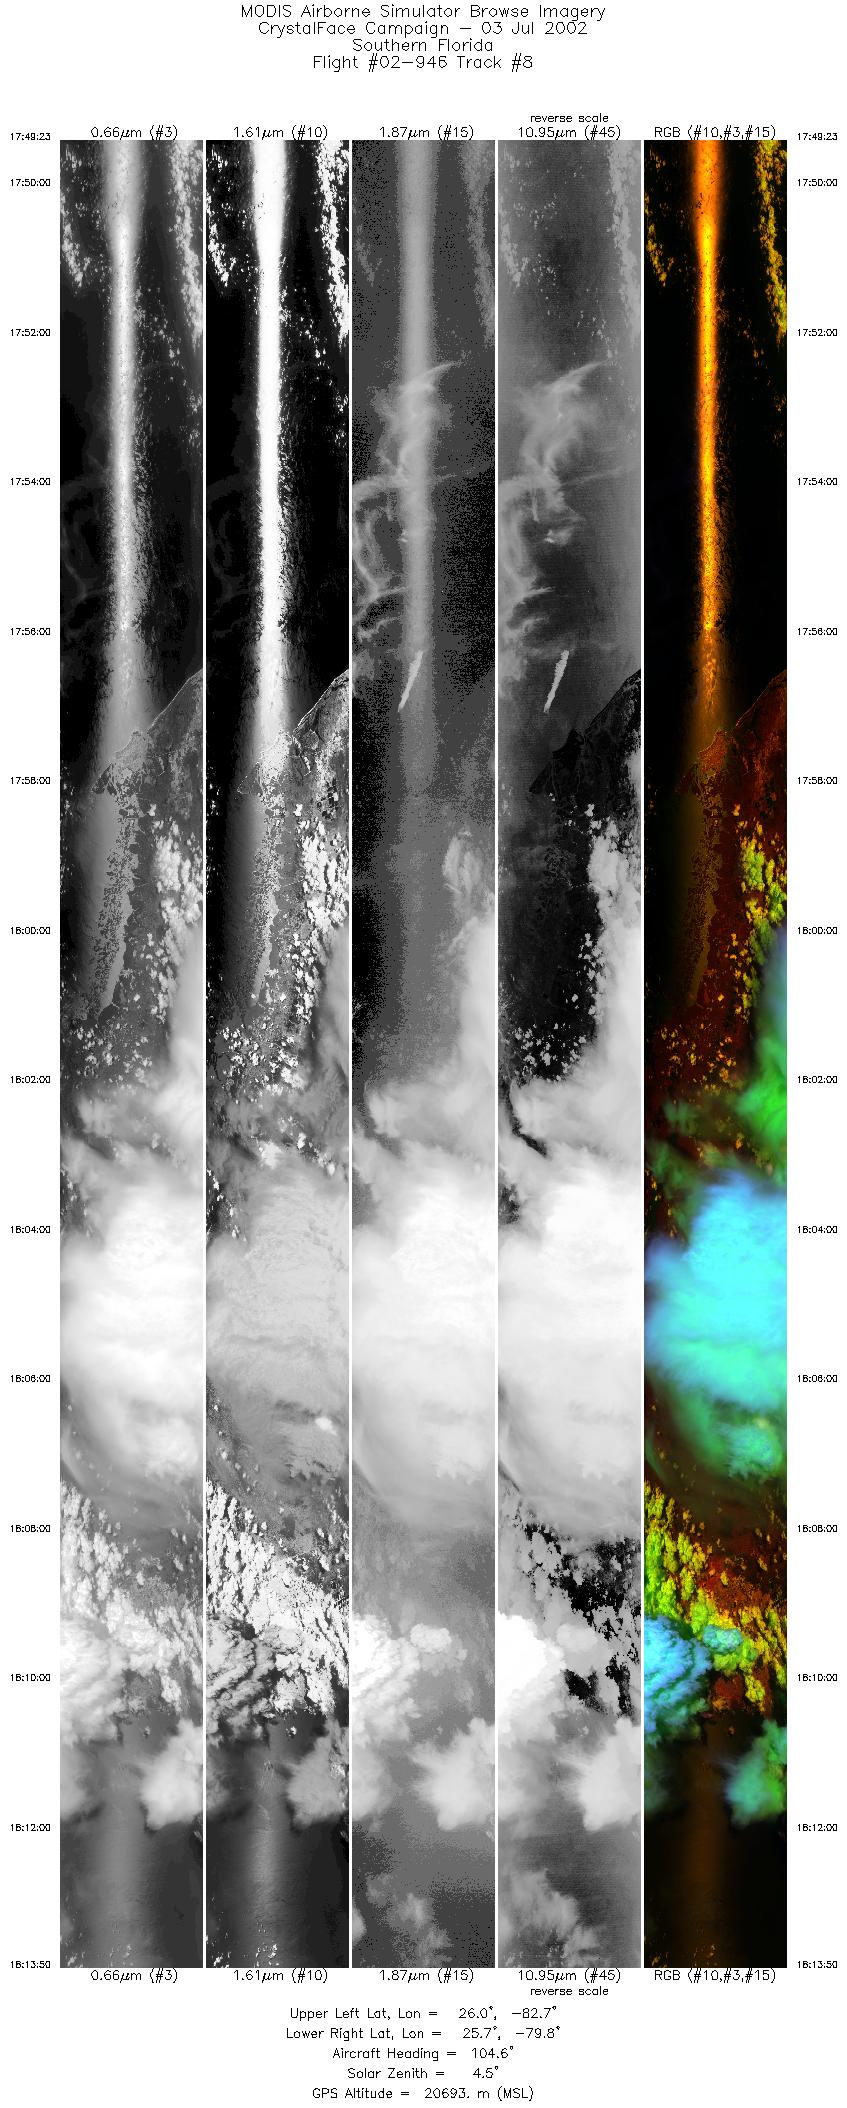
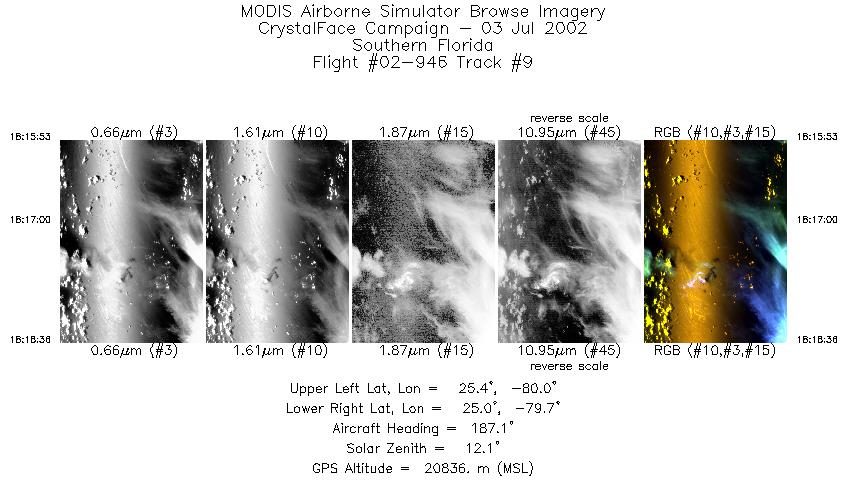
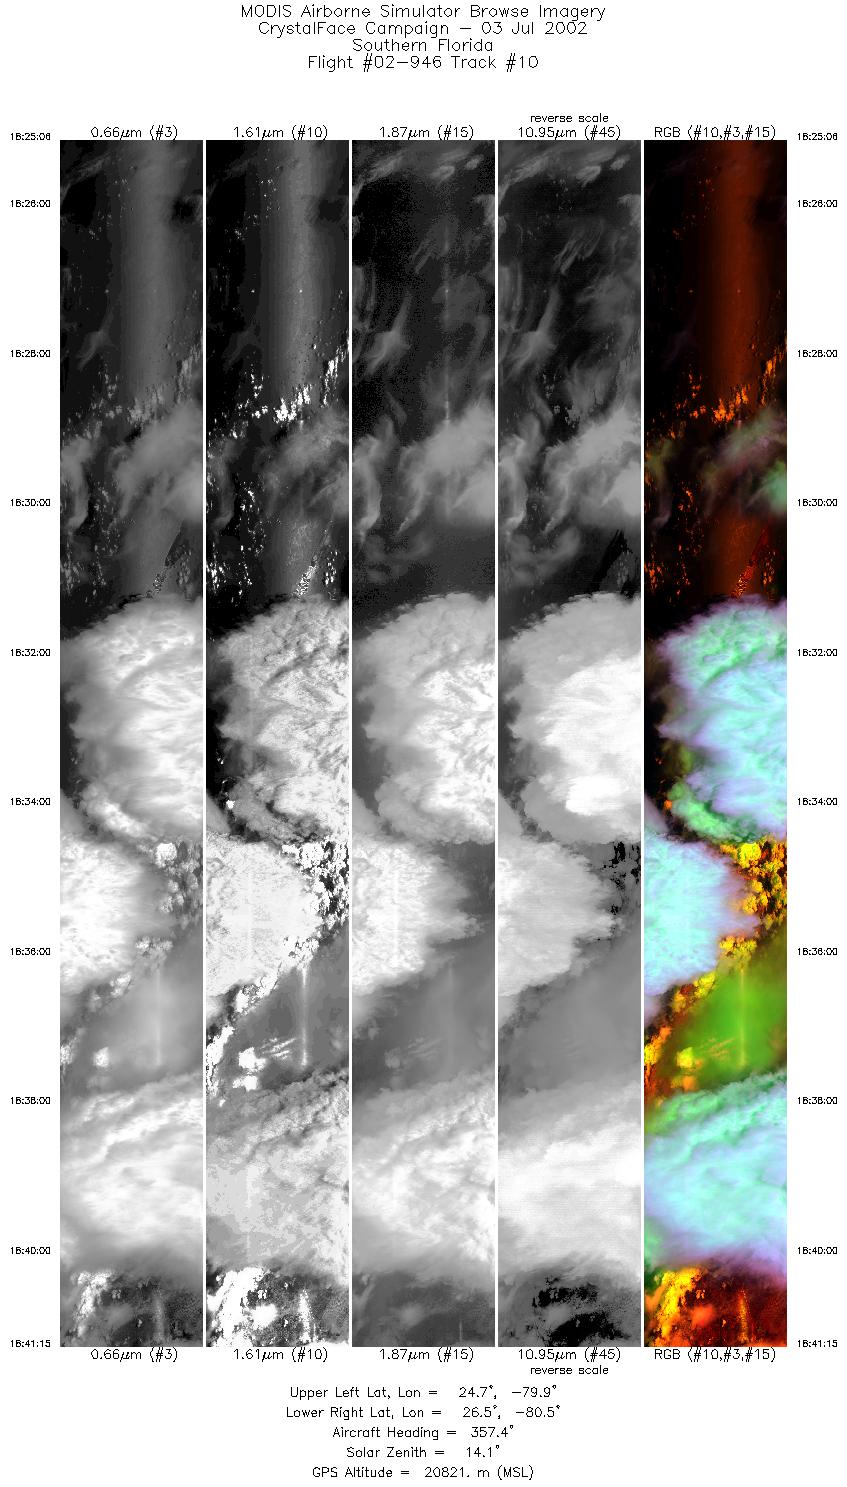
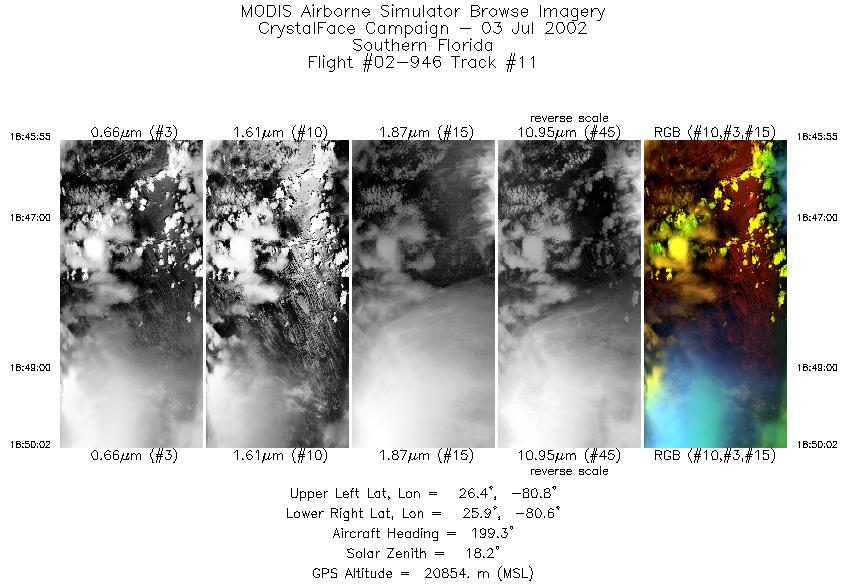
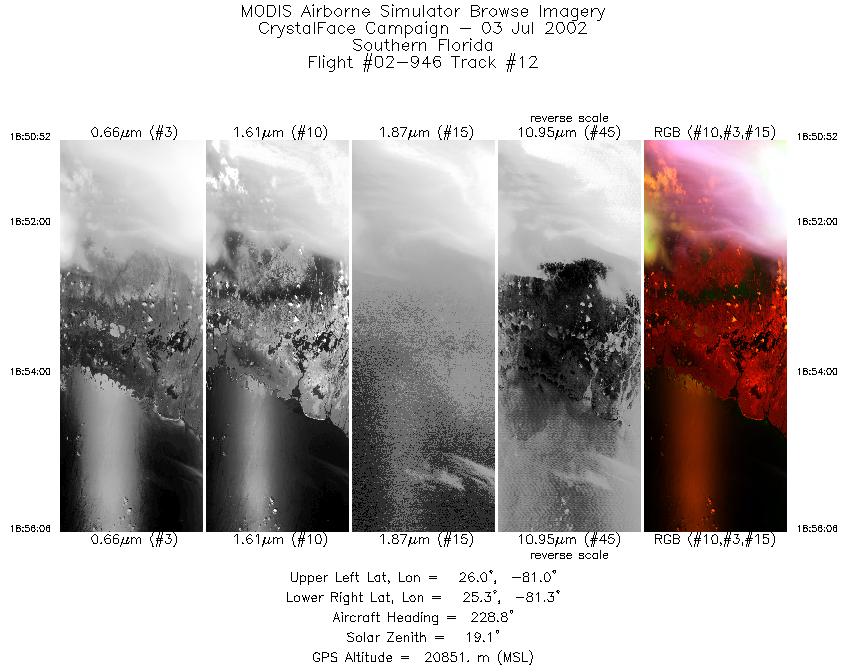
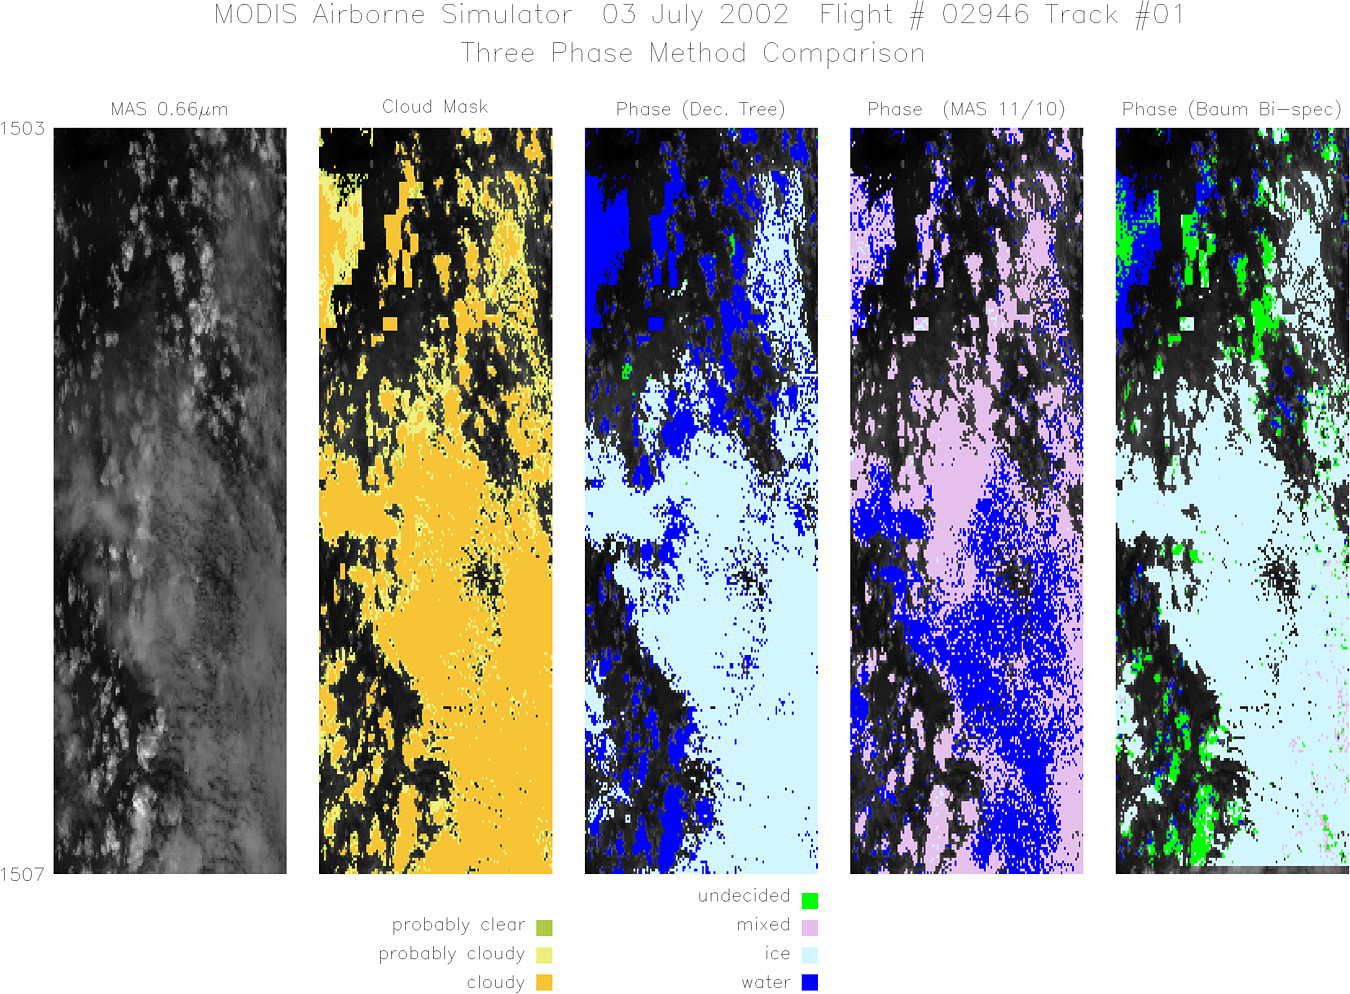
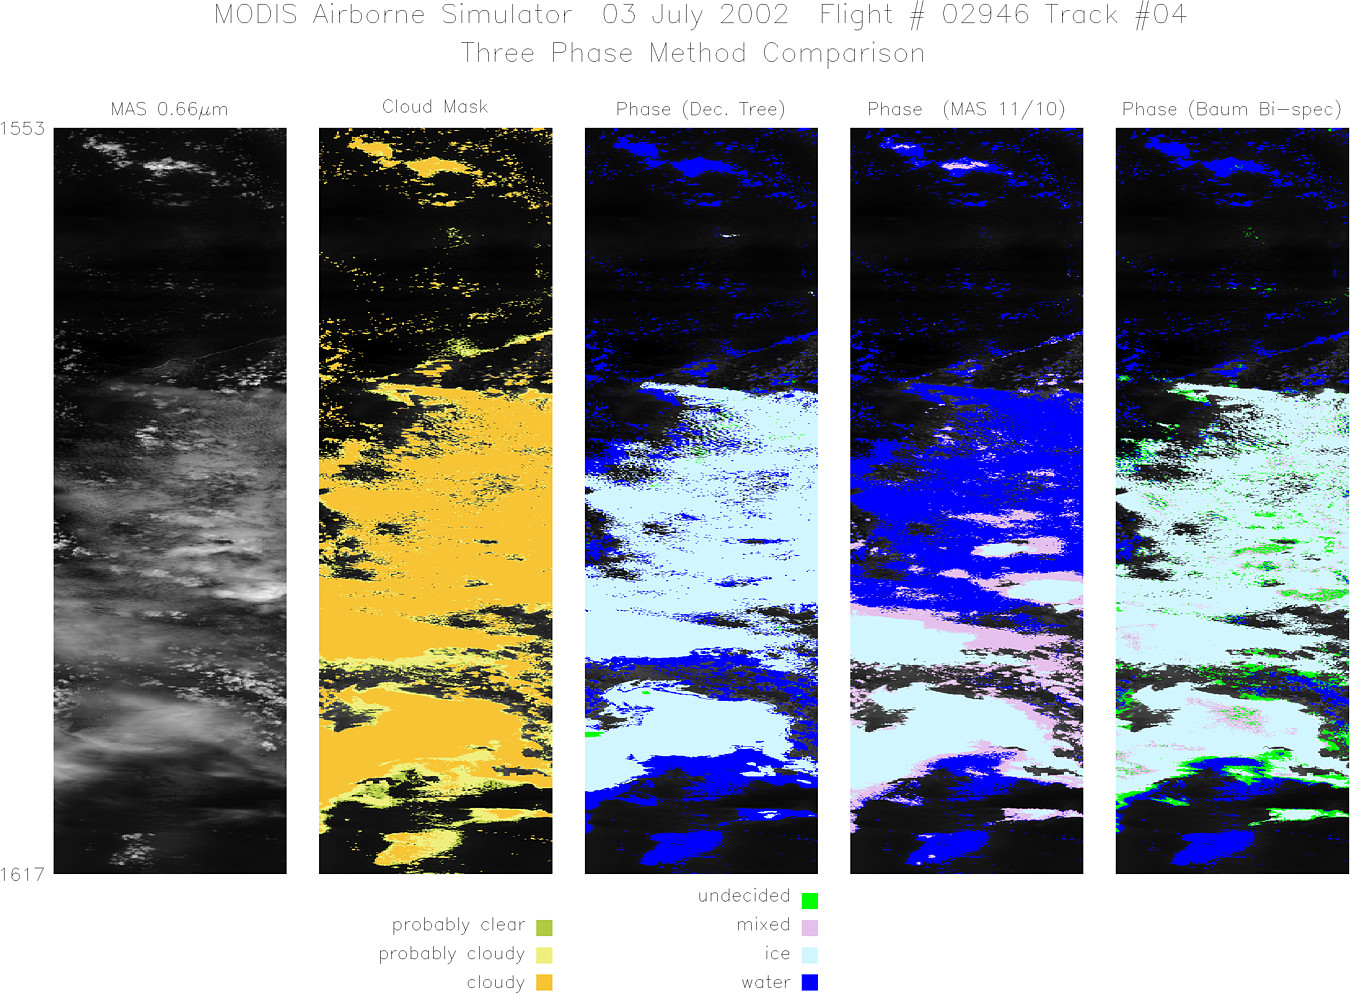
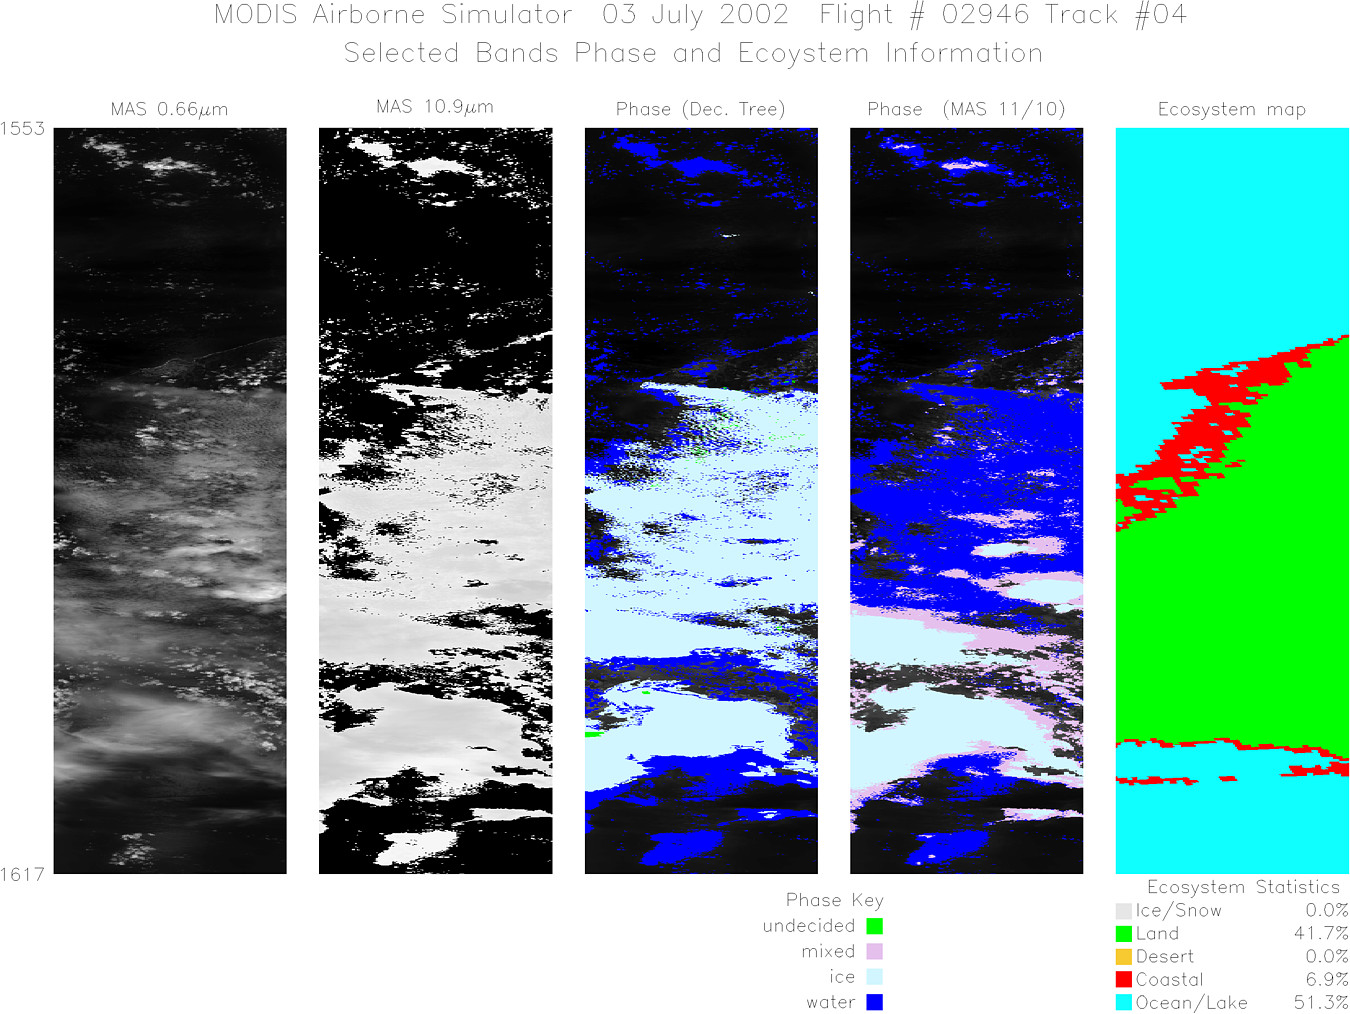
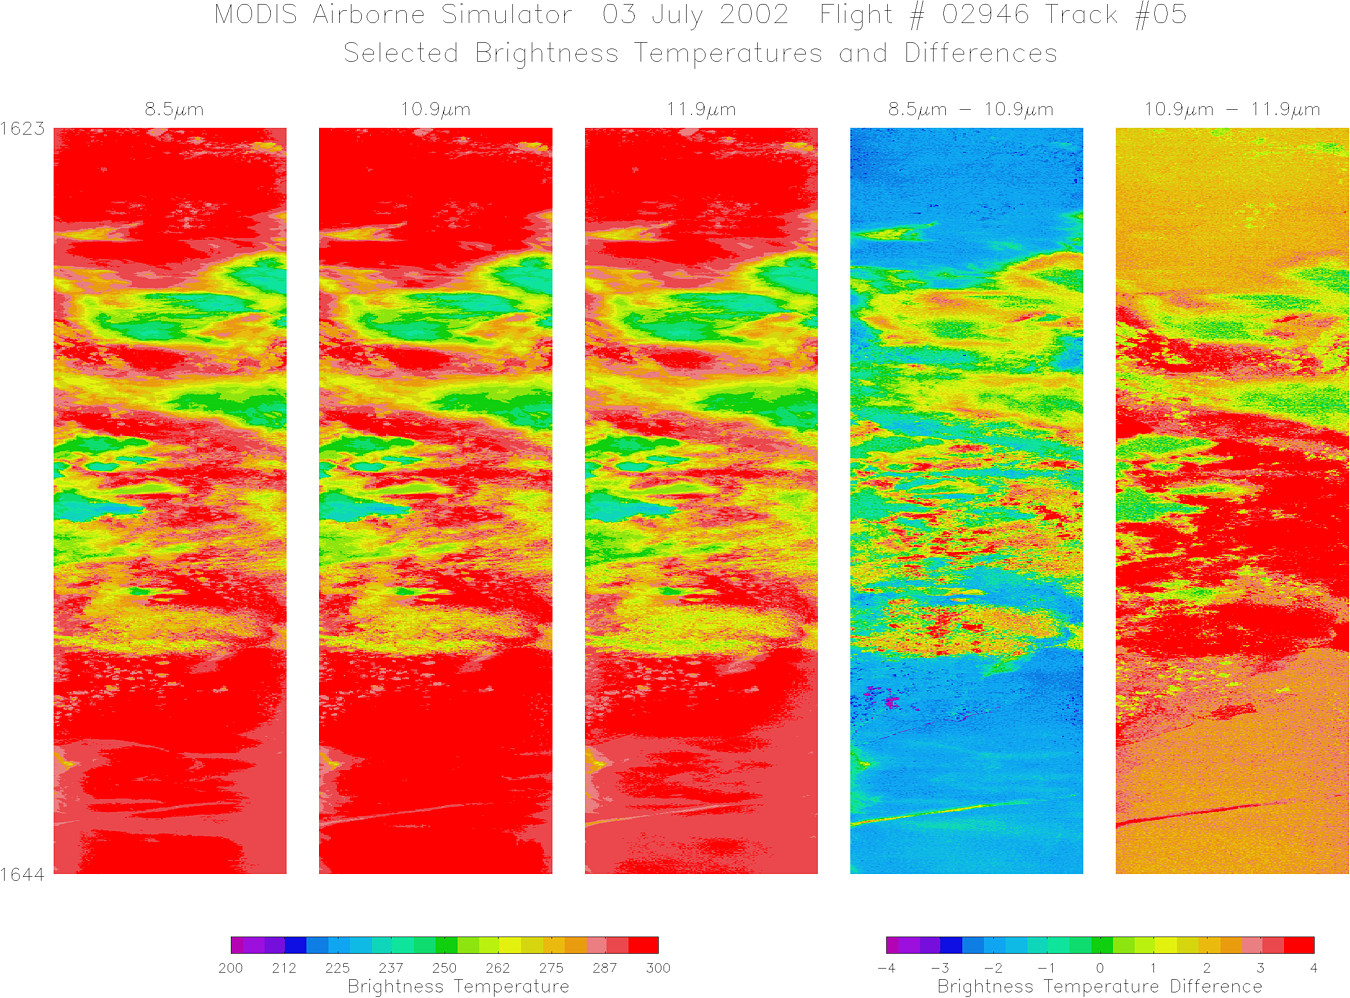
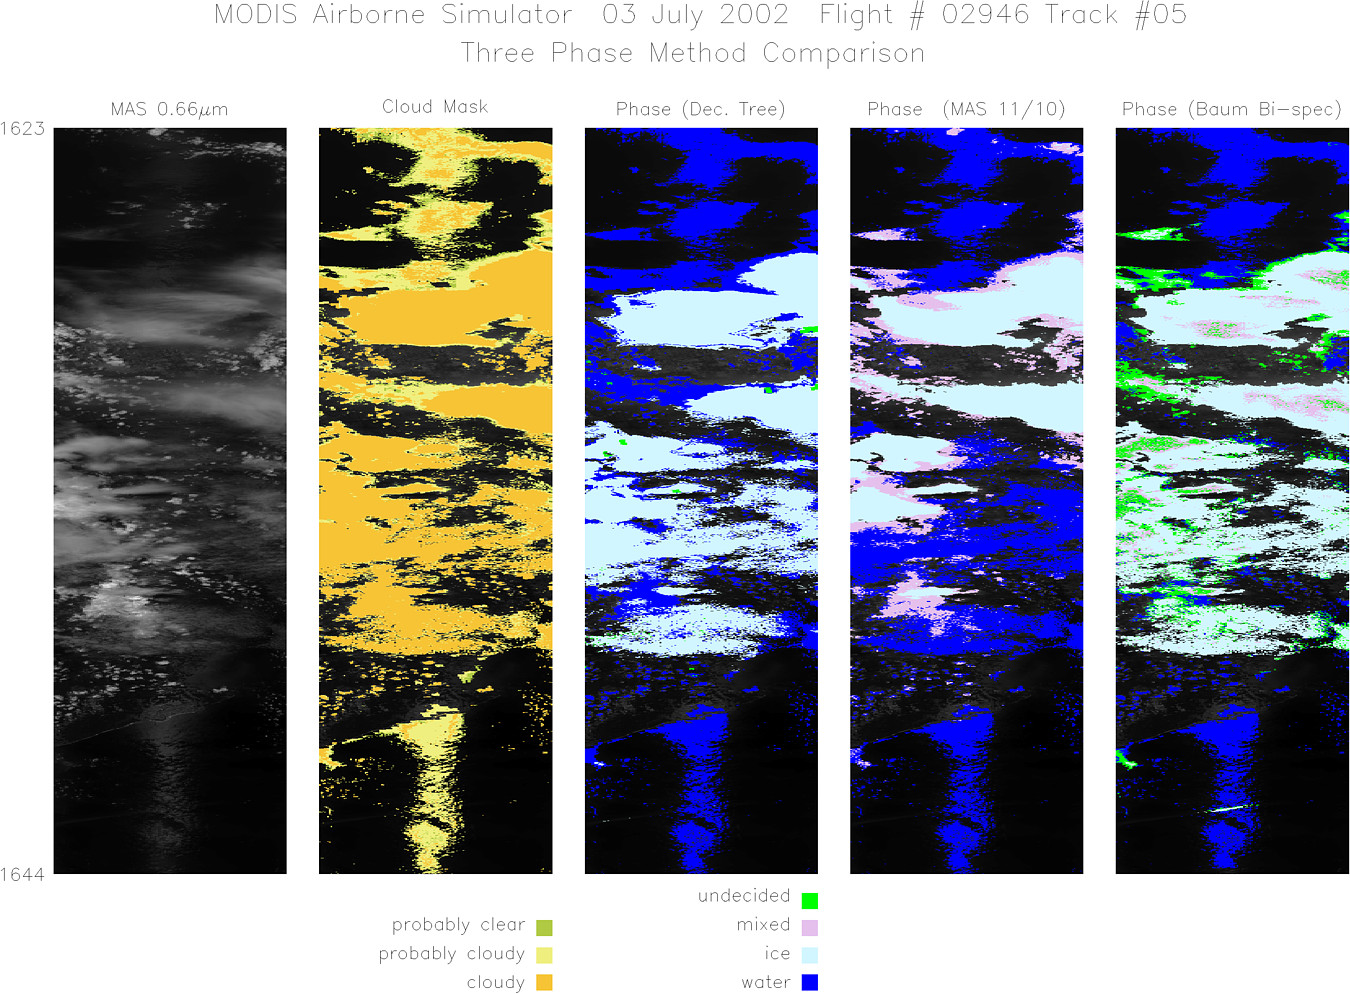
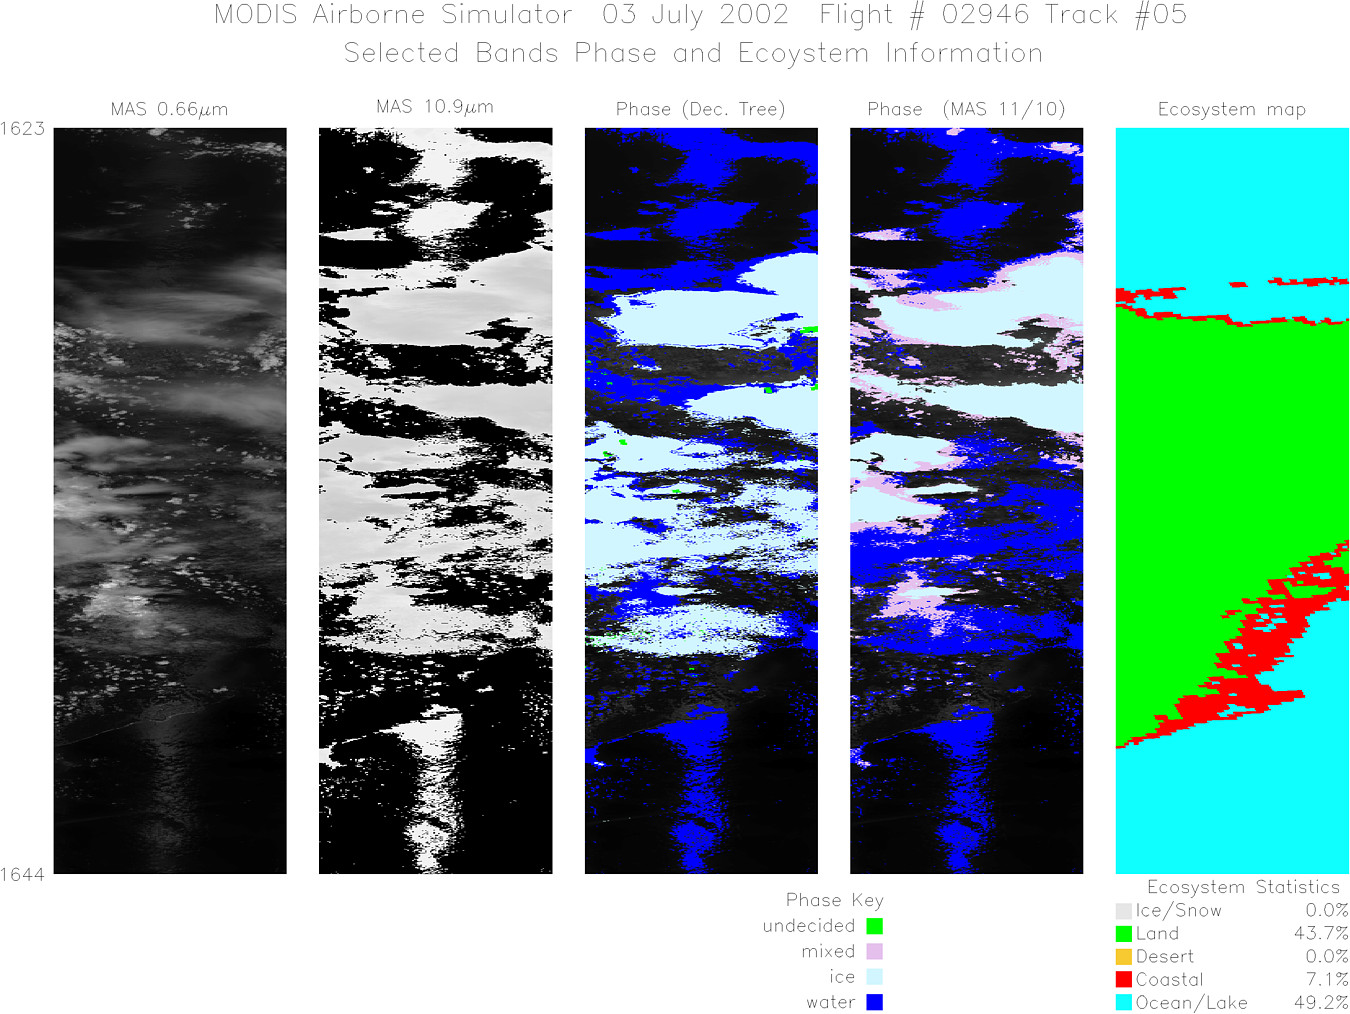
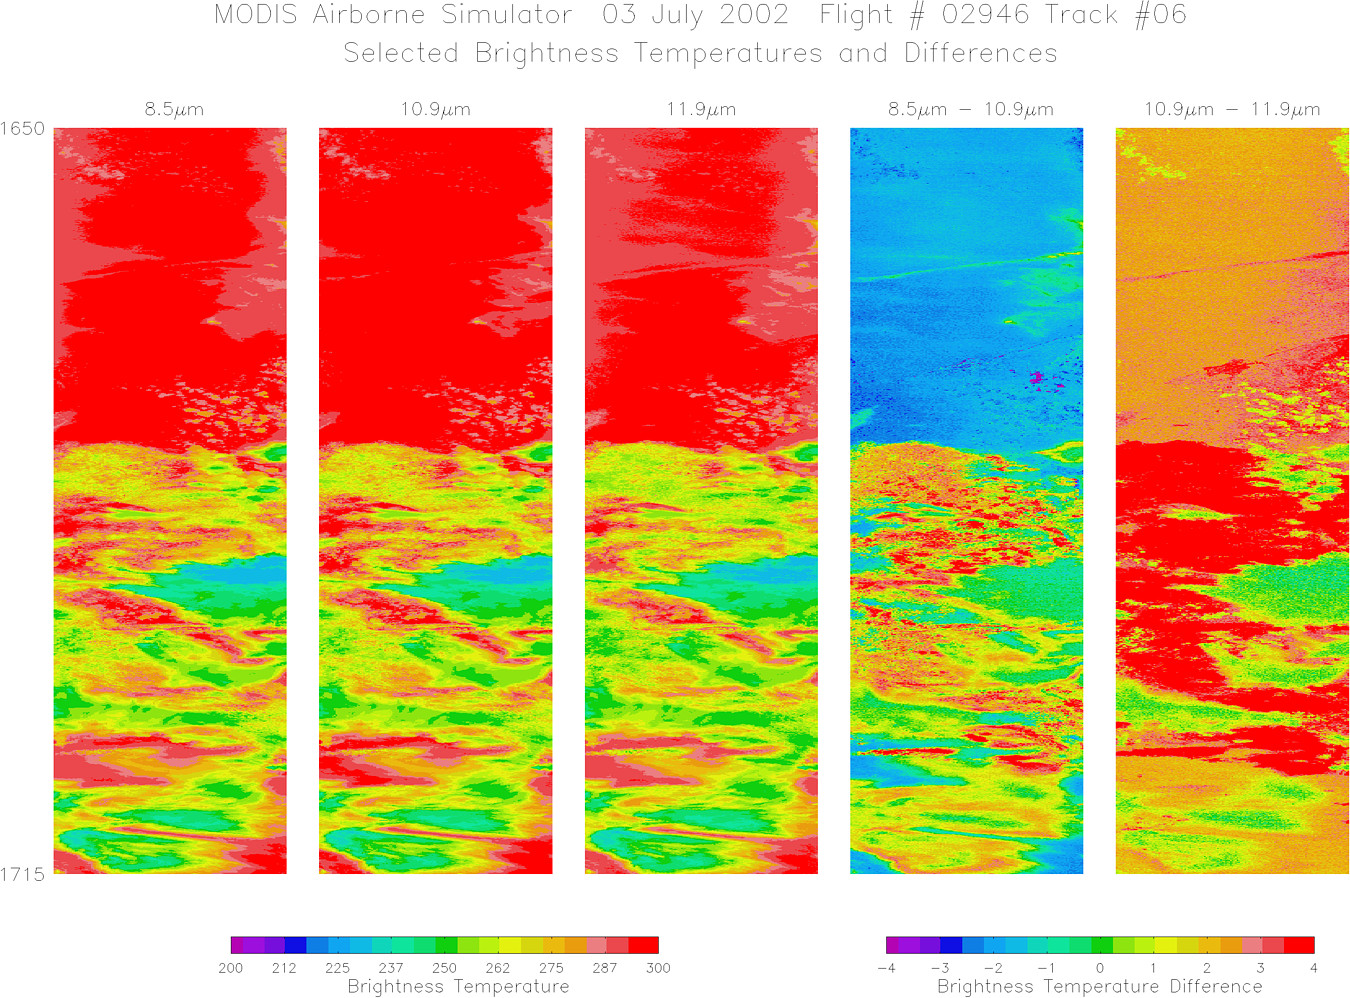
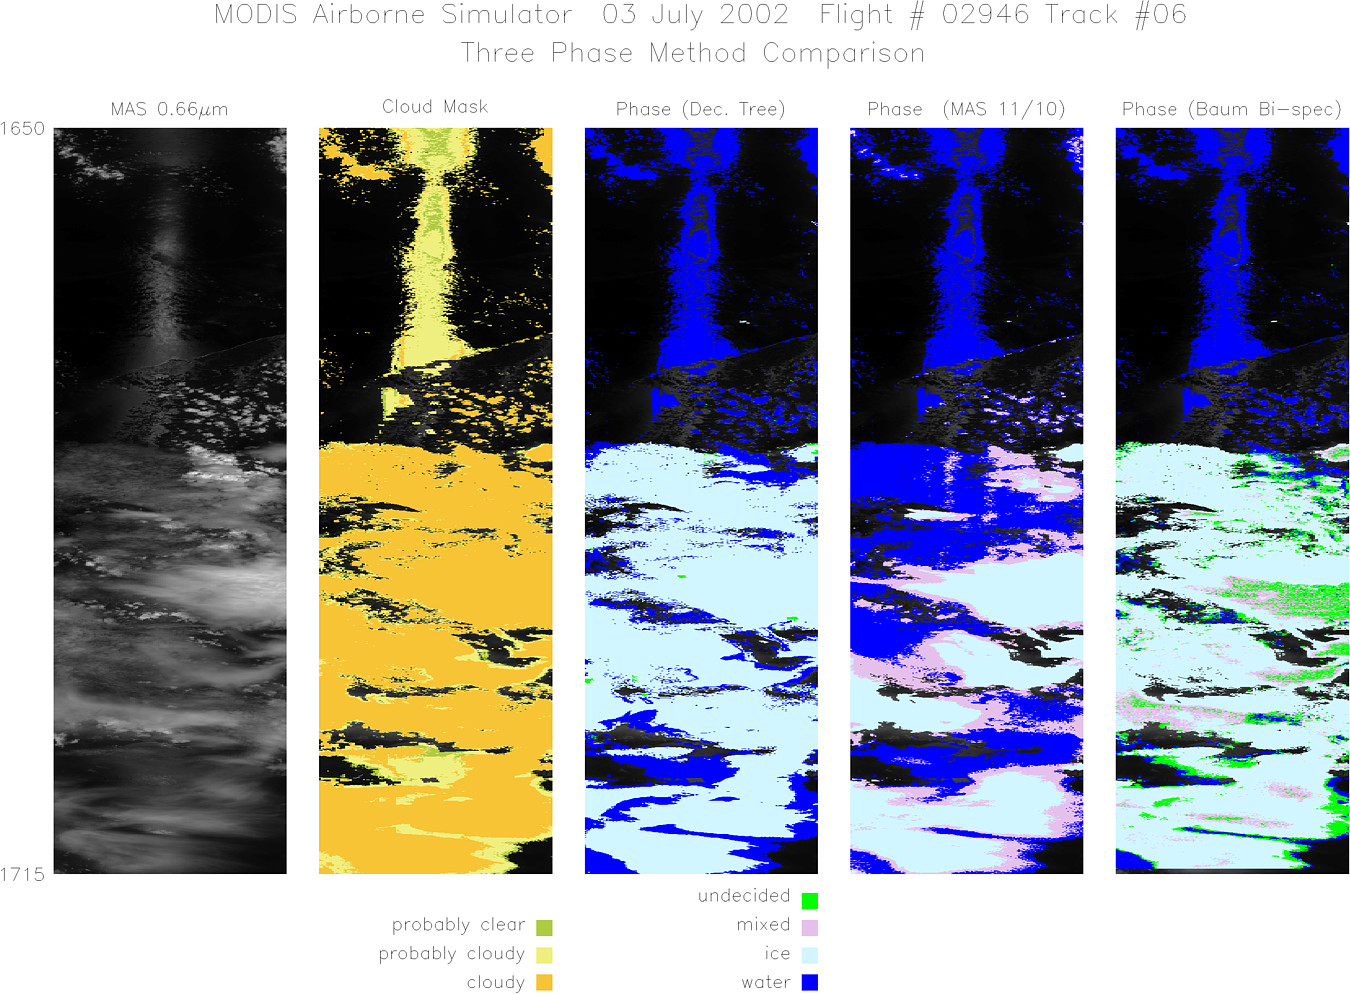
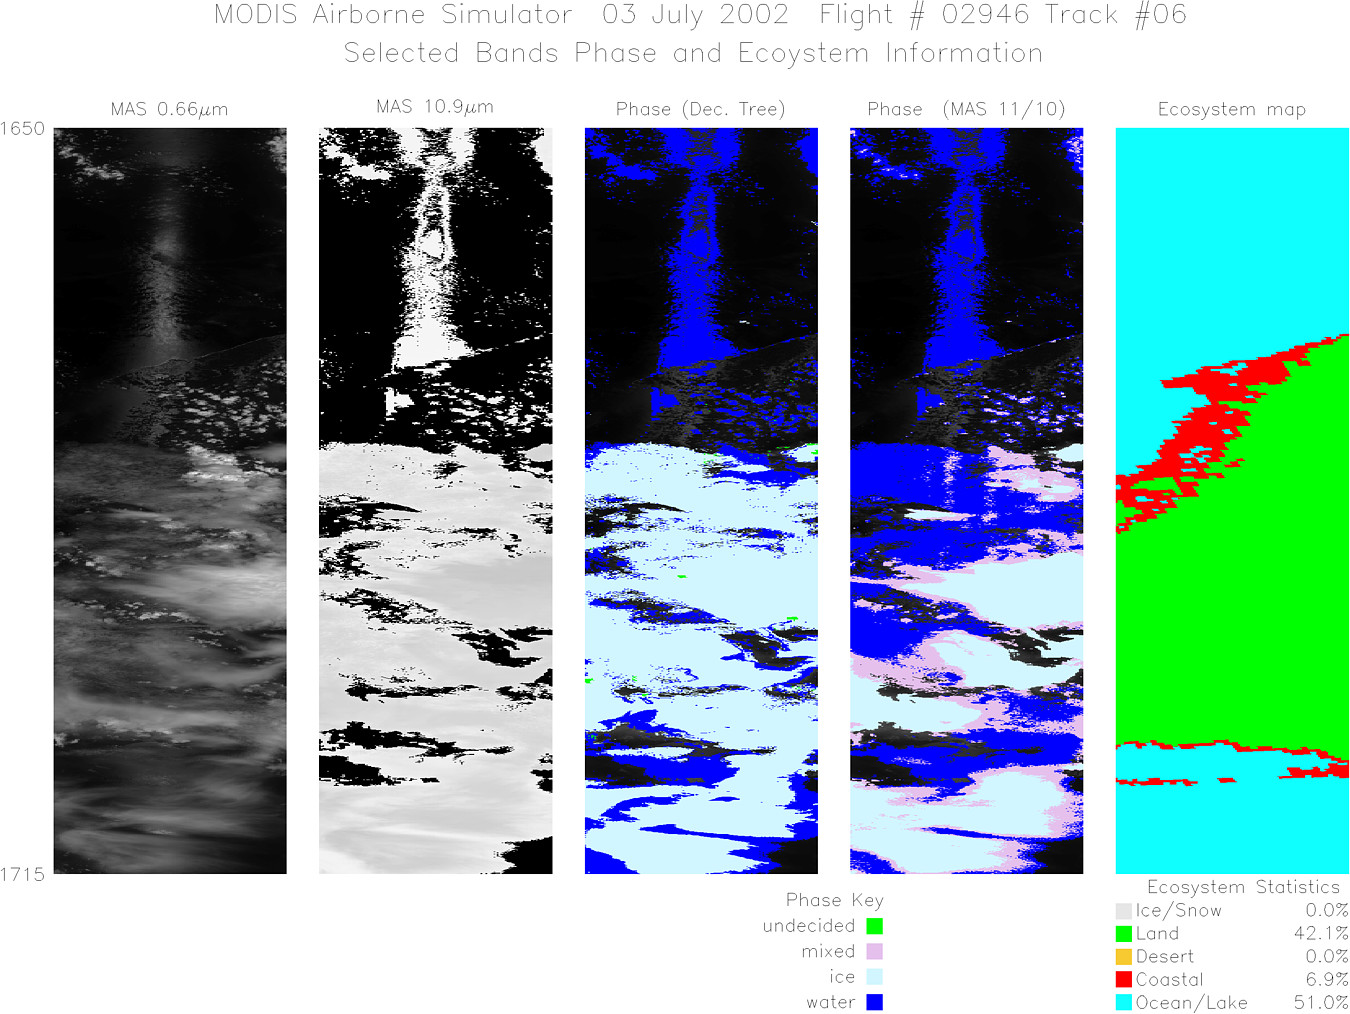
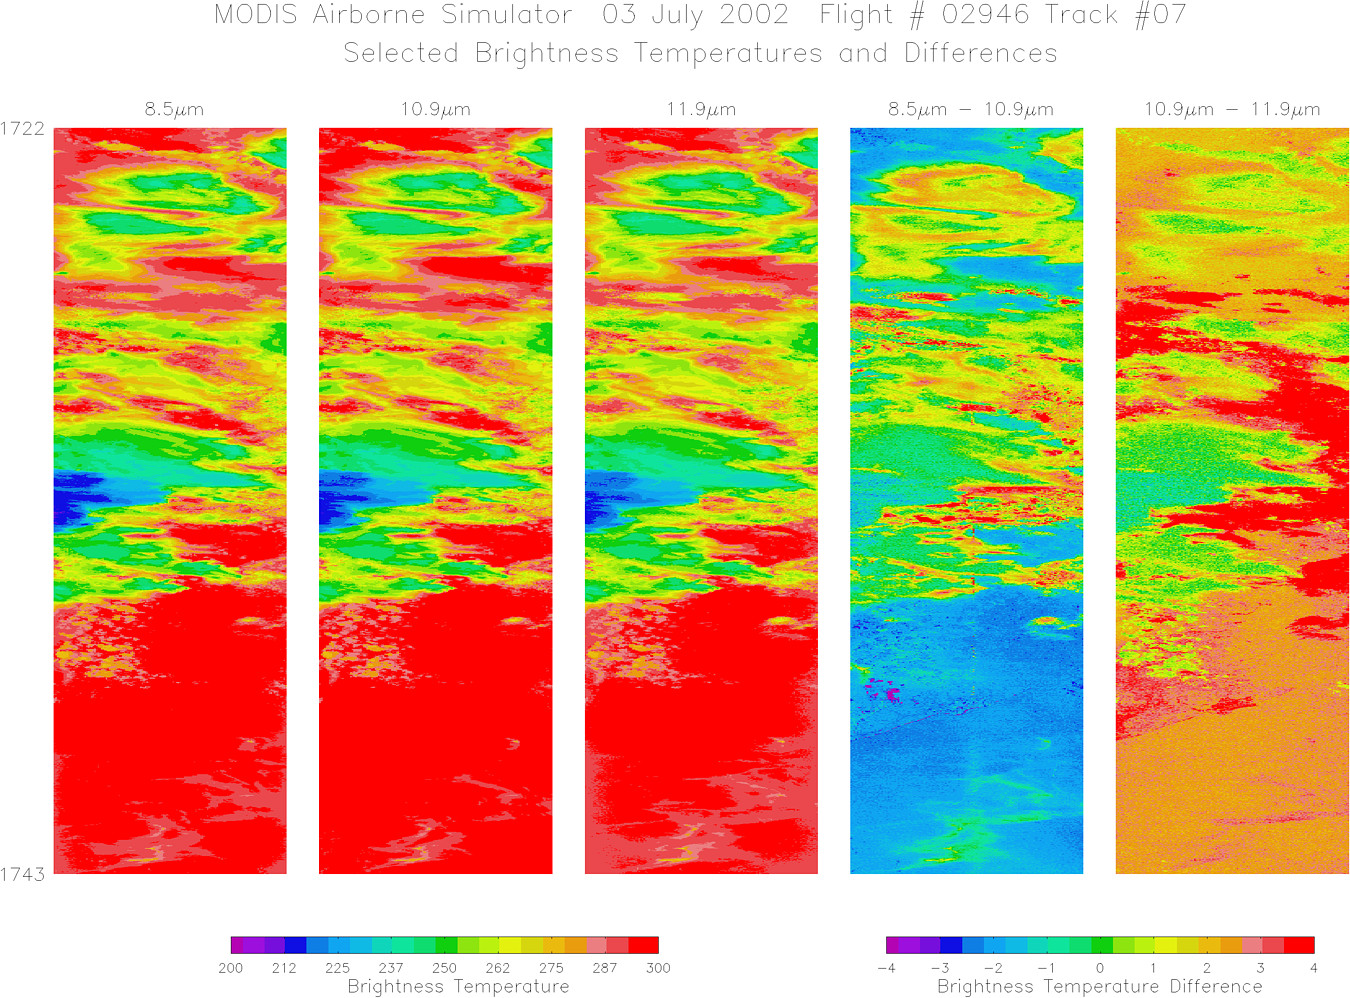
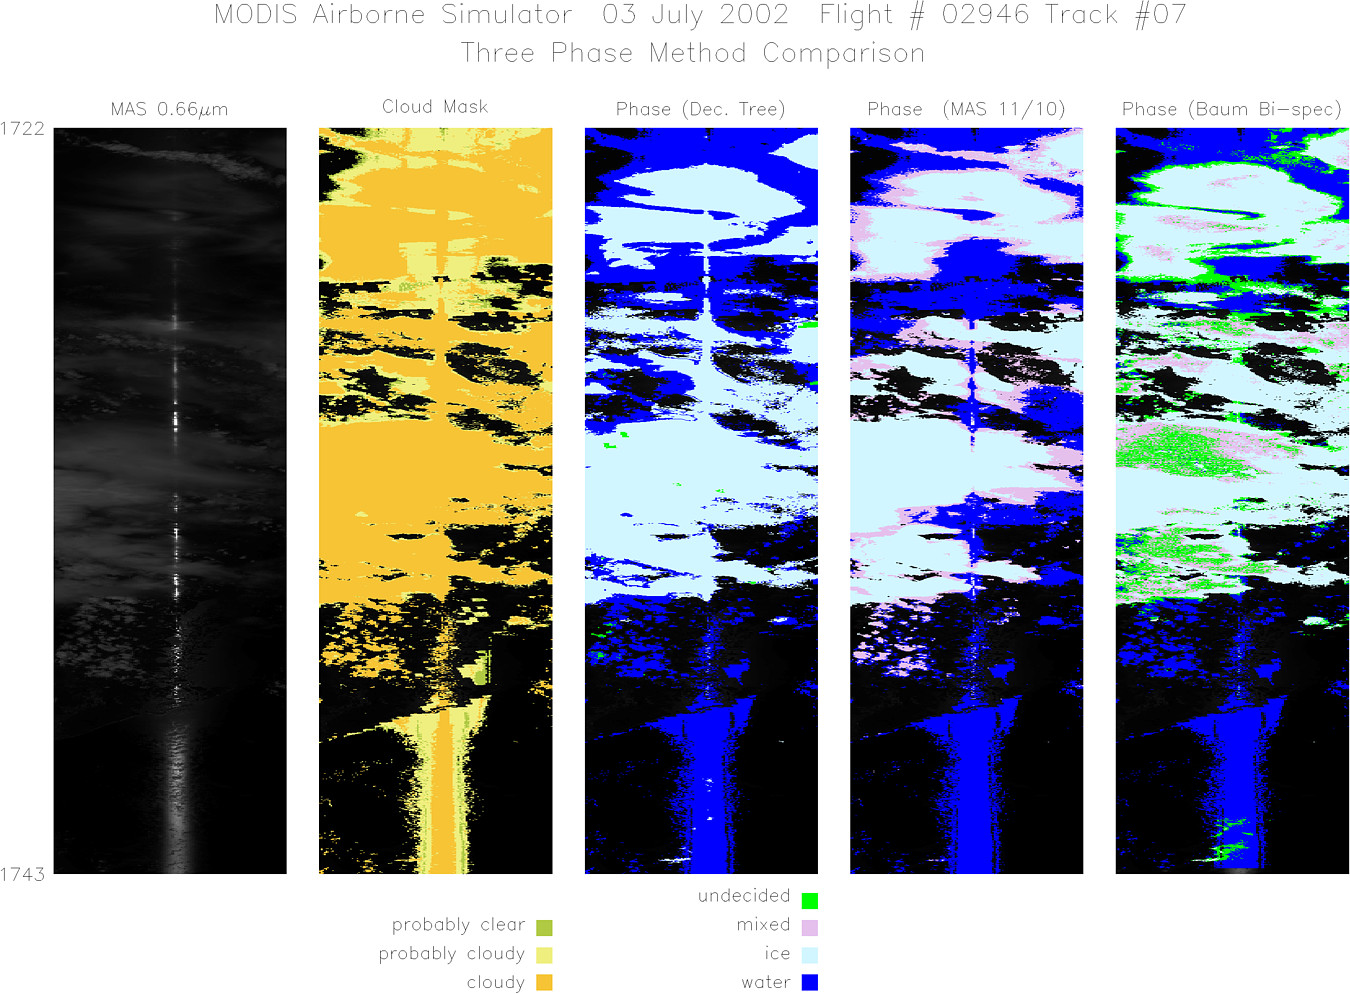
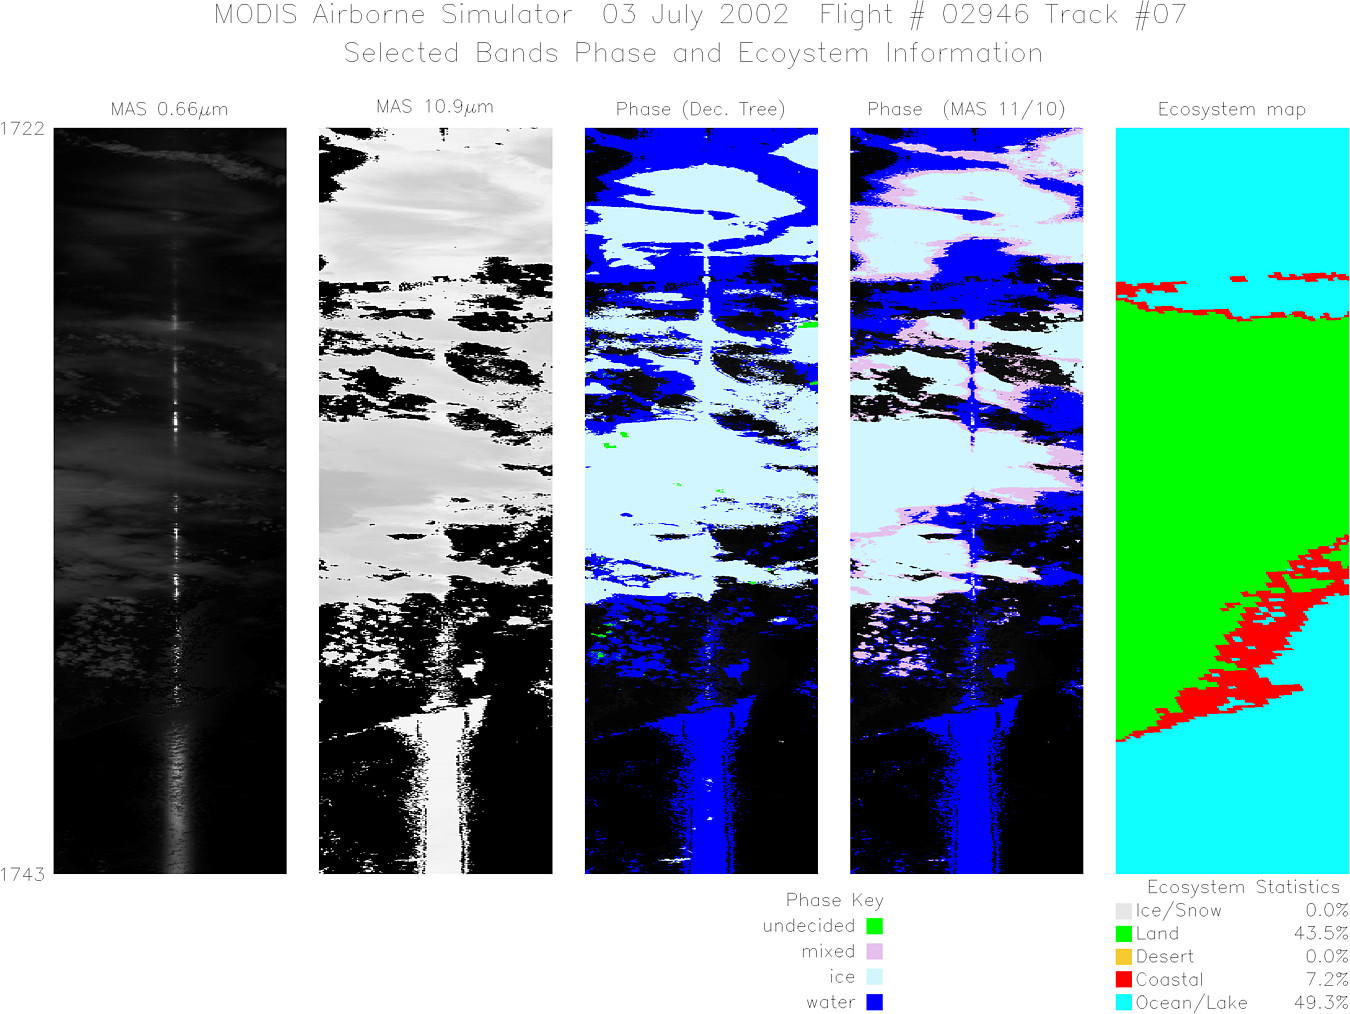
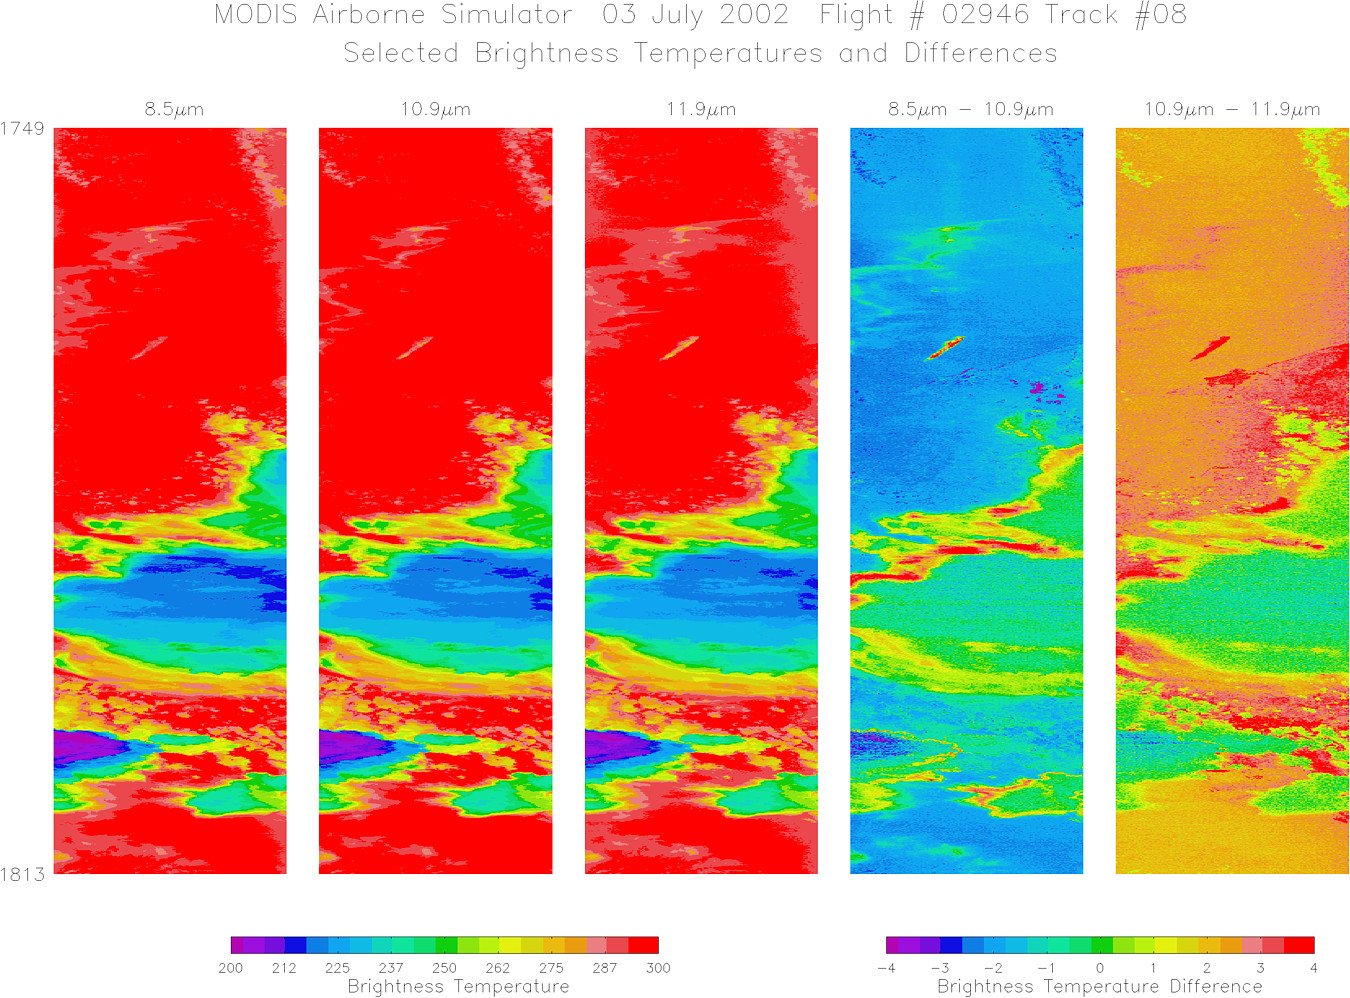
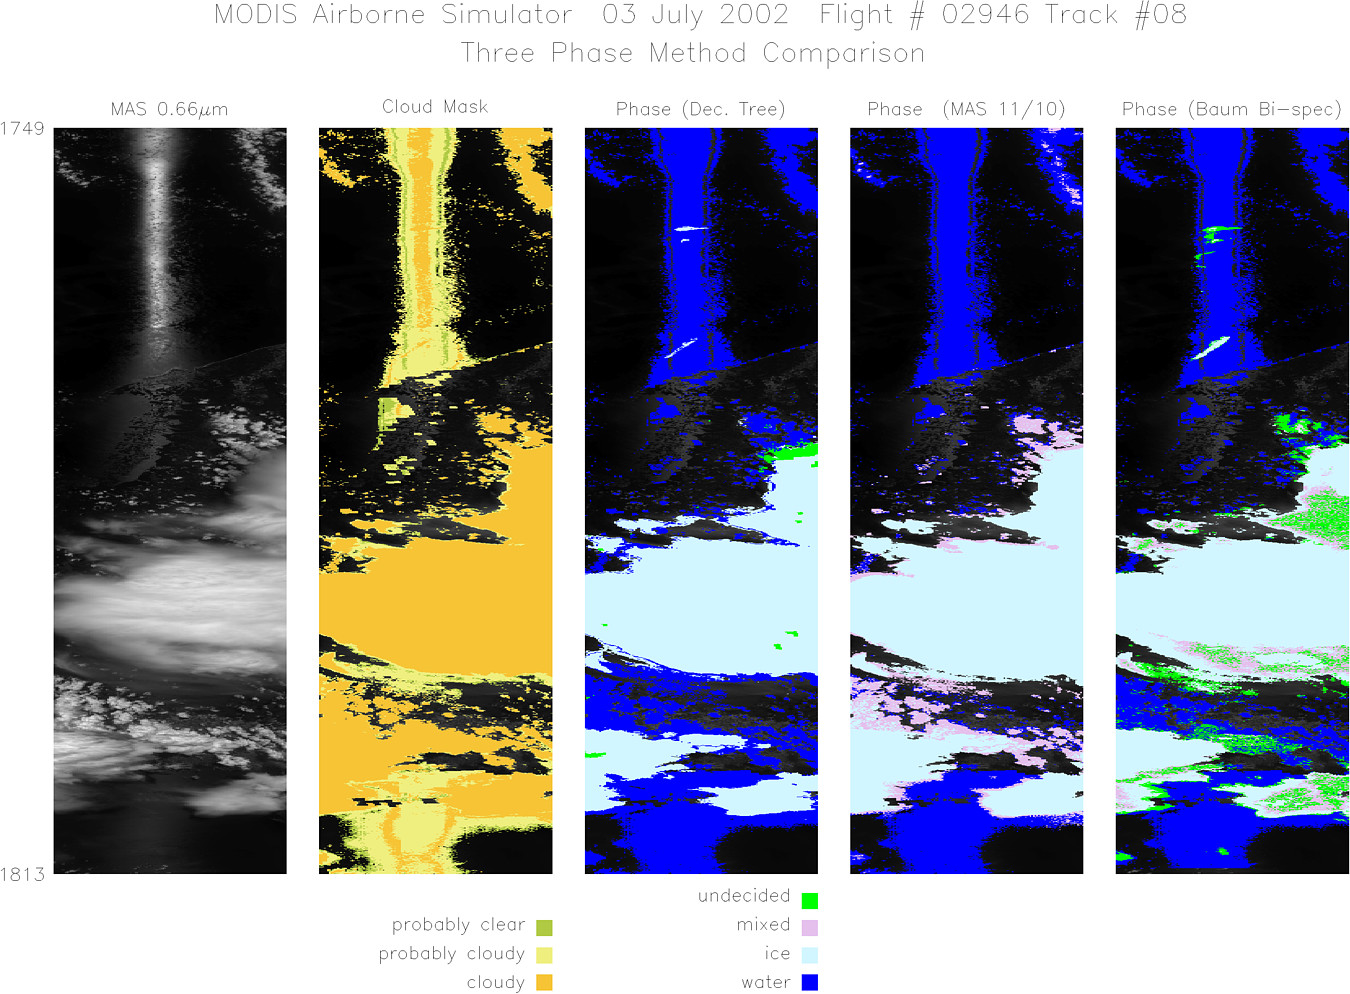
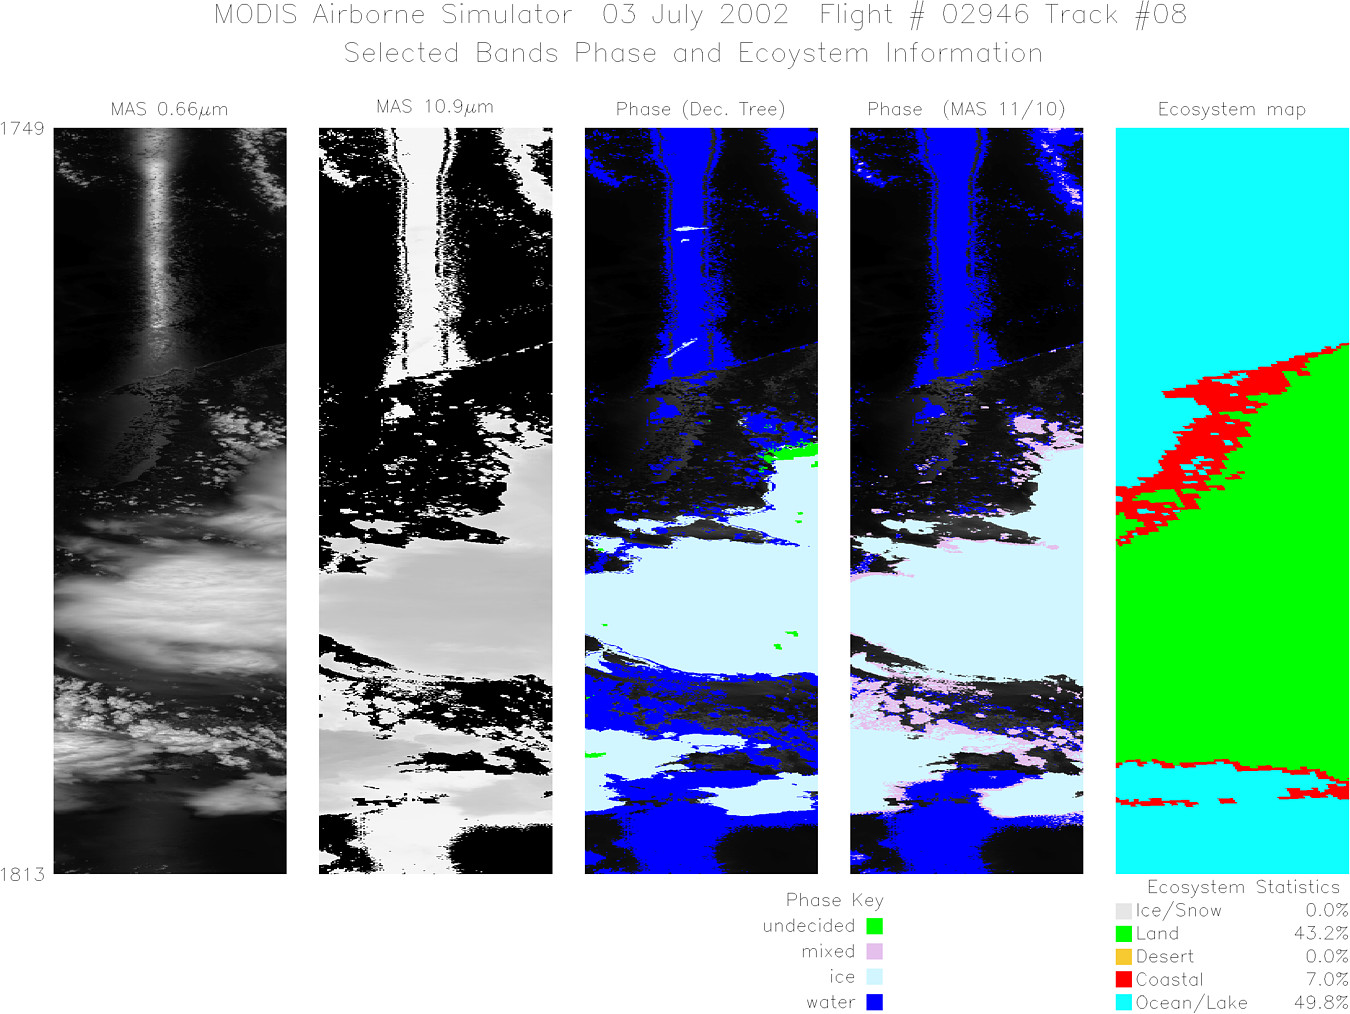
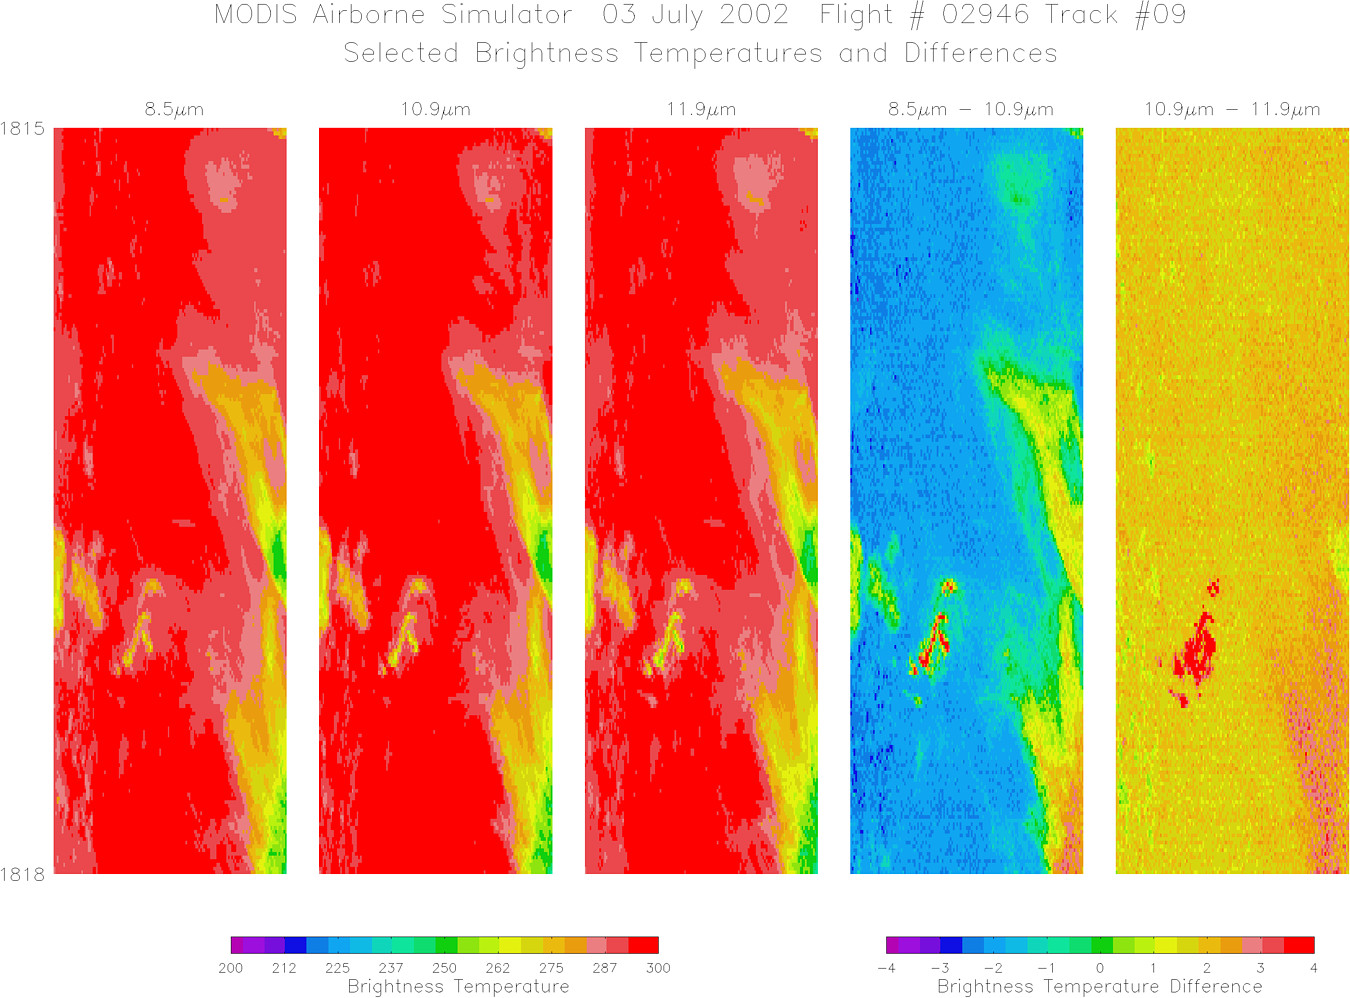
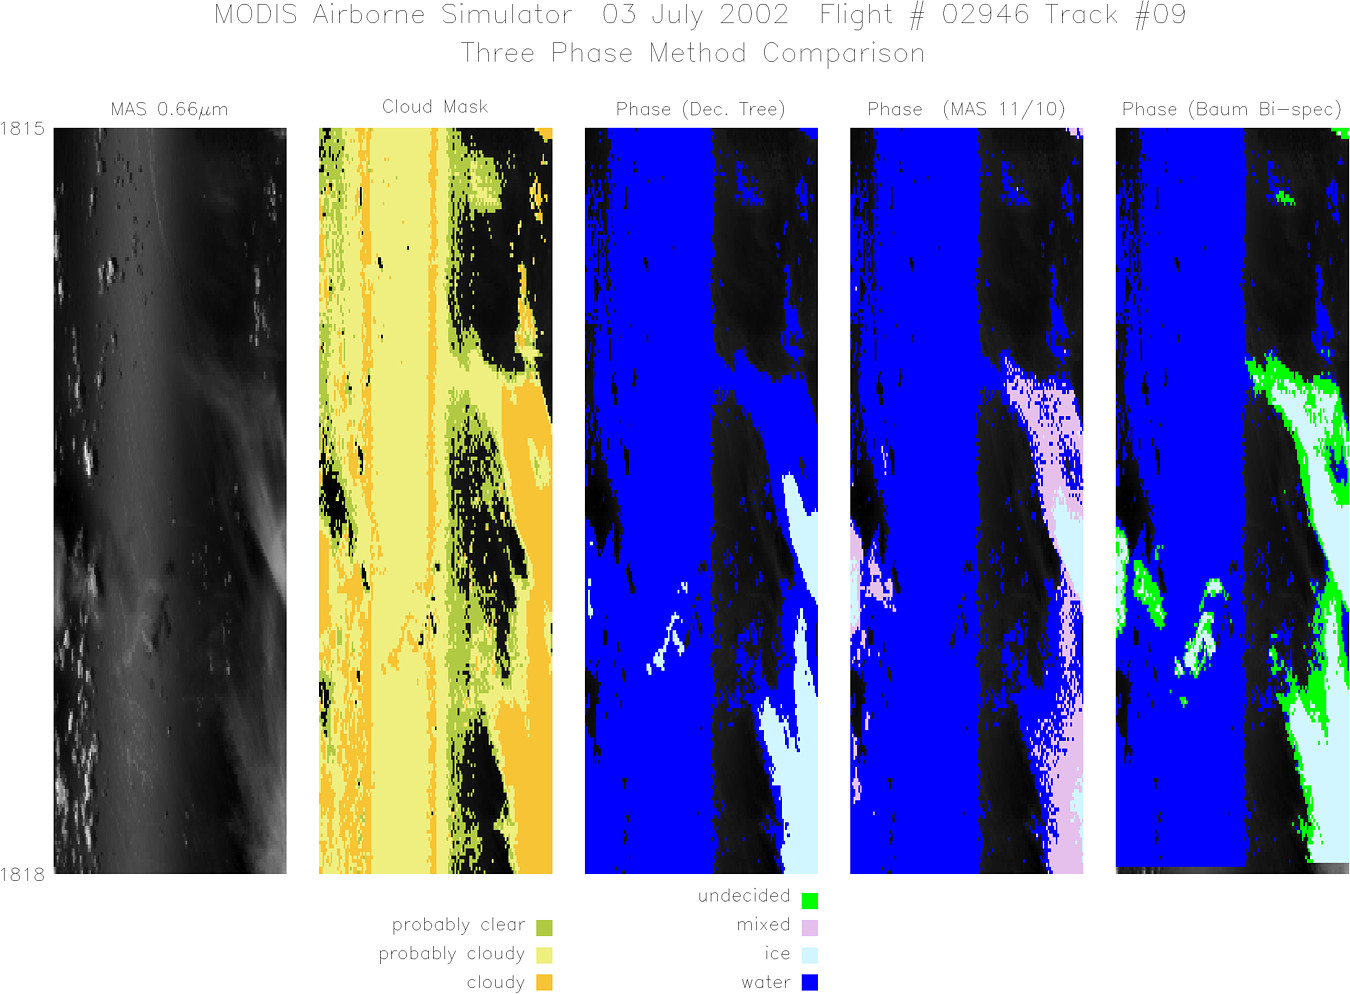
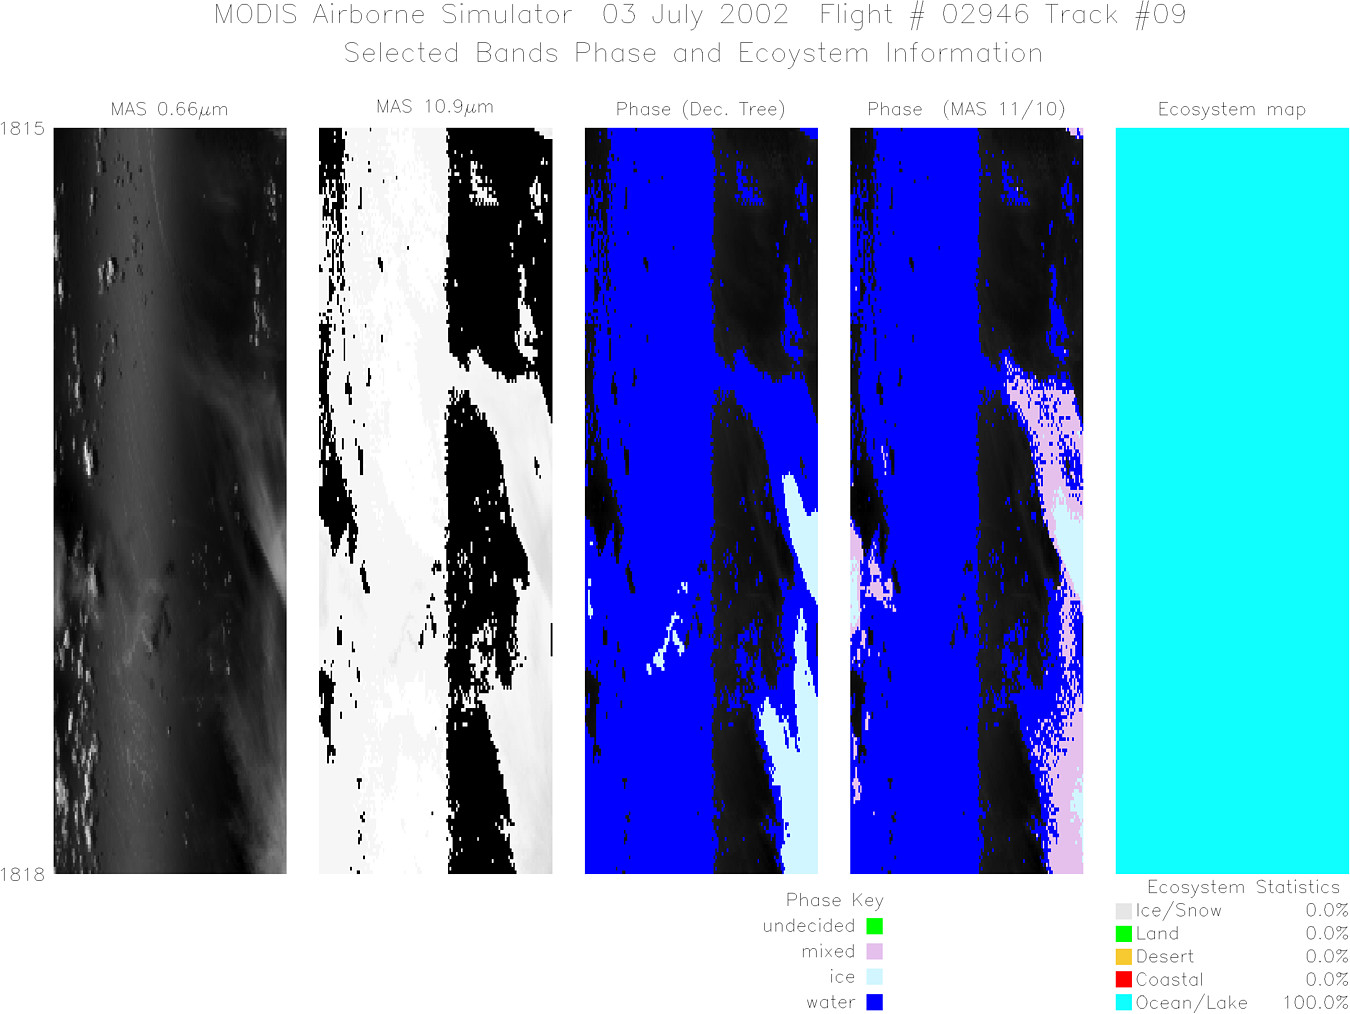
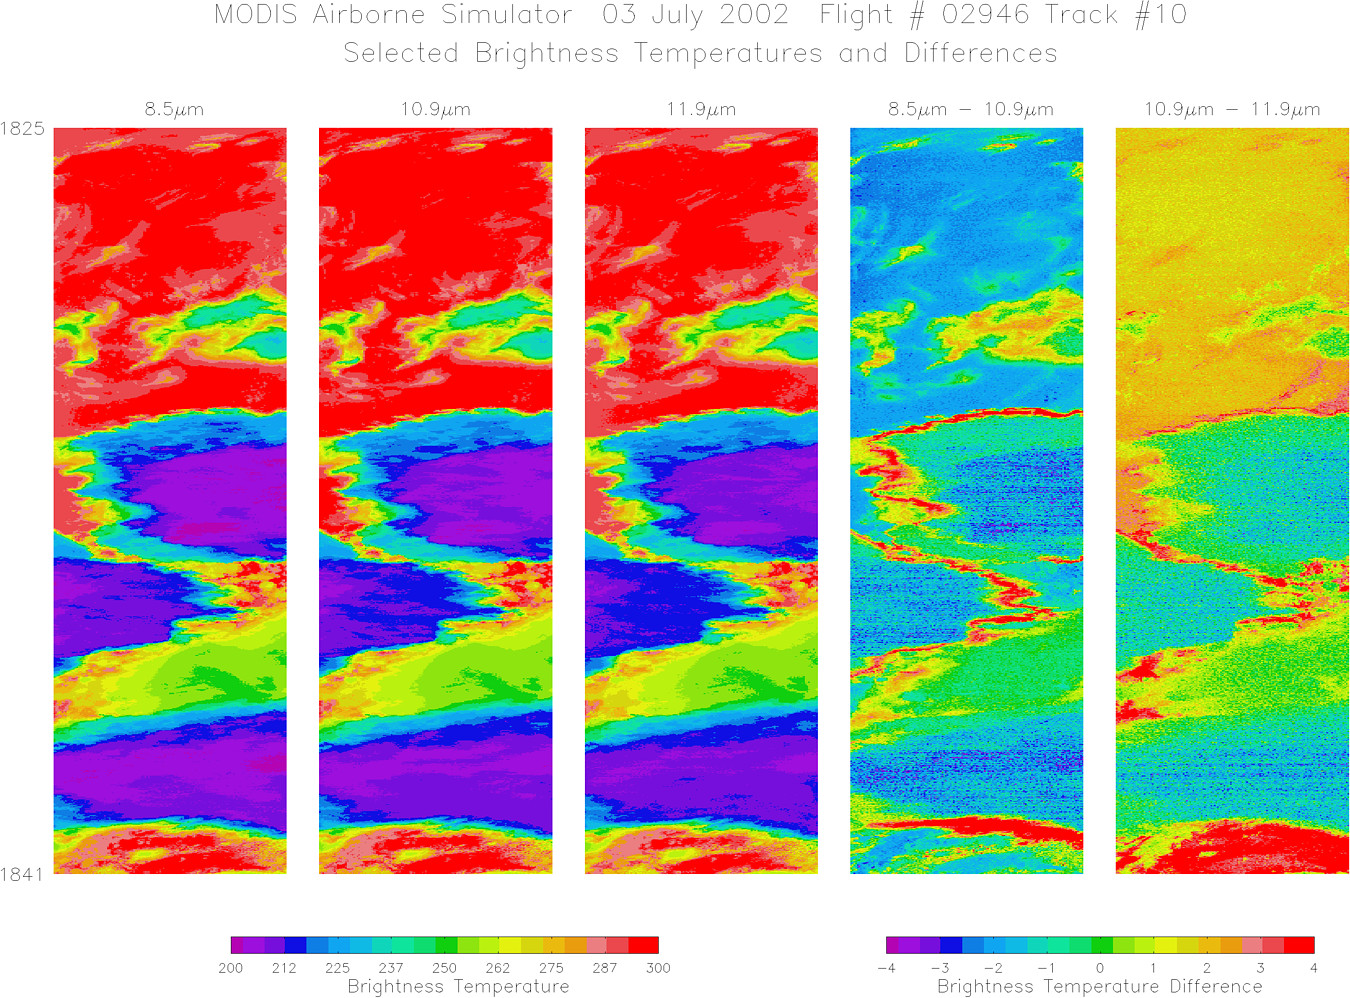
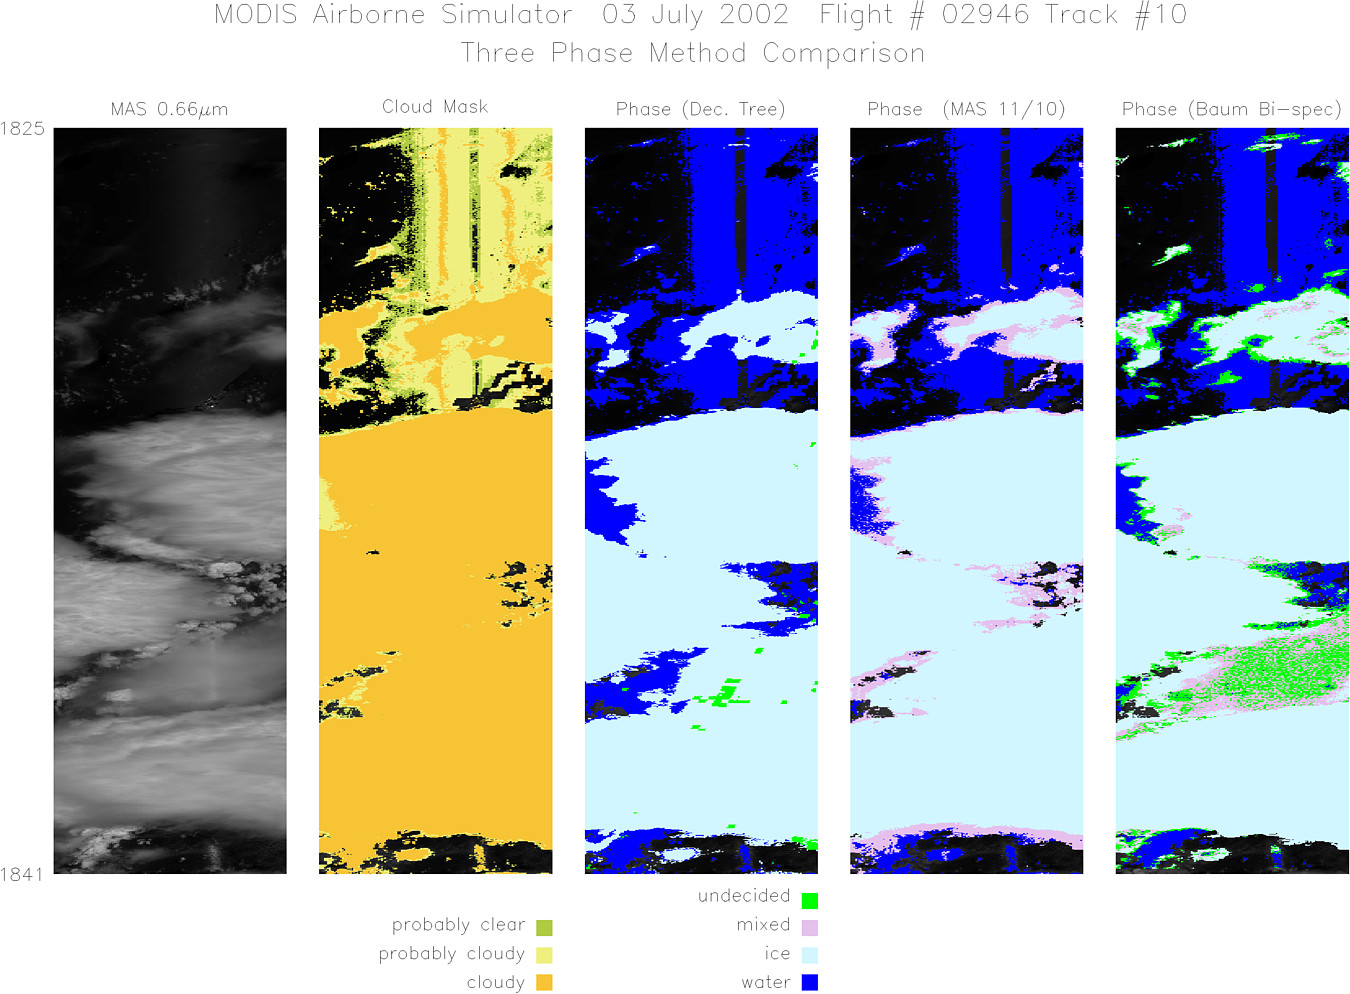
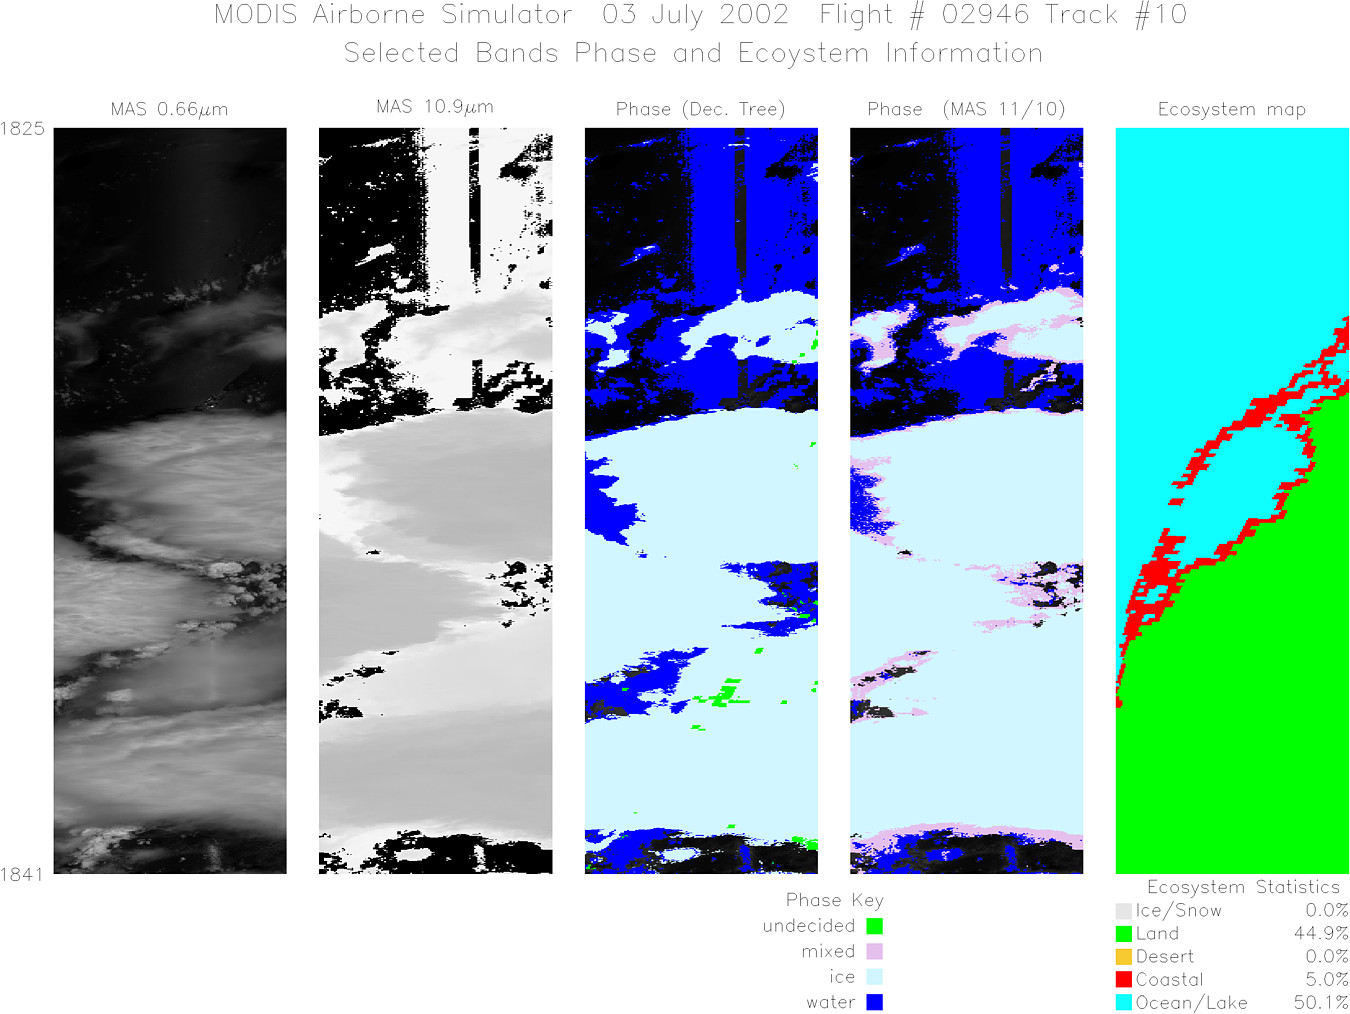
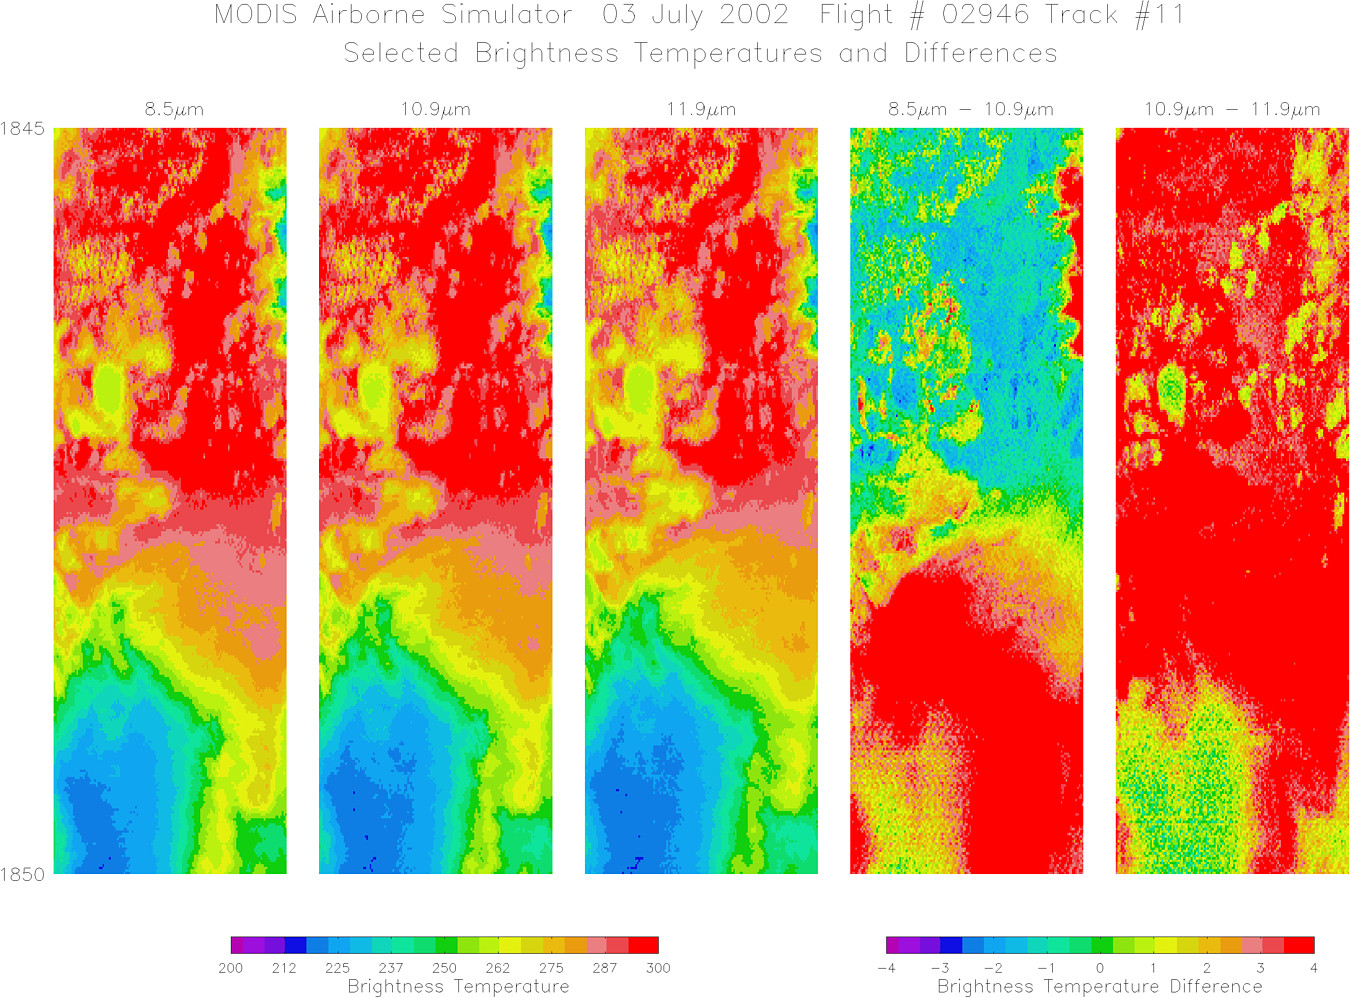
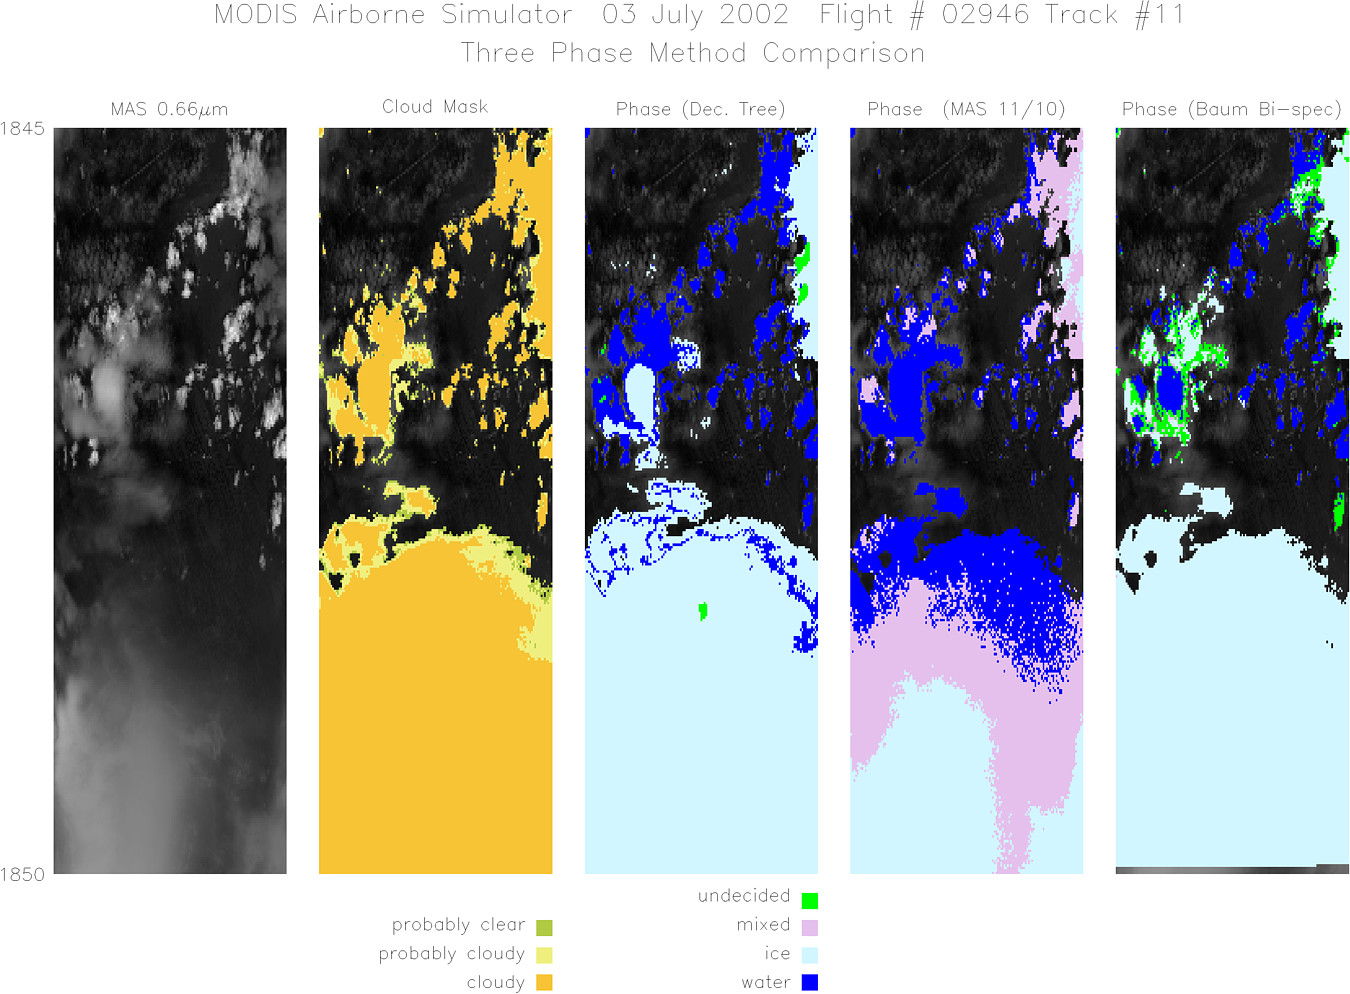
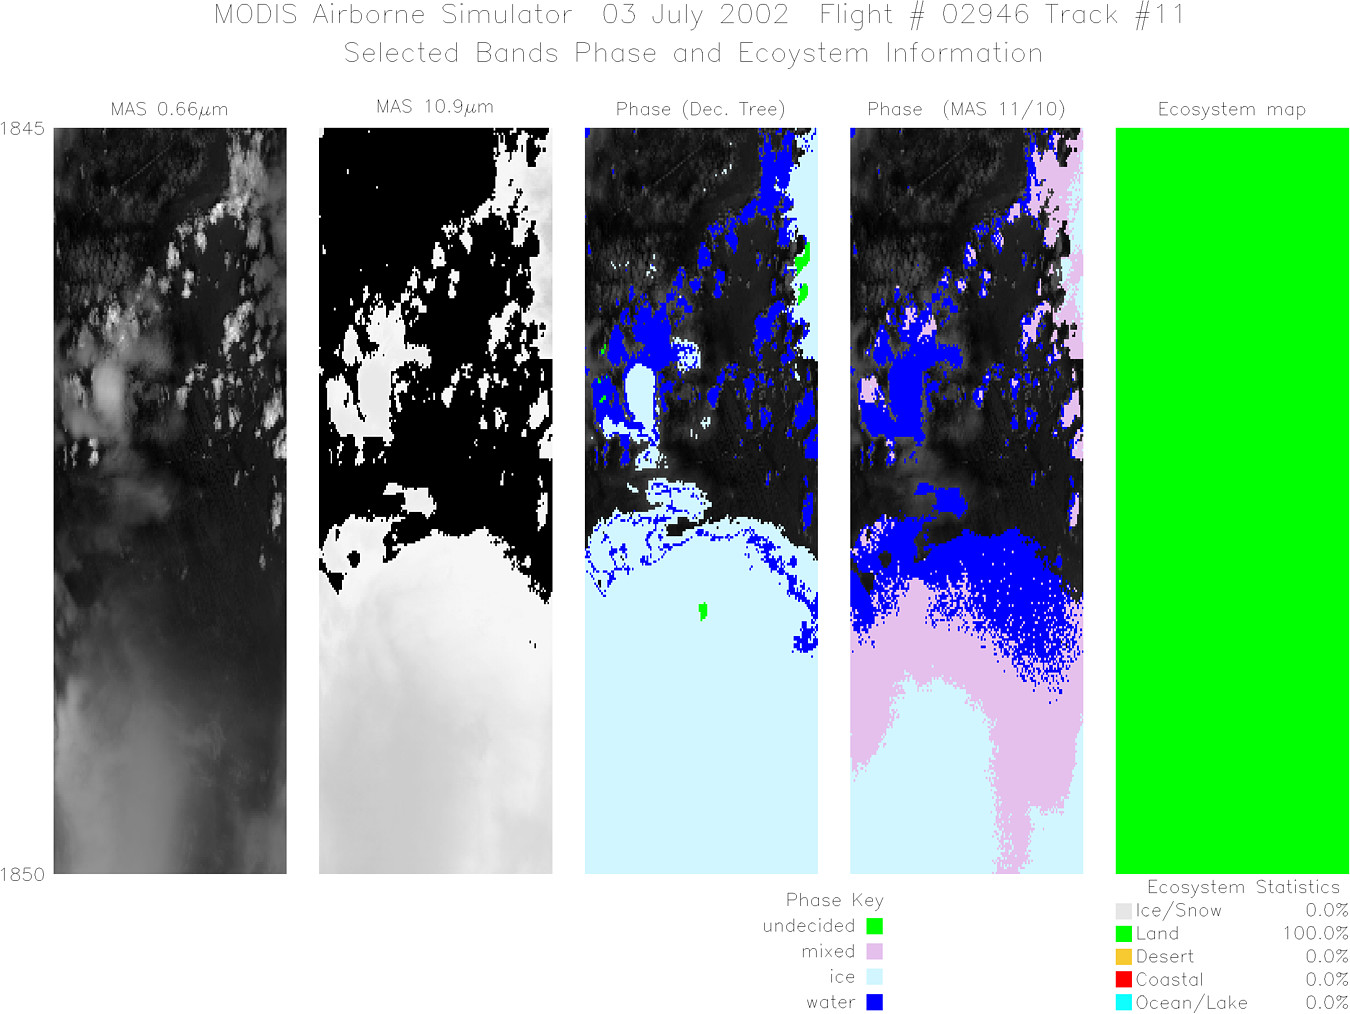
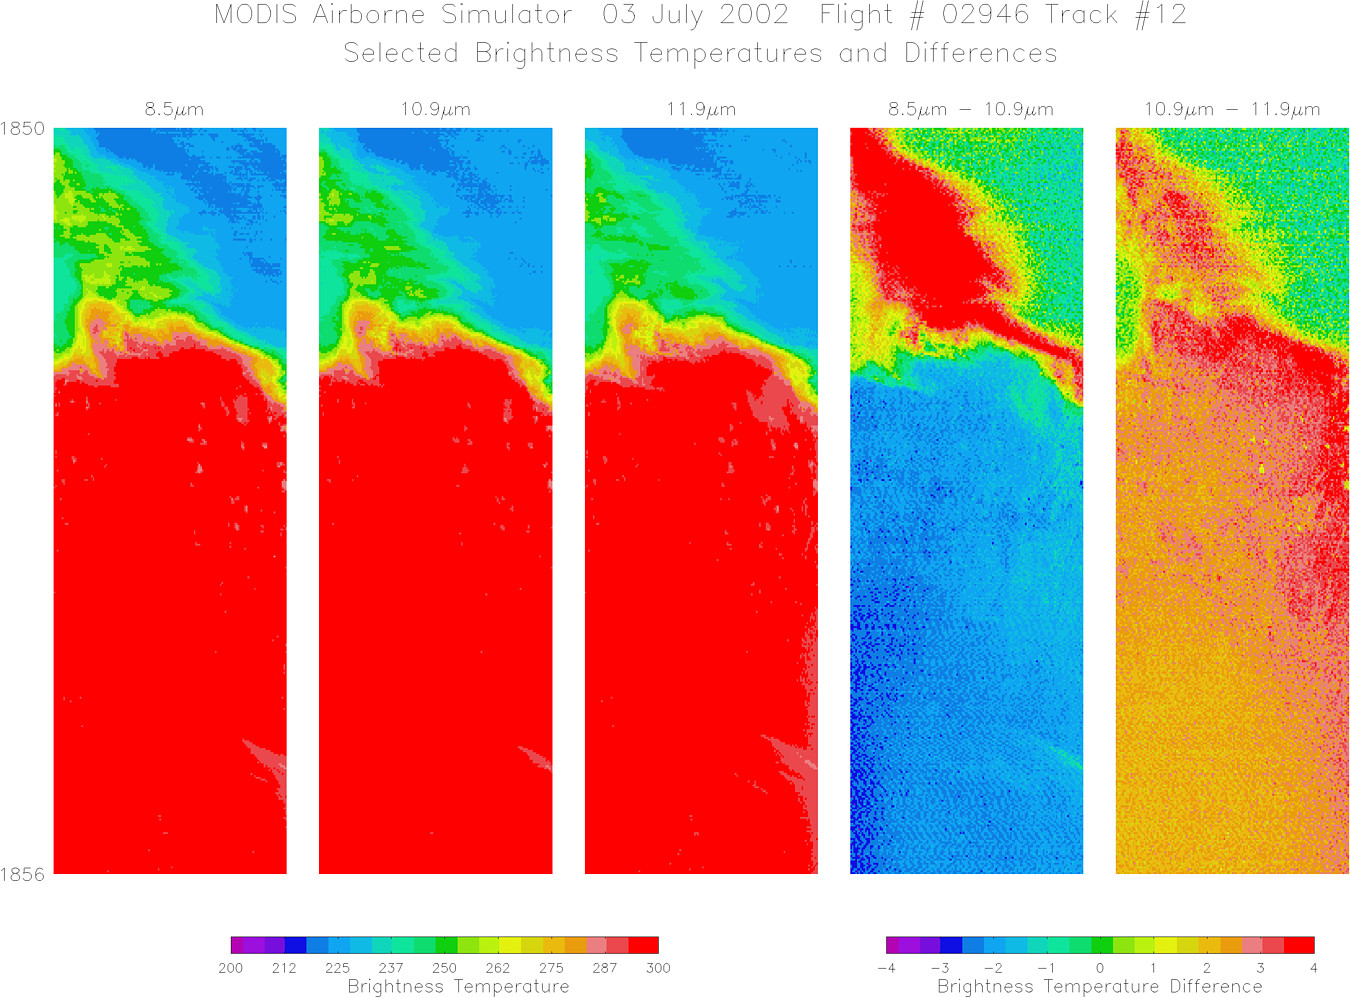
Flight Summary Report Mission Number: 1 Mission Scientists: S. Platnick, P. Newman ER-2 Pilot: K. Broda Takeoff: 1435 (UTC) Landing: 2035 (UTC) Duration: 6:00 (h:mm) Variety of cloud types/fields throughout the day; some clear sky or thin cirrus regions, especially over the Gulf and southern portions of the Atlantic tracks. After climbing to altitude, the ER-2 repeated straight flight lines over the western and eastern ground sites extending out over the Gulf (pt. A) and Atlantic (pt. B). Approximately 2-1/2 round trips were made. At 1813 UTC, the ER-2 headed south (pt. C) for a south-to-north track, paralleling the AQUA track (1834 UTC overpass) over the eastern ground site. The ER-2 then headed toward the southwest under direction from NPOL, where relatively short (5-6 minute) legs were flown. The ER-2 then proceeded off the Atlantic (southeast of Miami) followed by a return to Key West. Satellite & Ground Site Information
AQUA Overpass @ 1834 (UTC); VZA = N/A
Western Site: PARSL, Everglades National Park, Gulf Coast Visitor's Center
|
||||||||||||||||||||||||||||||||||||||||||||||||||||||||||||||||||||||||||||||||||||||||||||||||||||||||||||||||||||||||||||||

Flight 02-946


| Sample Imagery |
| Click image for full resolution |
|
Track #06 Southern Florida |


|
|
R: 1.64µm G: 0.66µm B: 1.90µm |
|
Track #10 Southern Florida |

|
|
R: 1.64µm G: 0.66µm B: 1.90µm |
- NASA Official: Matt Fladeland
- Project Manager: James Jacobson
- Website Editor: Eric Fraim
- Last Updated: November 16, 2021


