


MODIS Airborne Simulator (MAS)
FLIGHT SUMMARY INFORMATION
Flight Track Map


|
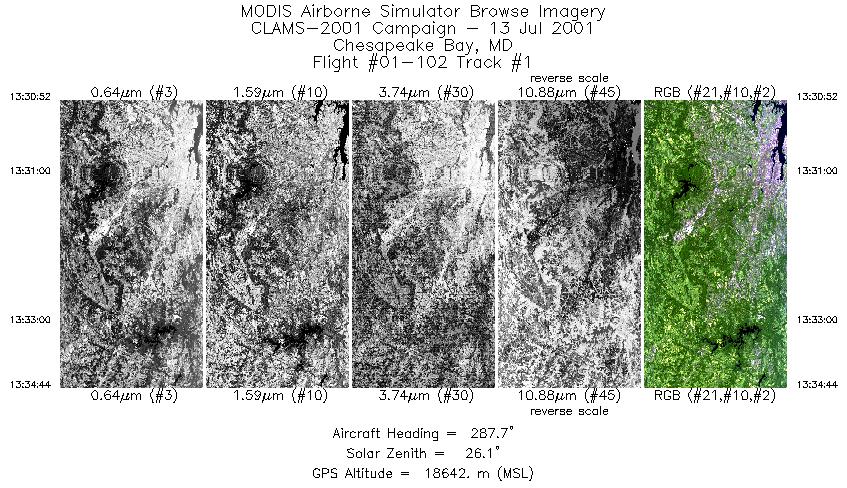
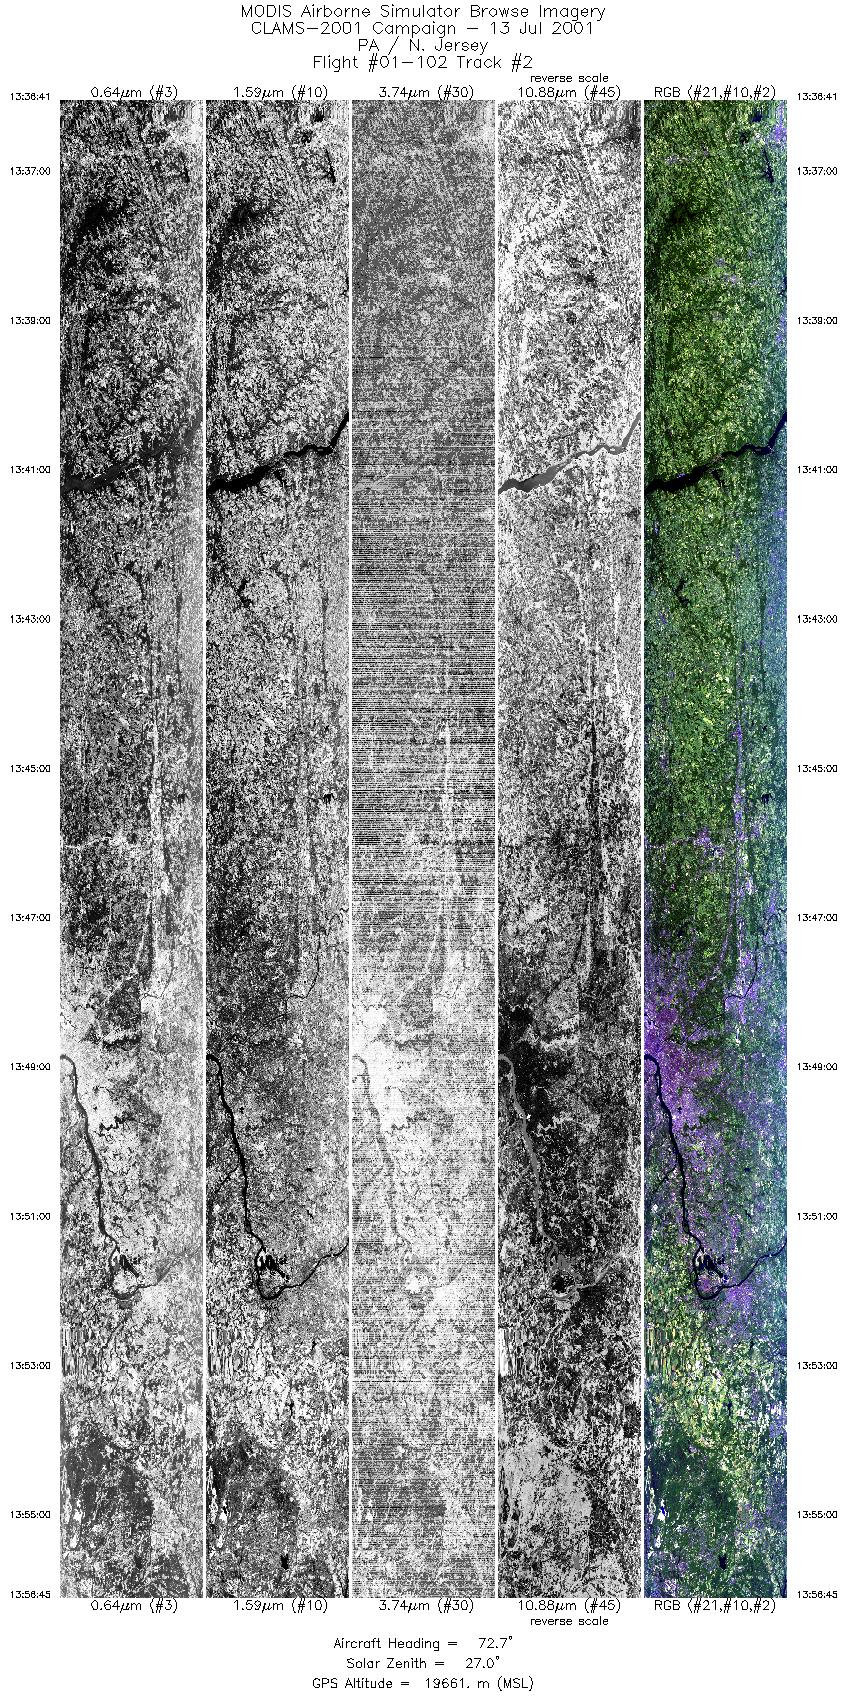
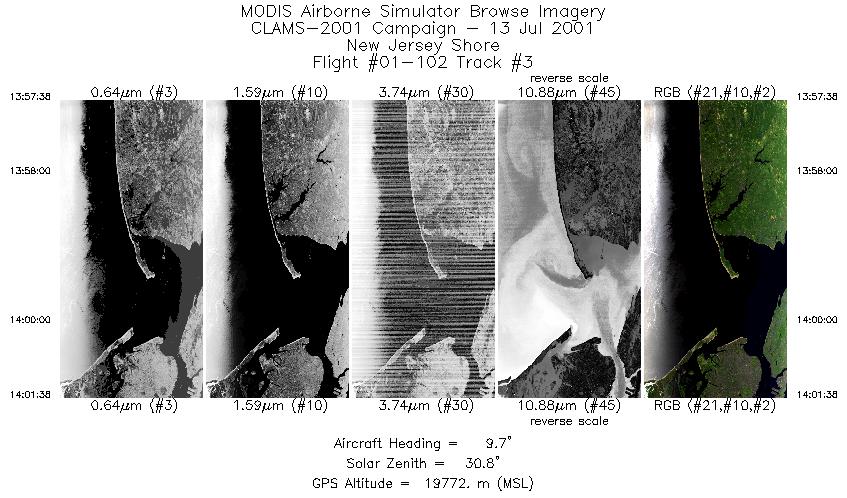
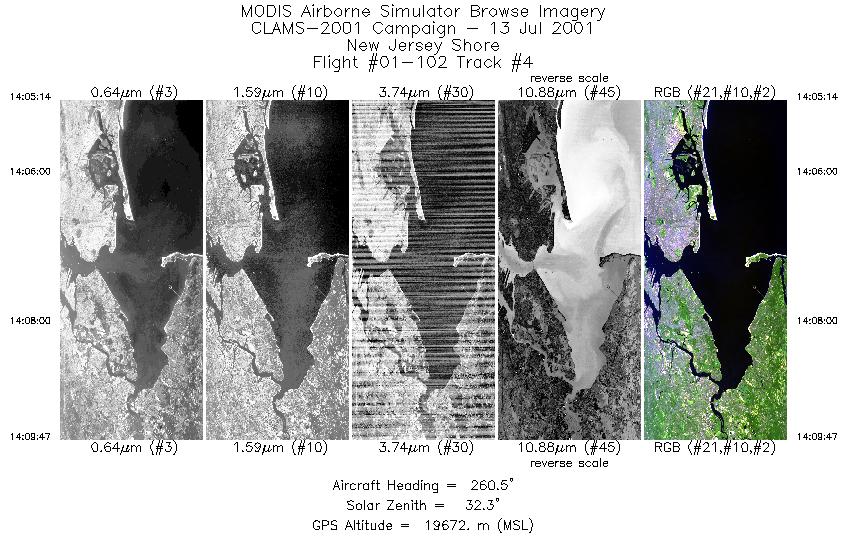
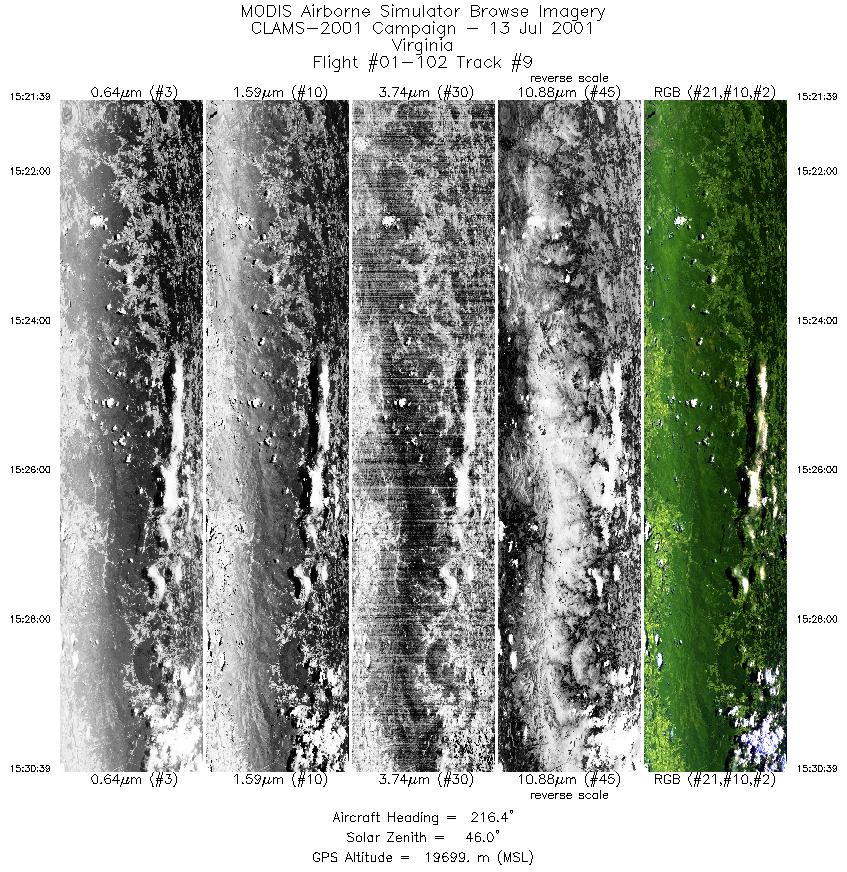
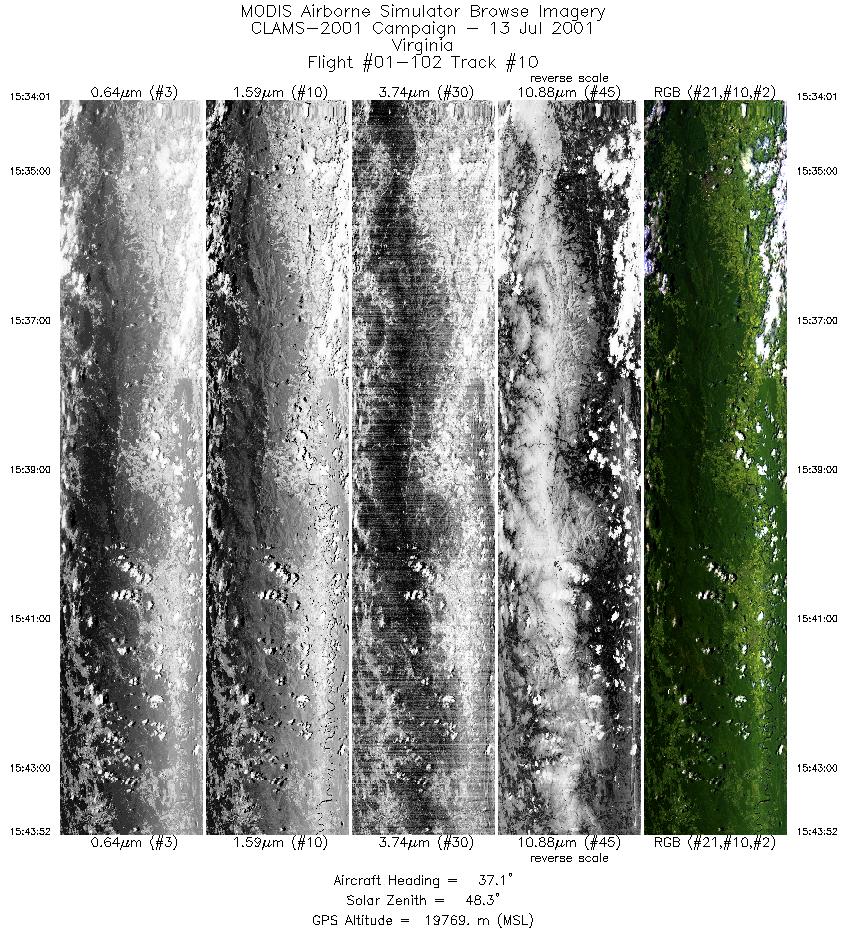
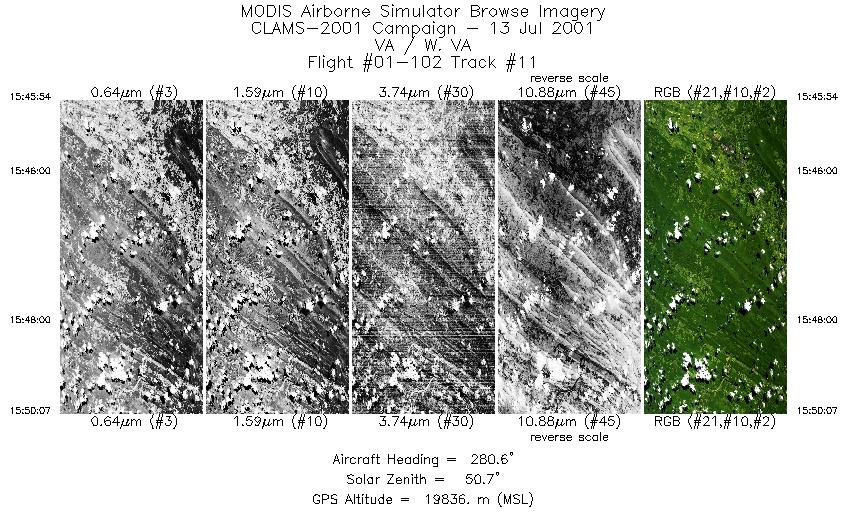
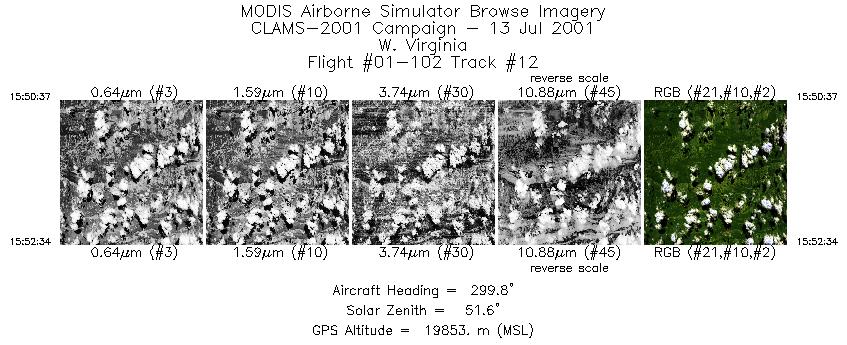
Flight: 01-102 Date: 13 July 2001 Location: Hudson River / Shenandoah N.P. / Green Ridge S.F. Deployment: CLAMS Principal Investigators: Bagheri (NJIT), Townsend (UMD) Additional Sensors: AVIRIS, AirMISR, Scanning HIS, 12" RC-10 (CIR) |
|||||||||||||||||||||||||||||||||||||||||||||||||||||||||||||||||||||||||||||||||||||||||||||||||||||||||||||||||||||||||||||||||||||
|
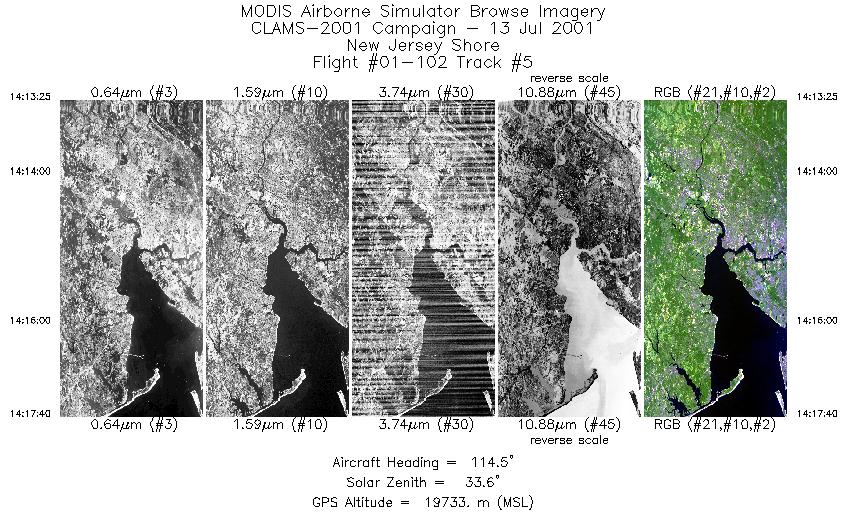
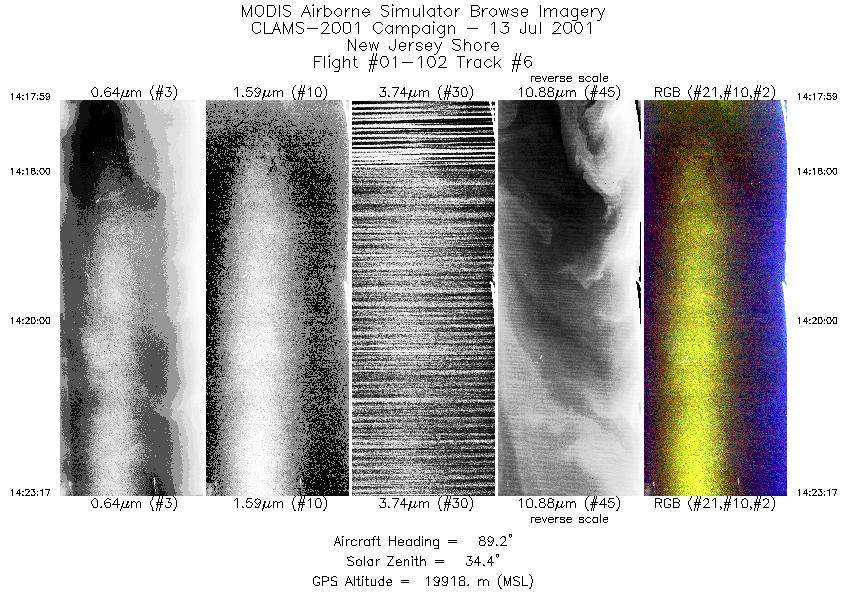
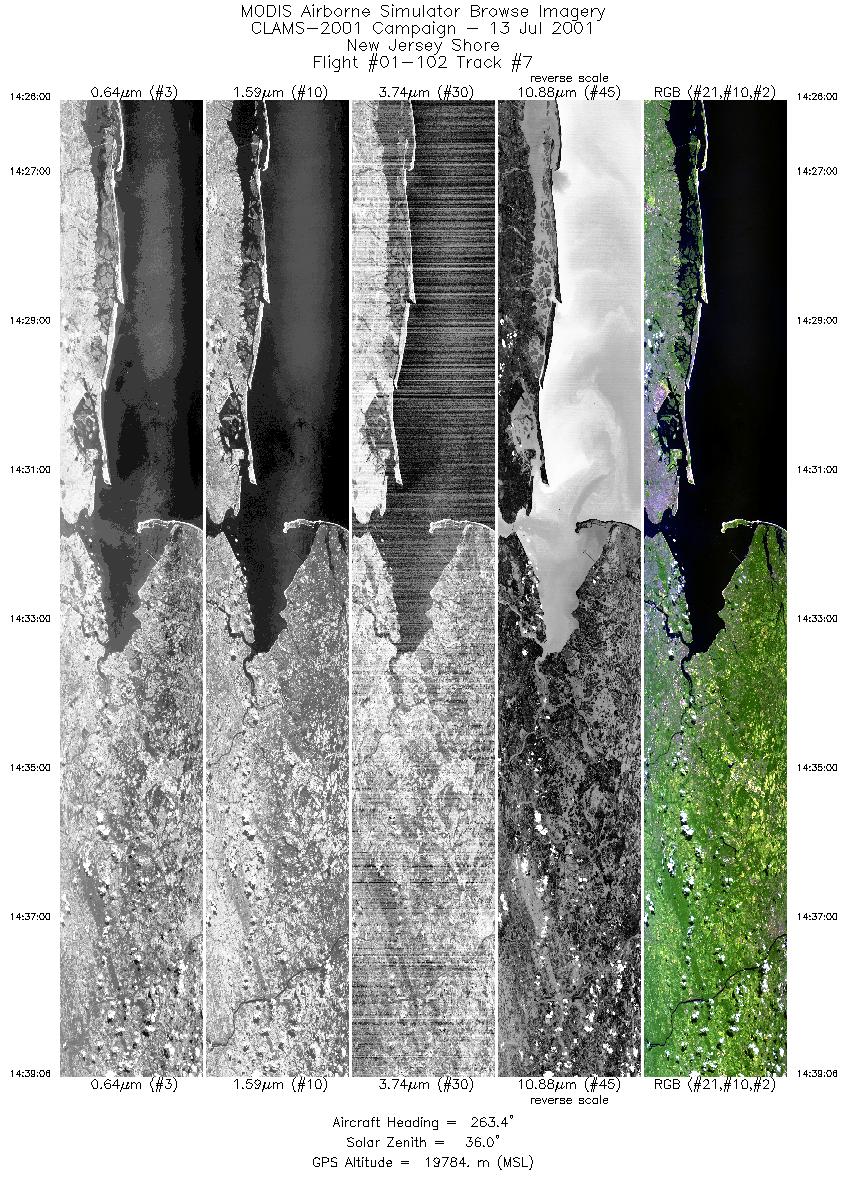
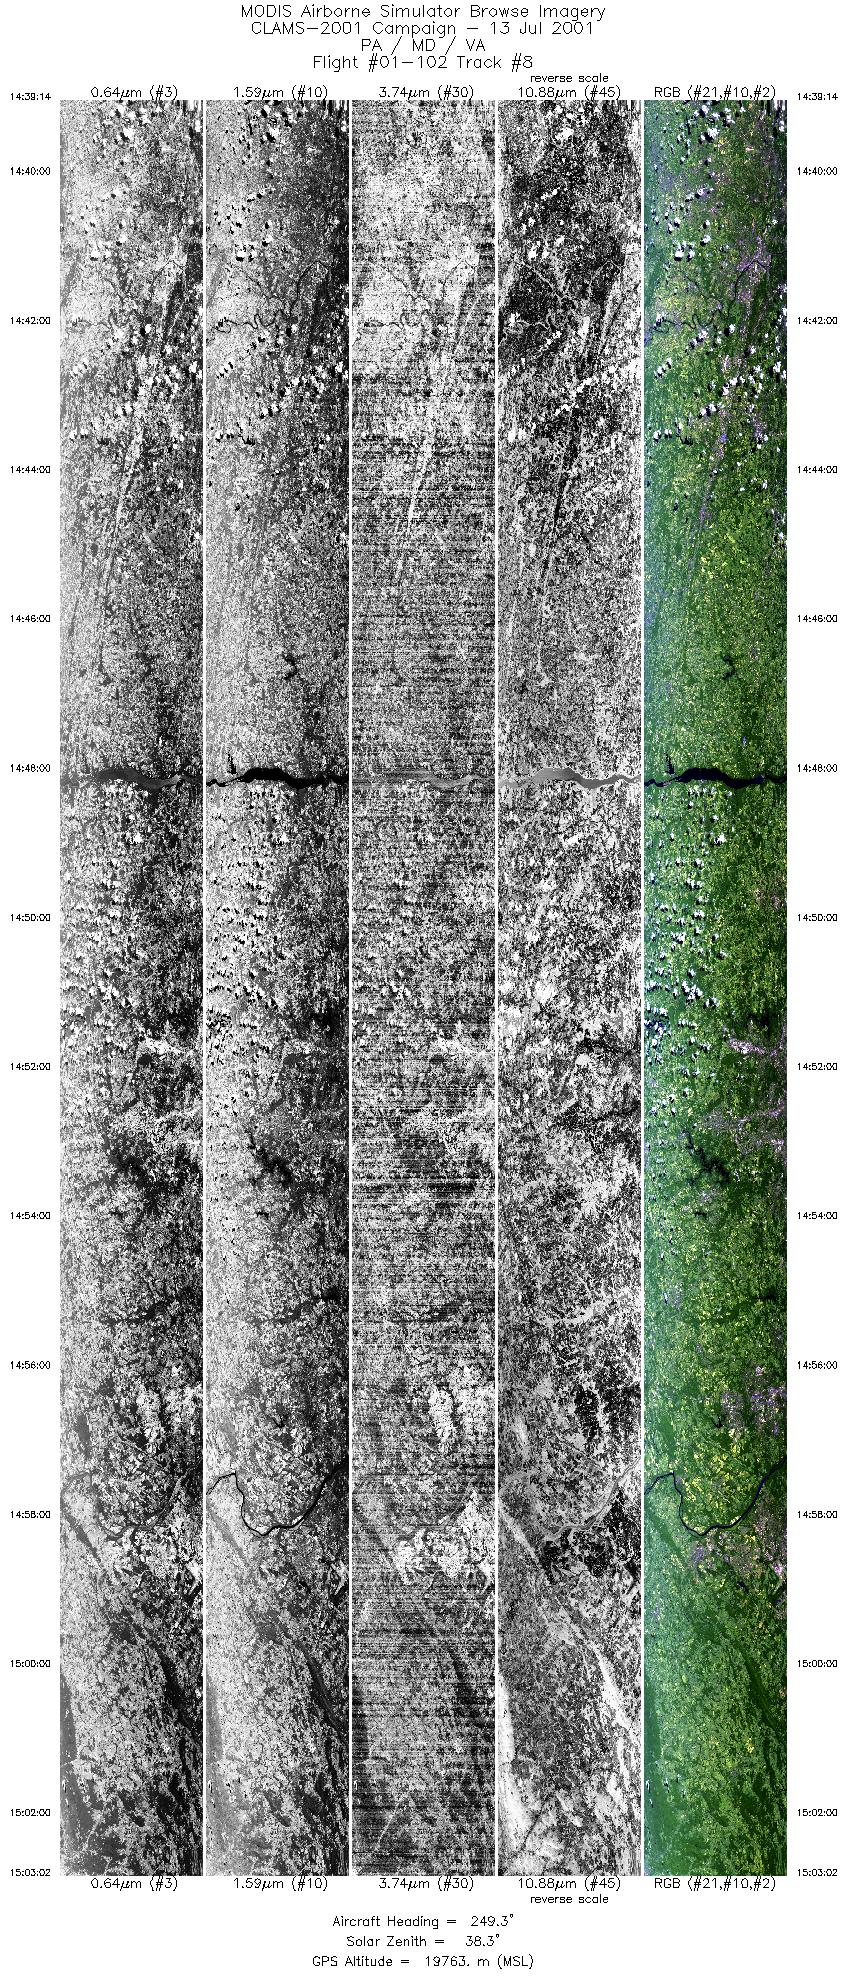
Data Evaluation Port 3 (bands 26-41; 3.04-5.44µm) exhibits severe coherent noise |
|||||||||||||||||||||||||||||||||||||||||||||||||||||||||||||||||||||||||||||||||||||||||||||||||||||||||||||||||||||||||||||||||||||
|
Processing Information Level-1B Data in HDF format is available Flight Line Summary Spectral Band Configuration Spectral Response Function Table |
|||||||||||||||||||||||||||||||||||||||||||||||||||||||||||||||||||||||||||||||||||||||||||||||||||||||||||||||||||||||||||||||||||||
|
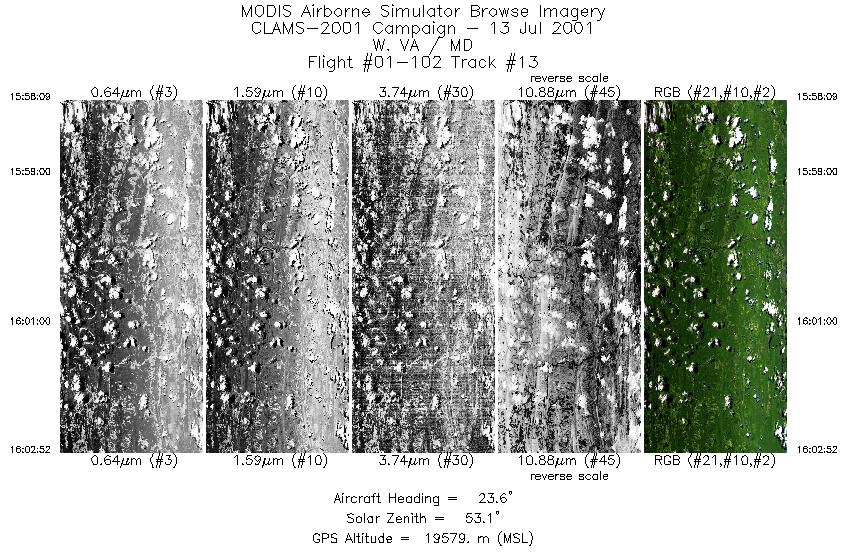
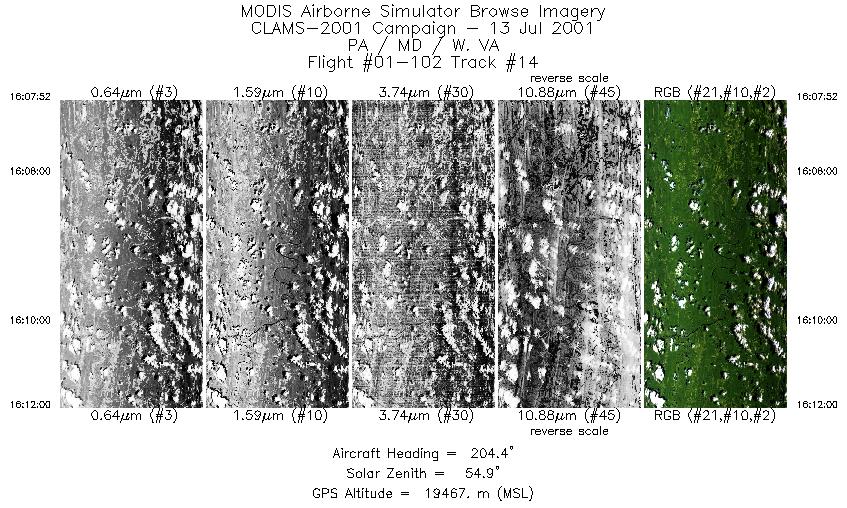
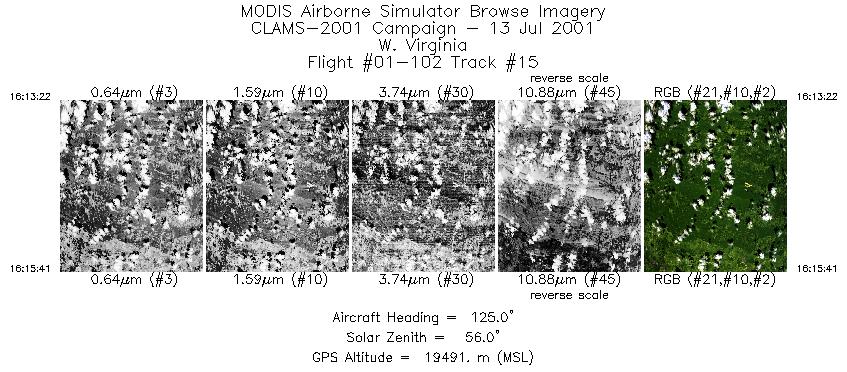
Browse Imagery Flight Tracks: 15 Scanlines: 42975 |
|||||||||||||||||||||||||||||||||||||||||||||||||||||||||||||||||||||||||||||||||||||||||||||||||||||||||||||||||||||||||||||||||||||
|
|||||||||||||||||||||||||||||||||||||||||||||||||||||||||||||||||||||||||||||||||||||||||||||||||||||||||||||||||||||||||||||||||||||

Flight 01-102


| Sample Imagery |
| Click image for full resolution |
|
Track #7 The Jersey Shore |


|
|
R: 2.15µm G: 1.64µm B: 0.55µm |
- NASA Official: Matt Fladeland
- Project Manager: James Jacobson
- Website Editor: Eric Fraim
- Last Updated: November 16, 2021


