


MODIS Airborne Simulator (MAS)
FLIGHT SUMMARY INFORMATION
Flight Track Map


|
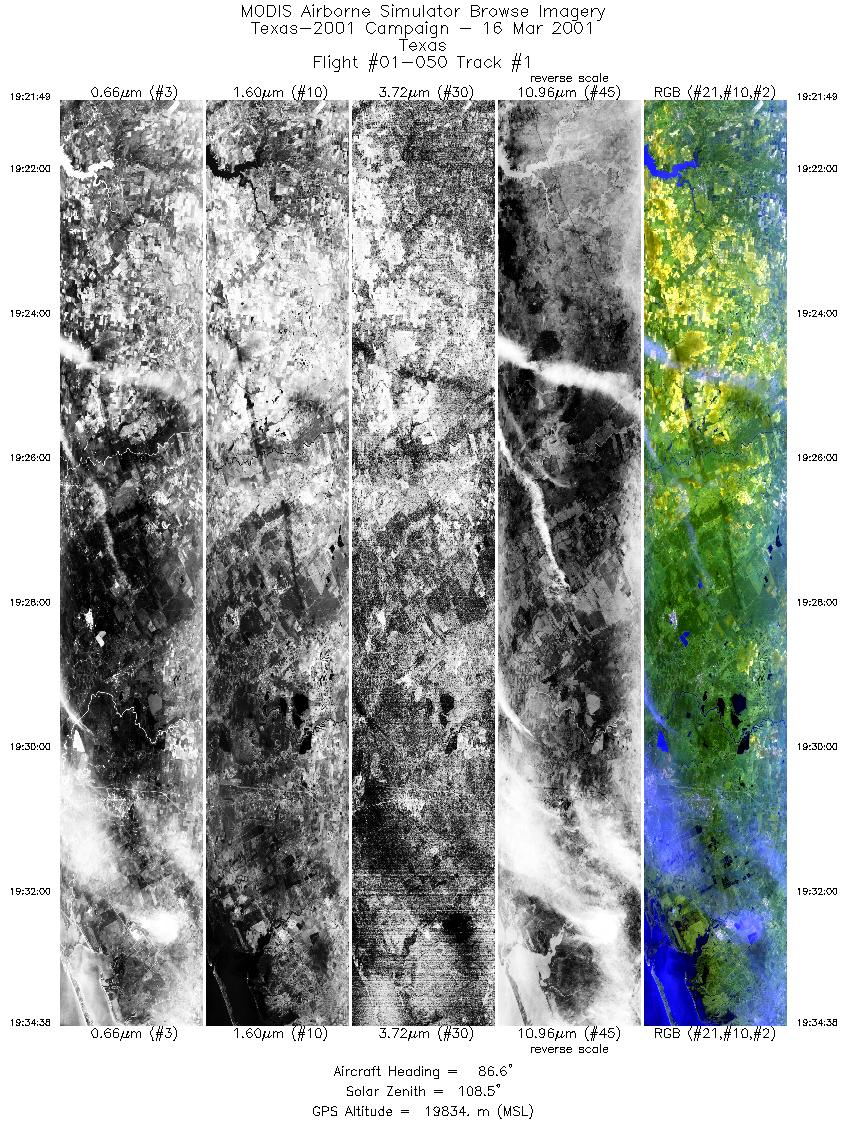
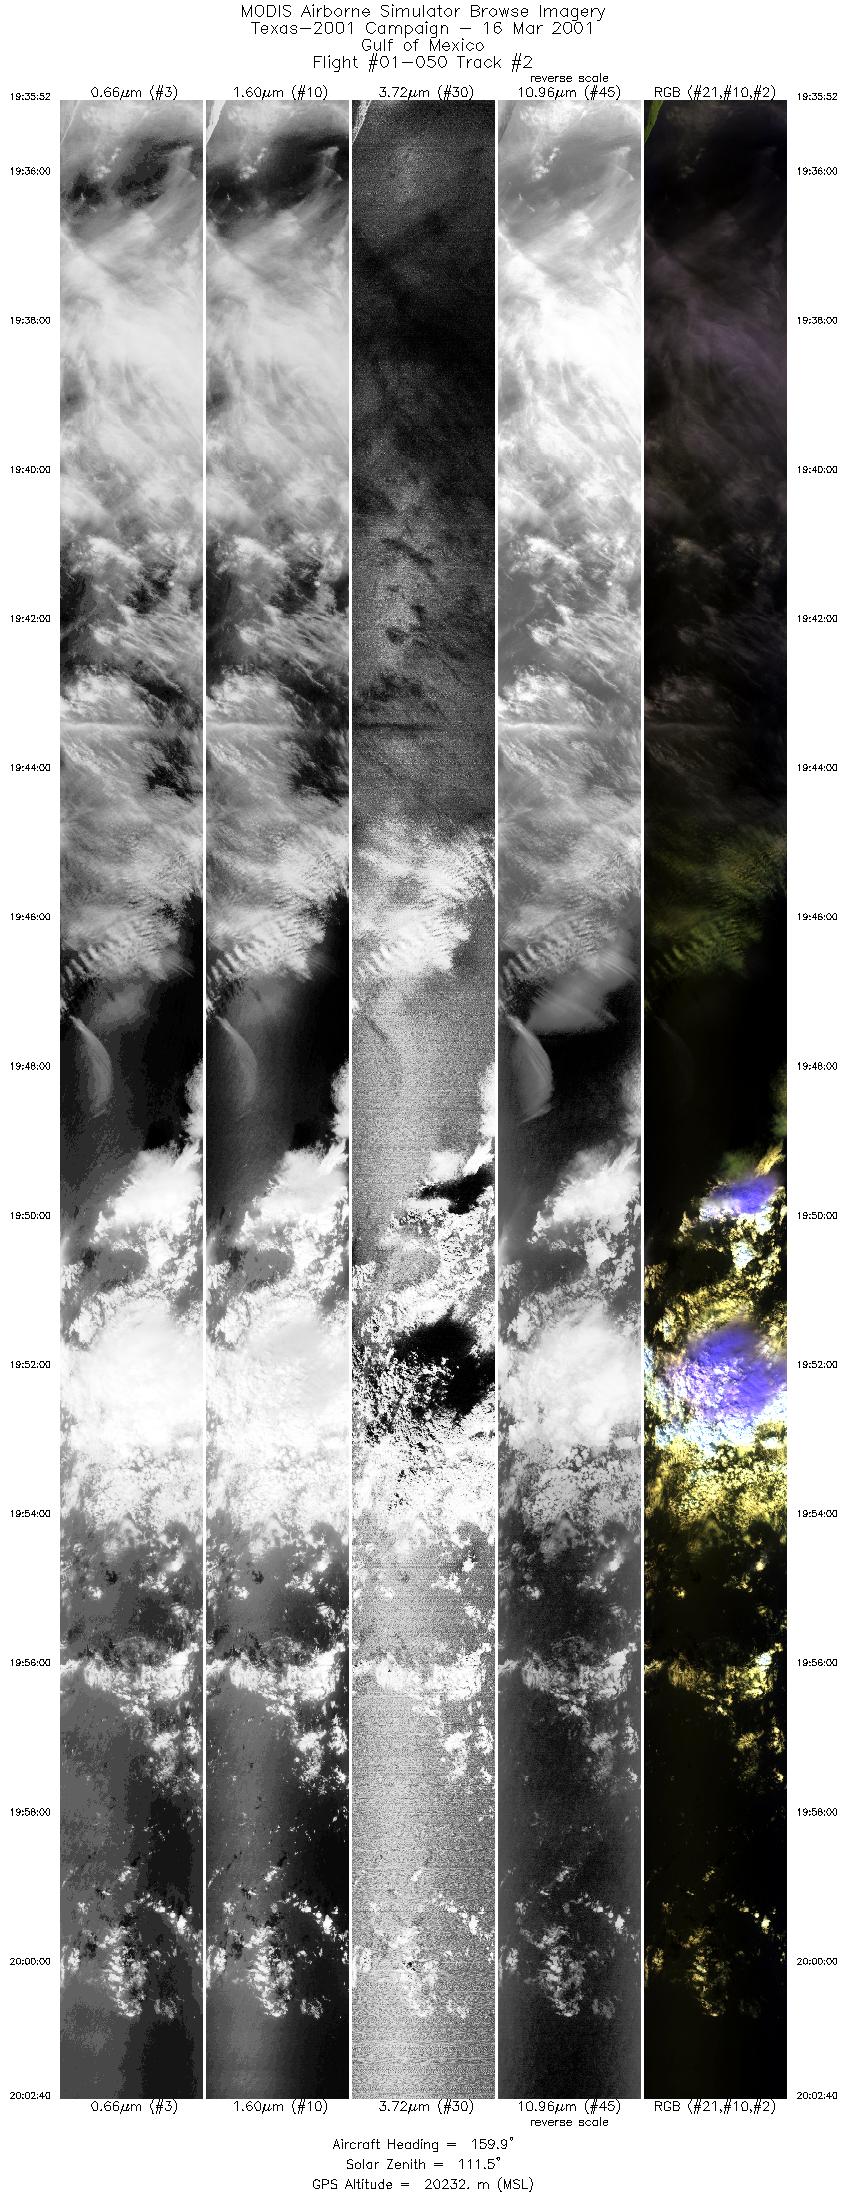
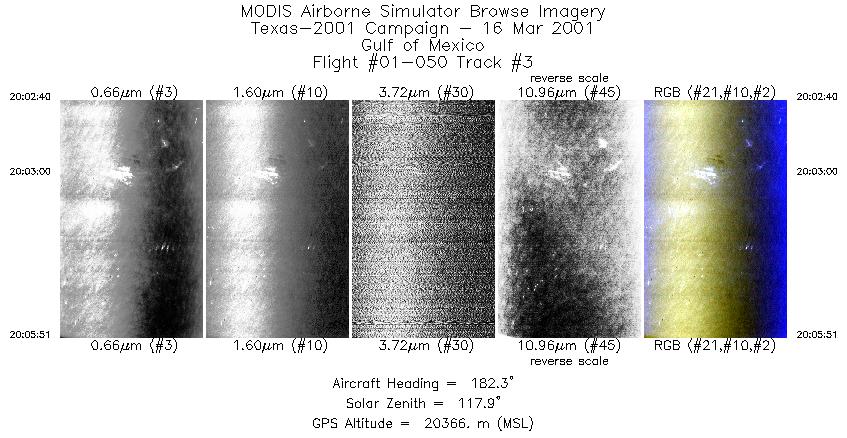
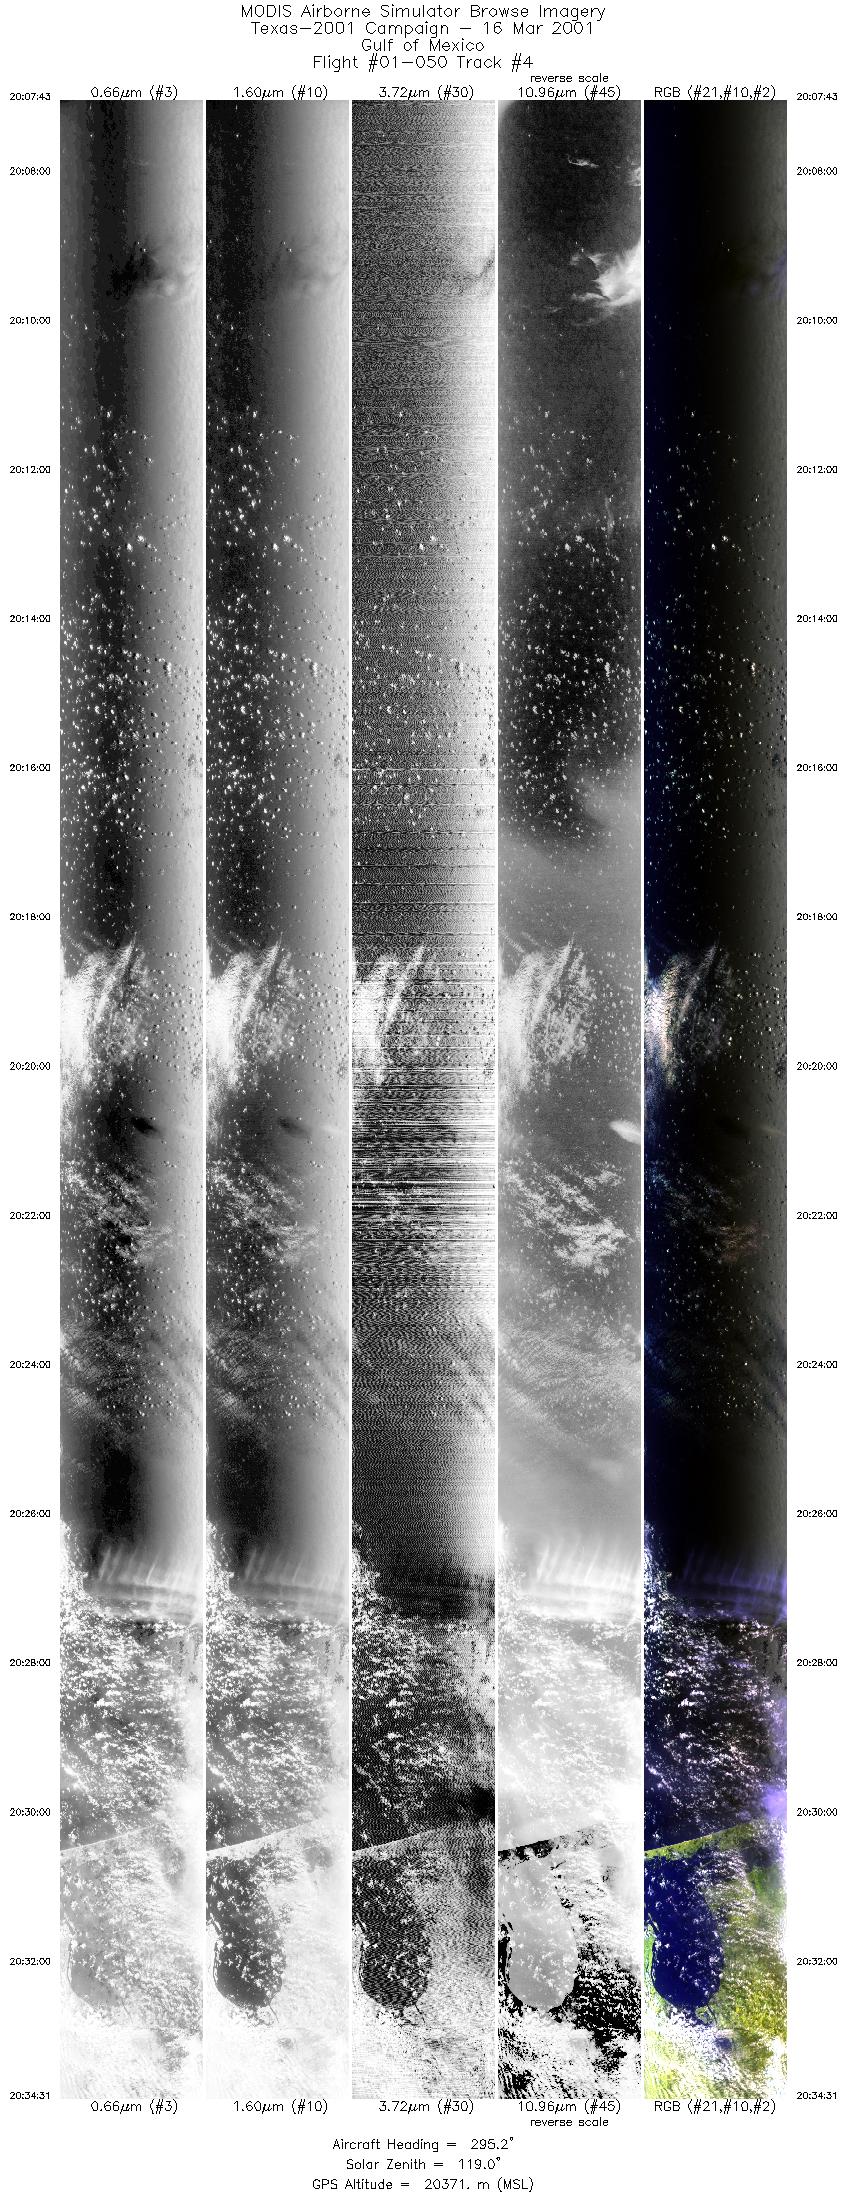
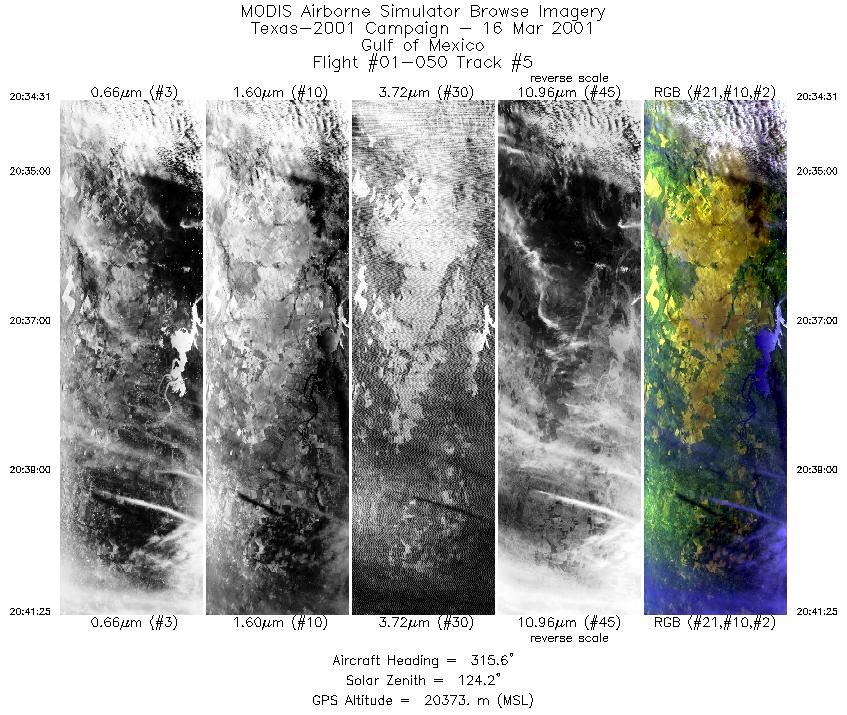
Flight: 01-050 Date: 16 March 2001 Location: Texas / Gulf of Mexico Deployment: TX-2001 Principal Investigators: Moeller (UWisc) Additional Sensors: S-HIS, VIS, Dual 12" RC-10 (BW, CIR) Objective: Checkout S-HIS and MAS instrument performance, including noise estimates |
|||||||||||||||||||||||||||||||||||||||||||||||||||||||||||||||||||||||||||||
|
Data Evaluation Overall quality is good This was a rather bumpy flight, some turbulence is evident in the video data. Port 3 (bands 26-41; 3.04-5.44µm) is very noisy and performed much more poorly than the last flight. The MAS timecode generator was accidently turned off prior to flight; time code from the RS232 NAV data was used for Level-1B processing. |
|||||||||||||||||||||||||||||||||||||||||||||||||||||||||||||||||||||||||||||
|
Processing Information Level-1B Data in HDF format is available Flight Line Summary Spectral Band Configuration Spectral Response Function Table |
|||||||||||||||||||||||||||||||||||||||||||||||||||||||||||||||||||||||||||||
|
Browse Imagery Flight Tracks: 7 Scanlines: 34194 |
|||||||||||||||||||||||||||||||||||||||||||||||||||||||||||||||||||||||||||||
|
|||||||||||||||||||||||||||||||||||||||||||||||||||||||||||||||||||||||||||||

Flight 01-050


| Sample Imagery |
| Click image for full resolution |
|
Track #1 Texas |


|
|
R: 2.13µm G: 1.62µm B: 0.55µm |
- NASA Official: Matt Fladeland
- Project Manager: James Jacobson
- Website Editor: Eric Fraim
- Last Updated: November 16, 2021


