


MODIS Airborne Simulator (MAS)
FLIGHT SUMMARY INFORMATION


|
Flight: 00-152 Date: 27 August 2000 Location: South Africa and Botswana Deployment: SAFARI Principal Investigator: Dr. Michael King (NASA GSFC) Flight Scientist: Dr. Michael King (NASA GSFC) Additional Sensors: AirMISR, CLS, LAS, MOPITT-A, S-HIS, & SSFR Objective: To understand the key linkages between the physical, chemical and biological processes, including human activities, that comprise the southern African biogeophysical system. |
||||||||||||||||||||||||||||||||||||||||||||||||||||||||||||||||||||||||||||||||||||||||||||||||||||||||||||||||||||||||||||||||||||||||||||
|
Data Evaluation Overall quality is good |
||||||||||||||||||||||||||||||||||||||||||||||||||||||||||||||||||||||||||||||||||||||||||||||||||||||||||||||||||||||||||||||||||||||||||||
|
Processing Information Level-1B Data in HDF format is available Flight Line Summary Spectral Band Configuration Spectral Response Function Table |
||||||||||||||||||||||||||||||||||||||||||||||||||||||||||||||||||||||||||||||||||||||||||||||||||||||||||||||||||||||||||||||||||||||||||||
|
Browse Imagery Flight Tracks: 16 Scanlines: 102007 |
||||||||||||||||||||||||||||||||||||||||||||||||||||||||||||||||||||||||||||||||||||||||||||||||||||||||||||||||||||||||||||||||||||||||||||
|
||||||||||||||||||||||||||||||||||||||||||||||||||||||||||||||||||||||||||||||||||||||||||||||||||||||||||||||||||||||||||||||||||||||||||||
|
Flight Summary Report Author: Dr. Michael King Mission Scientist: Dr. Michael King ER-2 Pilot: Ken Broda Takeoff: 0745 (UTC) Landing: 1420 (UTC) Duration: 6:35 (h:mm) Objective and Summary:
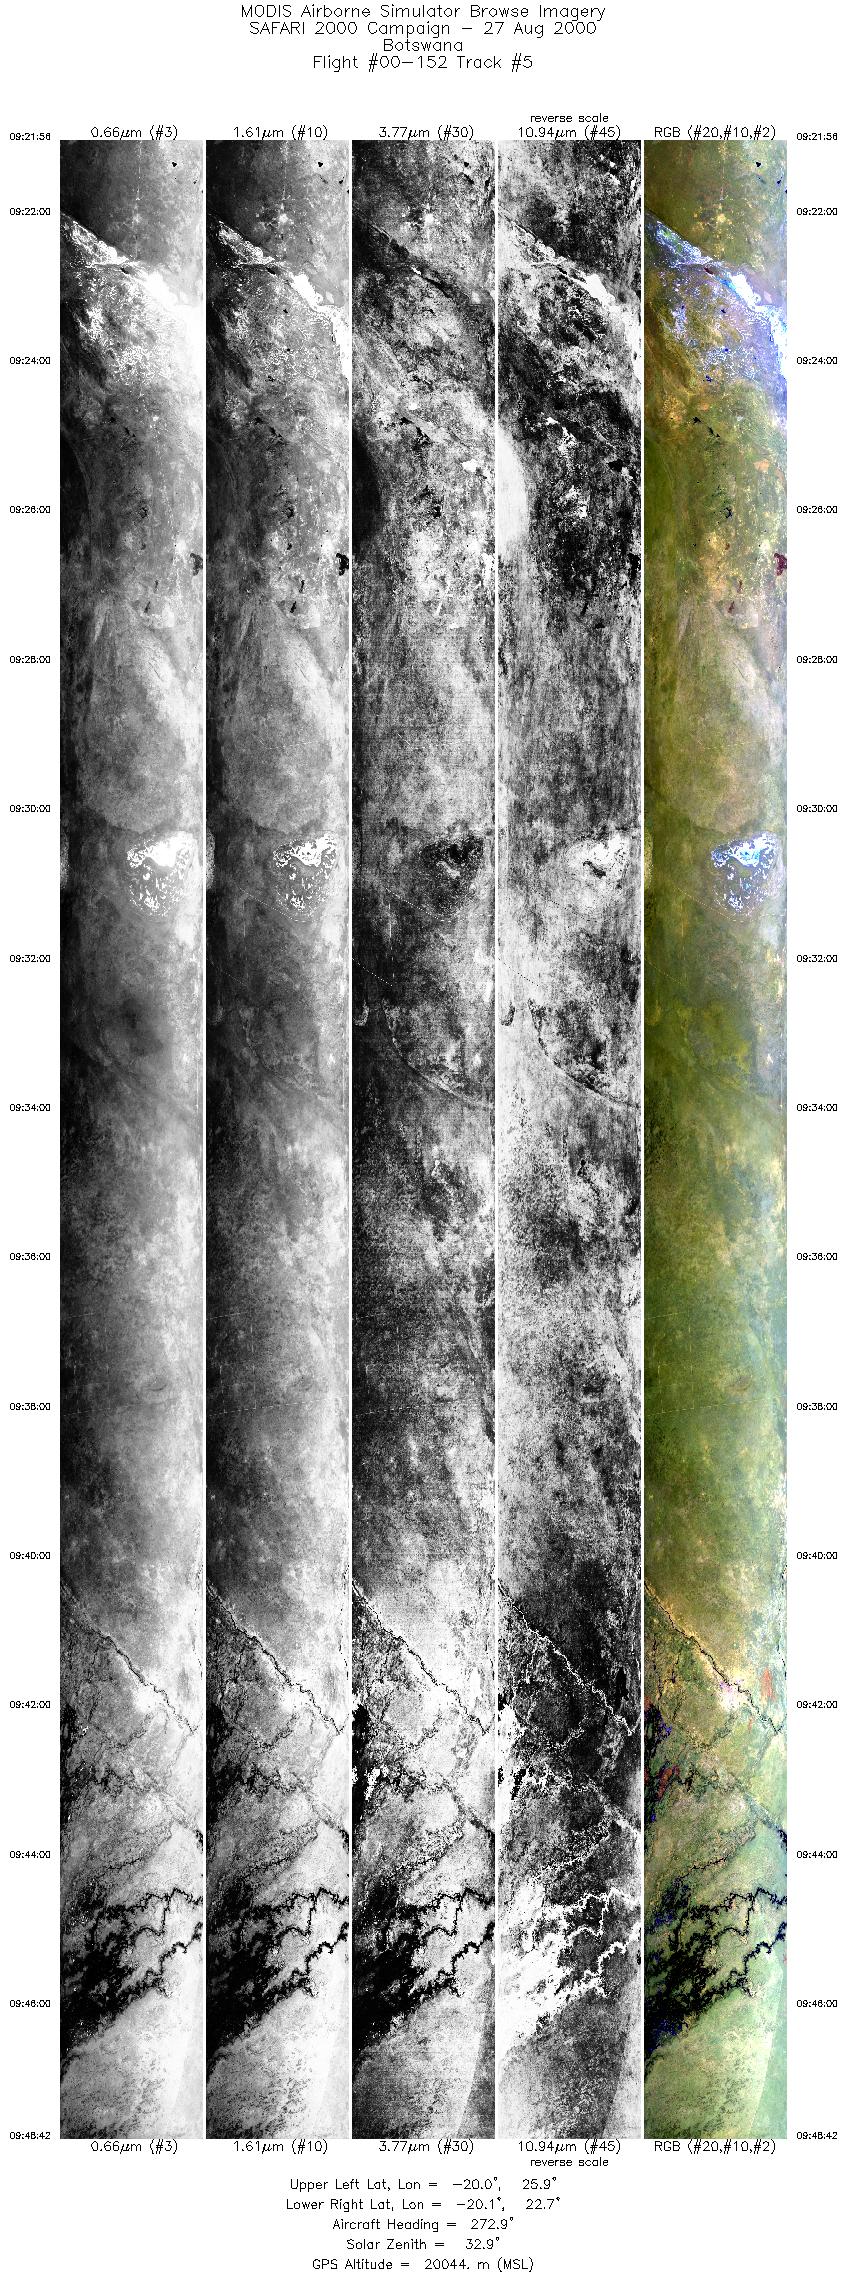
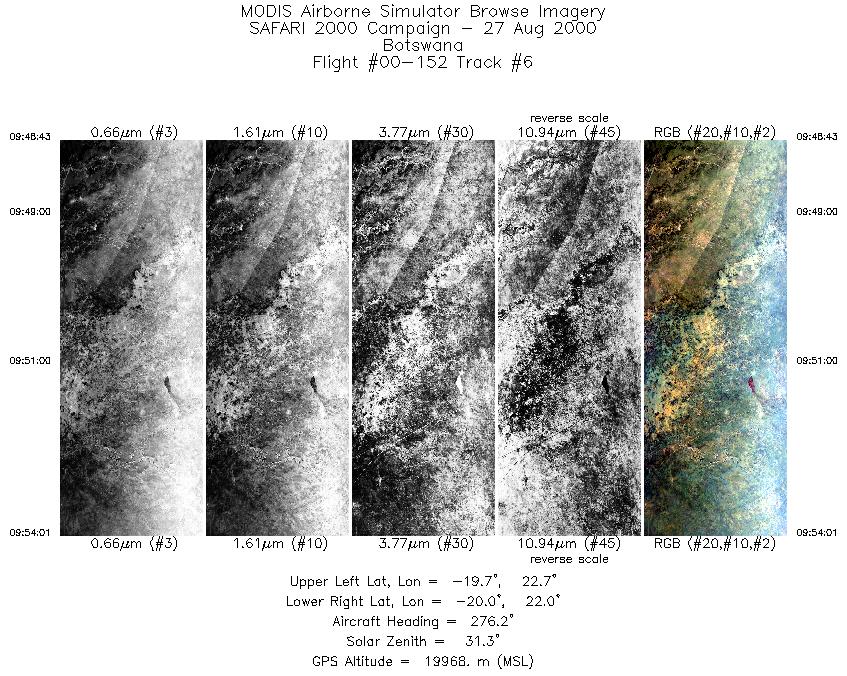
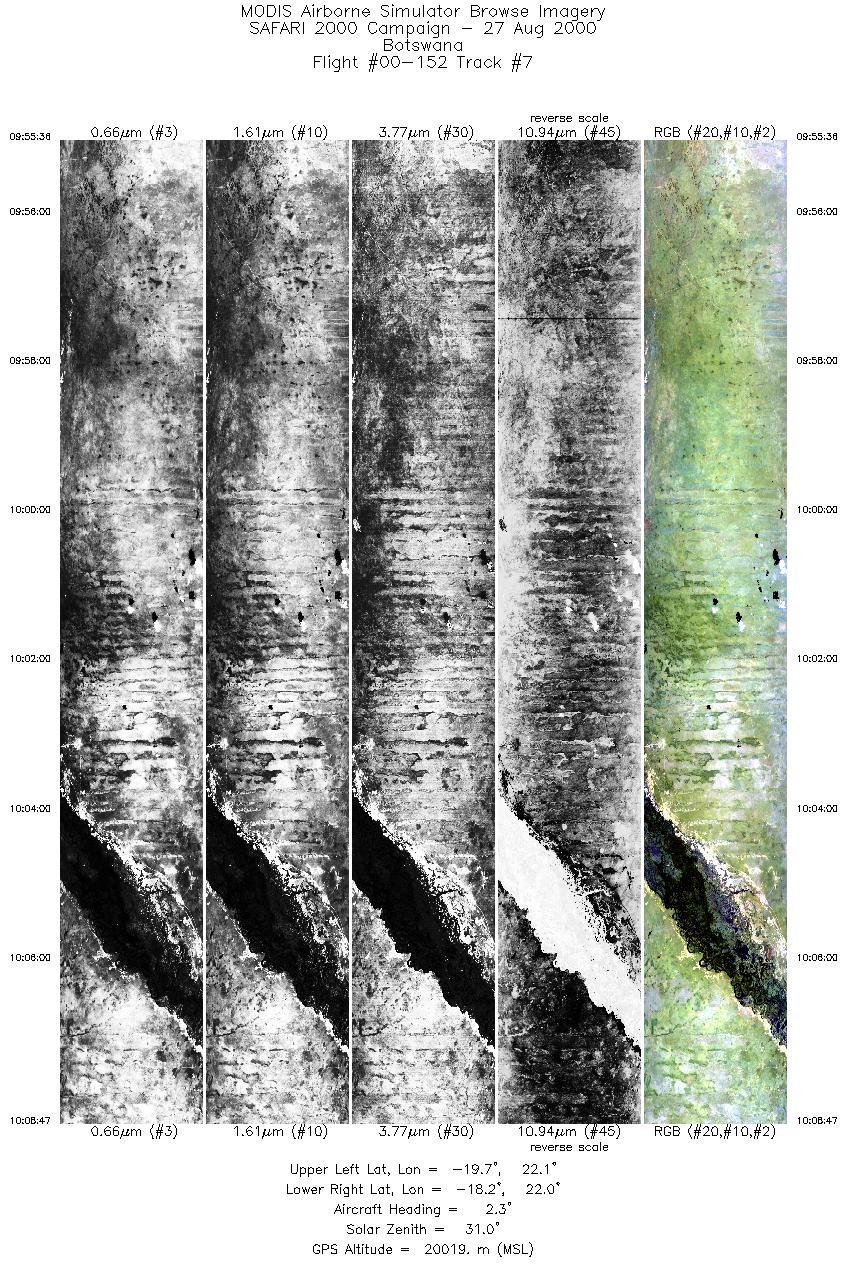
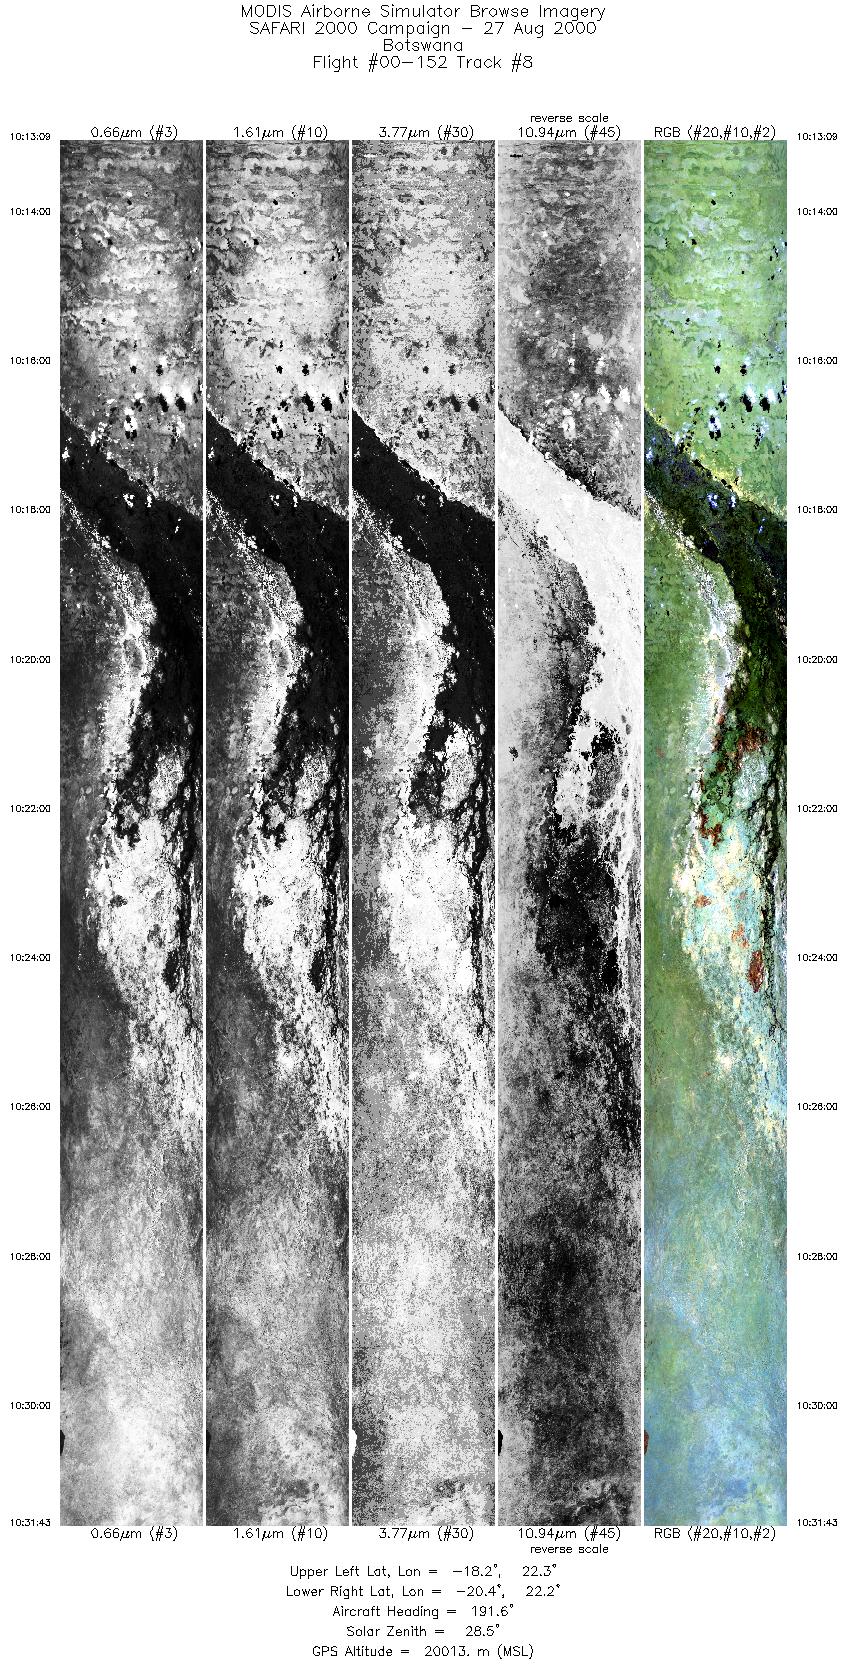
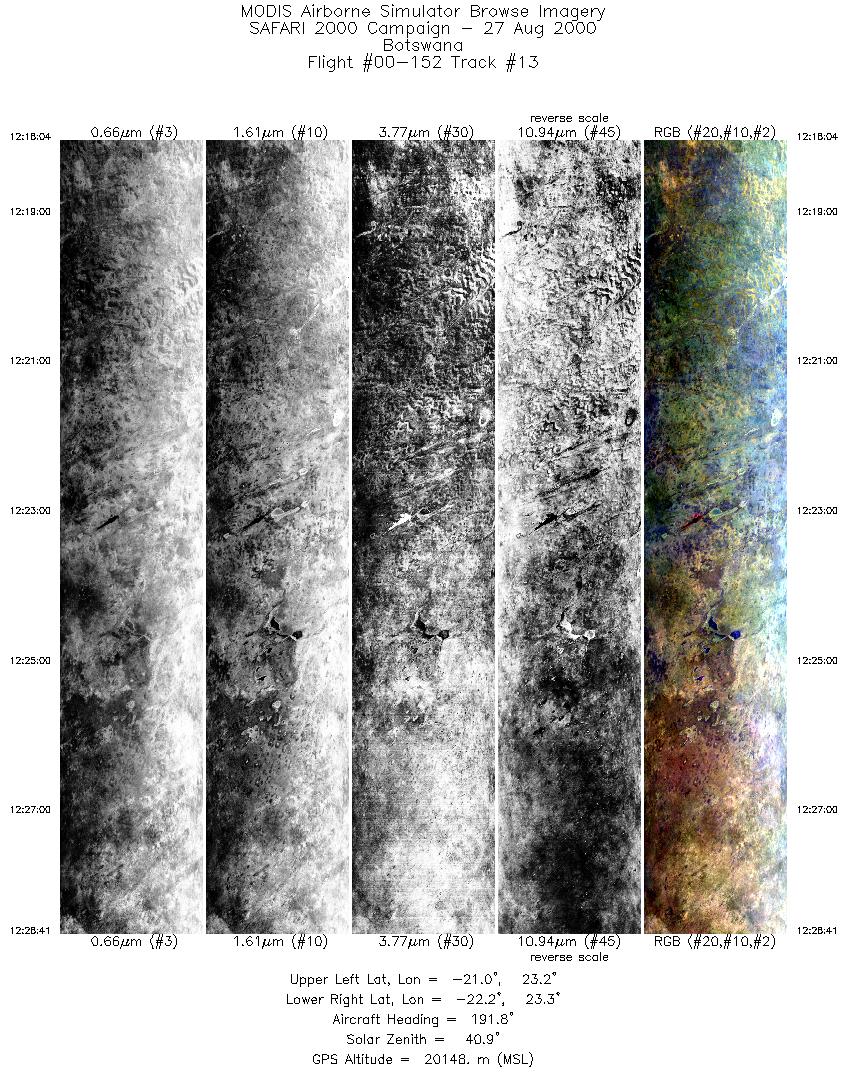
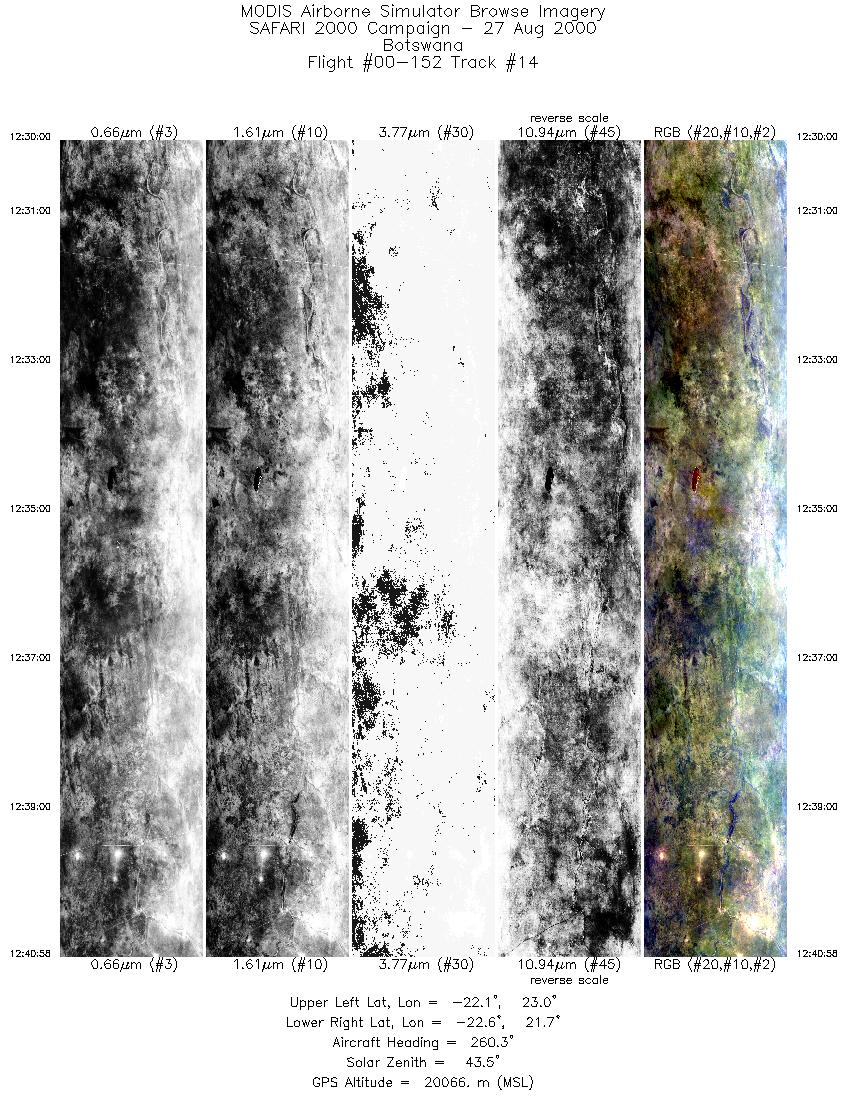
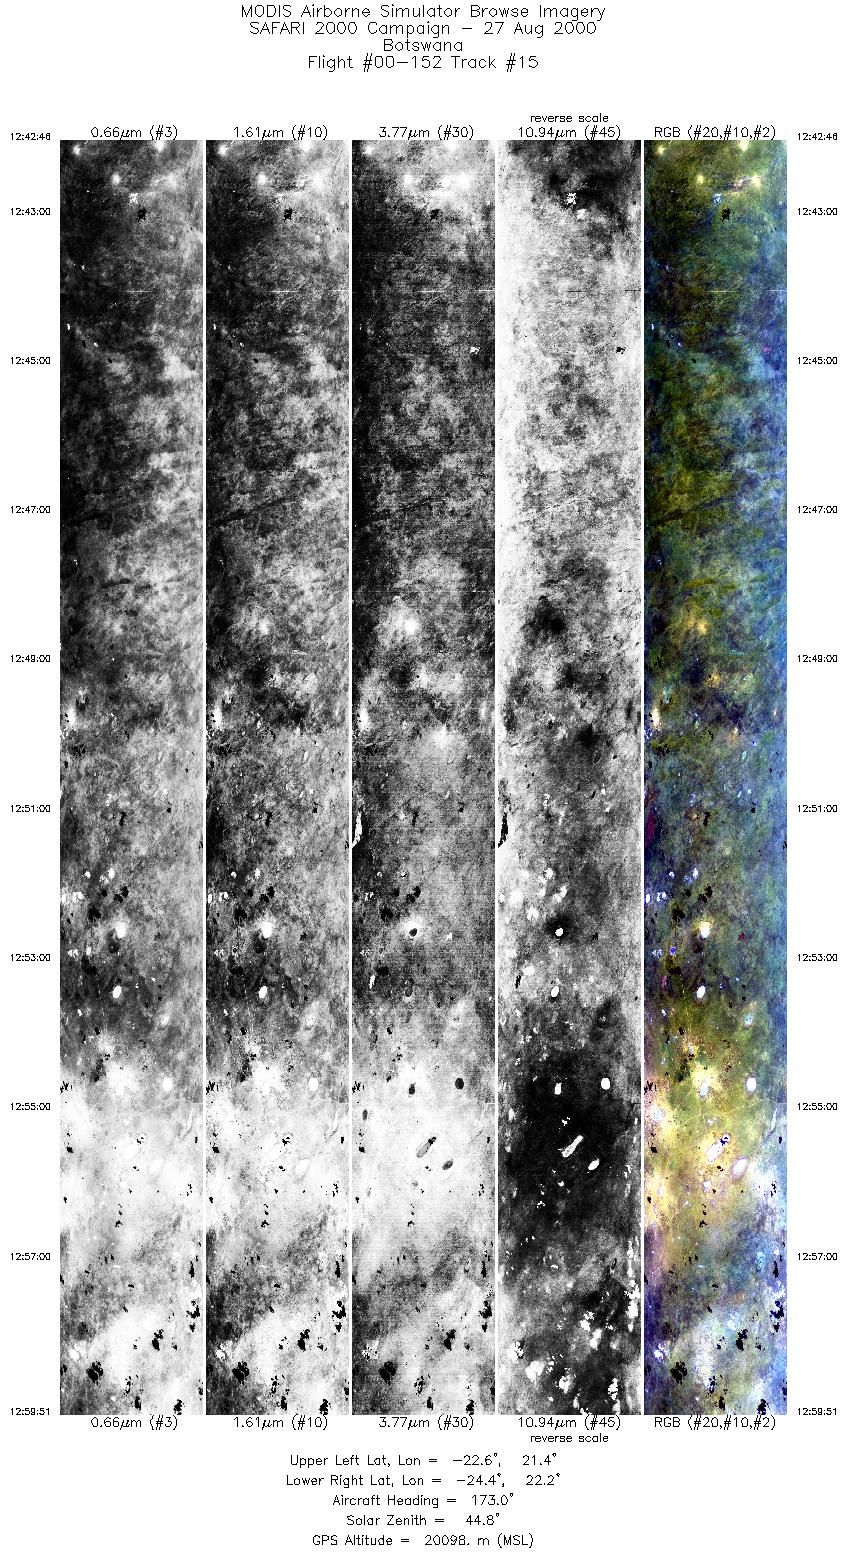
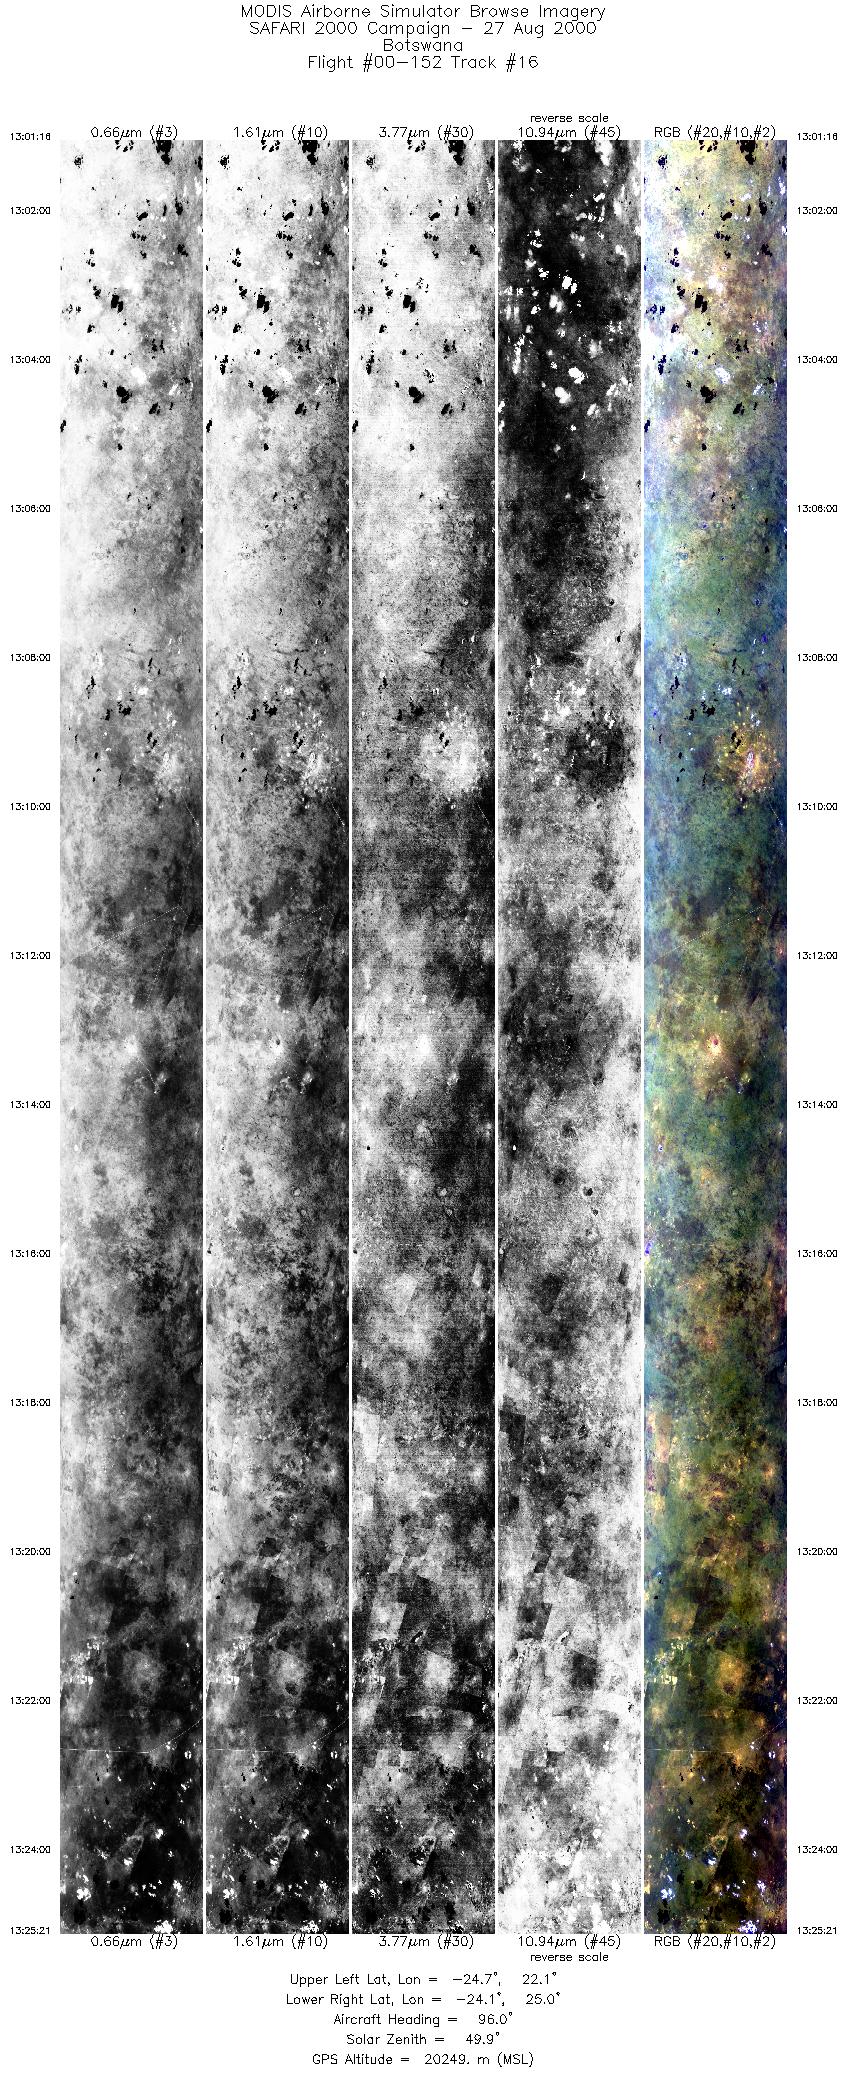
The ER-2 made two flight legs 208 km in length over the Sowa Pan along the orbital inclination of Terra (192.0°), passing over the ground site at ~0845 UTC. The ER-2 then flew over the Maun Tower and proceeded across the Okavango Delta, where it turned and made a series of 6 parallel flight lines mapping out the entire delta region. The final flight leg took it once again over the Maun Tower en route to two sites that were characterized in detail during the Kalahari Transect in March (Okwa River Crossing at 22° 24´ S, 21° 43´ E and Tsane at 24° 09´ S, 21° 54´ E). The RC-10 camera was turned on for flights over Francistown and Sowa Pan (both flight legs), Maun Tower, the Okwa River Crossing, and Tsane. Highlights:N/A AERONET sites and features overflown during this mission:
The skies were largely cloud free and the visibility quite clear. The pilot noted some fires and burn scars in and around the Okavanga Delta. Meteorology:The Atlantic High ridged along the south and southeast coast, inducing southeasterlies and partly cloudy conditions. The Indian Ocean High continued to induce southeasterlies over the lowveld and Mozambique, causing partly cloudy skies over these areas. The well-established high over the interior forced another sunny day over the interior. ER-2 Science Instrument Payload Status
|
||||||||||||||||||||||||||||||||||||||||||||||||||||||||||||||||||||||||||||||||||||||||||||||||||||||||||||||||||||||||||||||||||||||||||||

Flight 00-152


| Sample Imagery |
| Click image for full resolution |
|
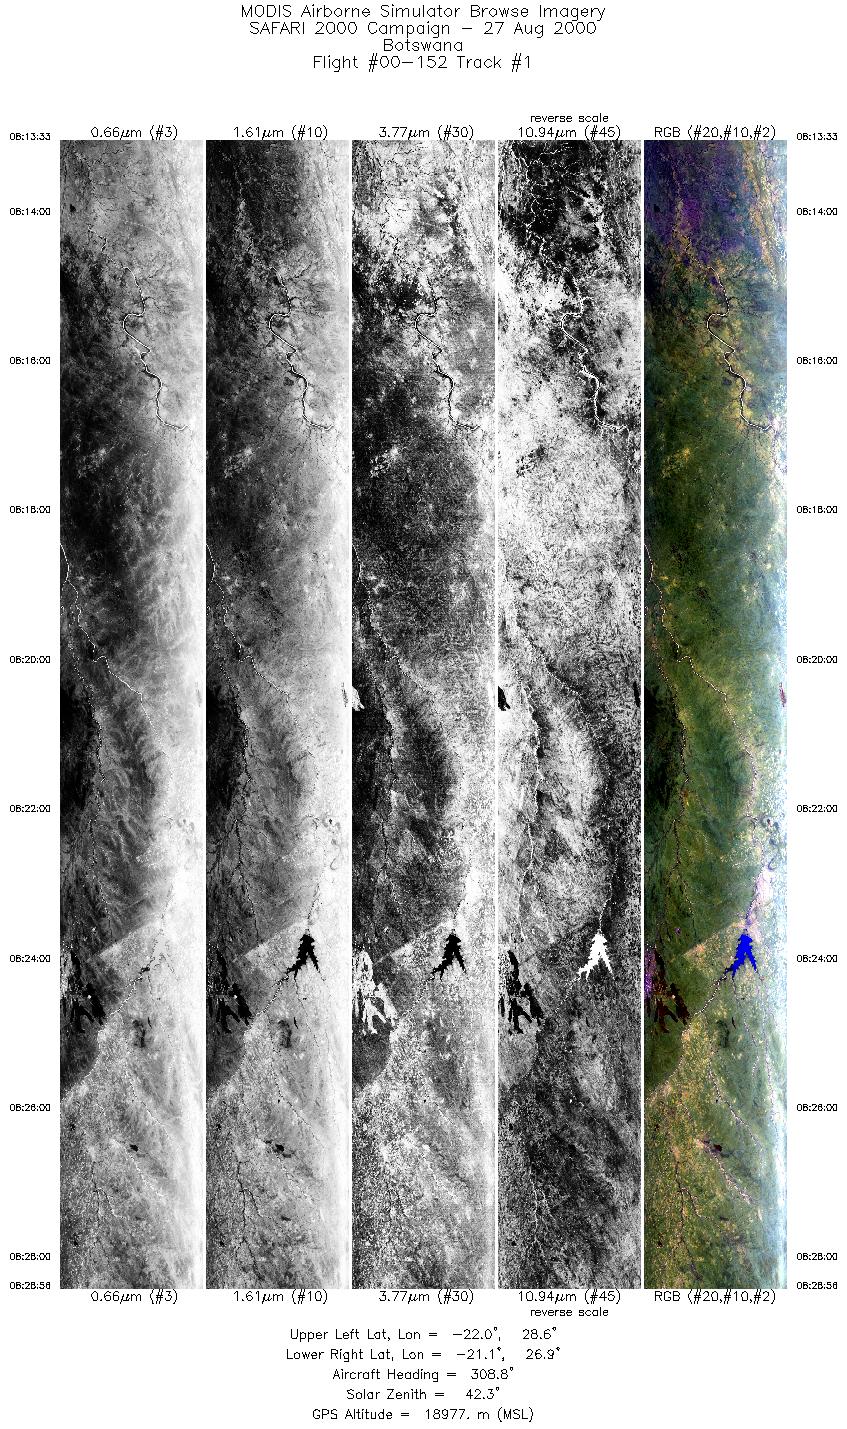
Track #1 Botswana |


|
|
R: 11.01µm G: 2.15µm B: 0.46µm |
| Sample Imagery |
| Click image for full resolution |
|
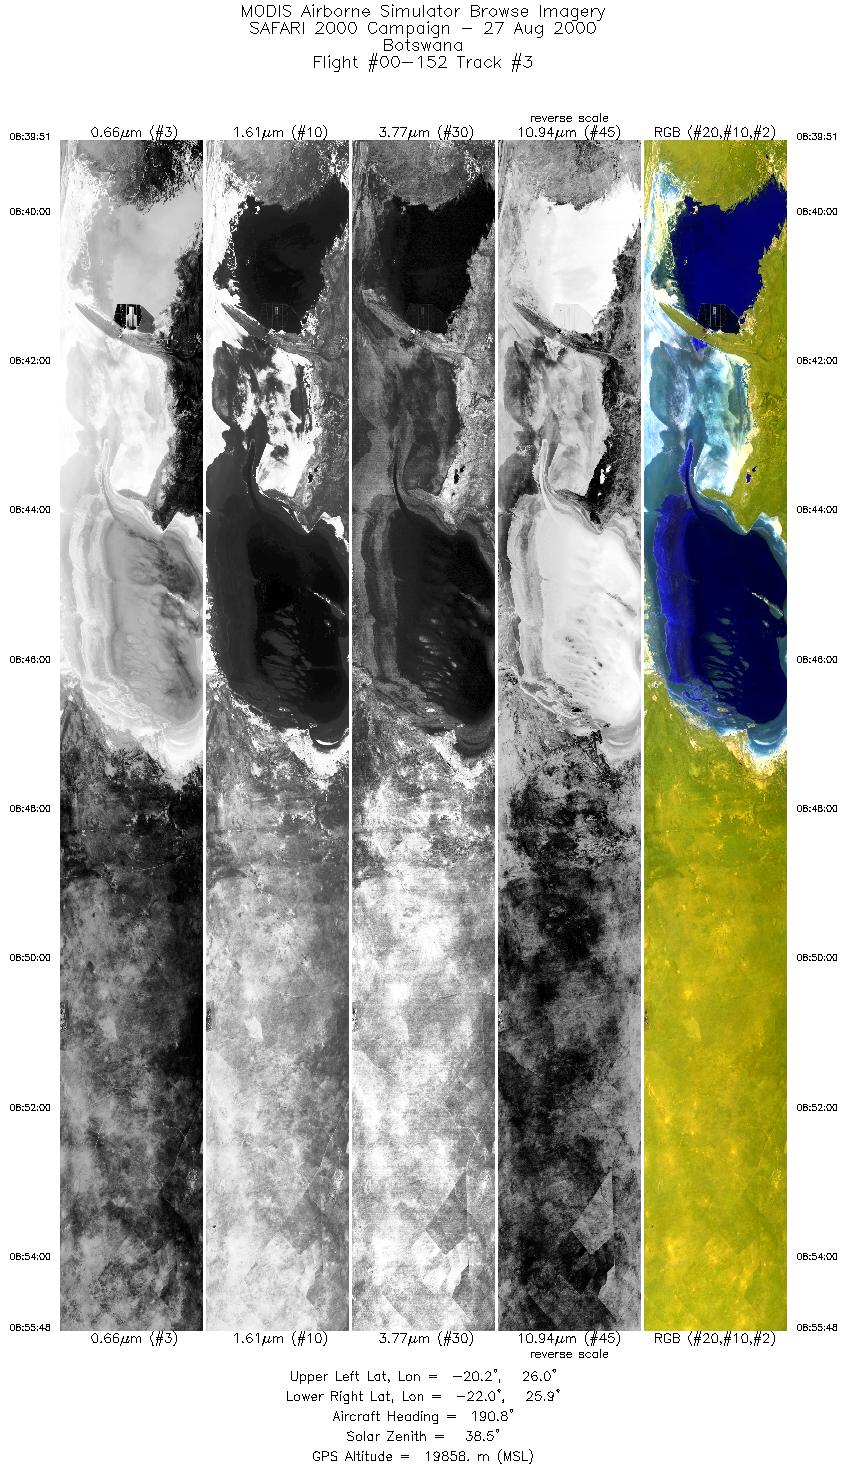
Track #3 Botswana |

|
|
R: 11.01µm G: 2.15µm B: 0.46µm |
- NASA Official: Matt Fladeland
- Project Manager: James Jacobson
- Website Editor: Eric Fraim
- Last Updated: November 16, 2021


