


MODIS Airborne Simulator (MAS)
FLIGHT SUMMARY INFORMATION
Flight Track Map


|
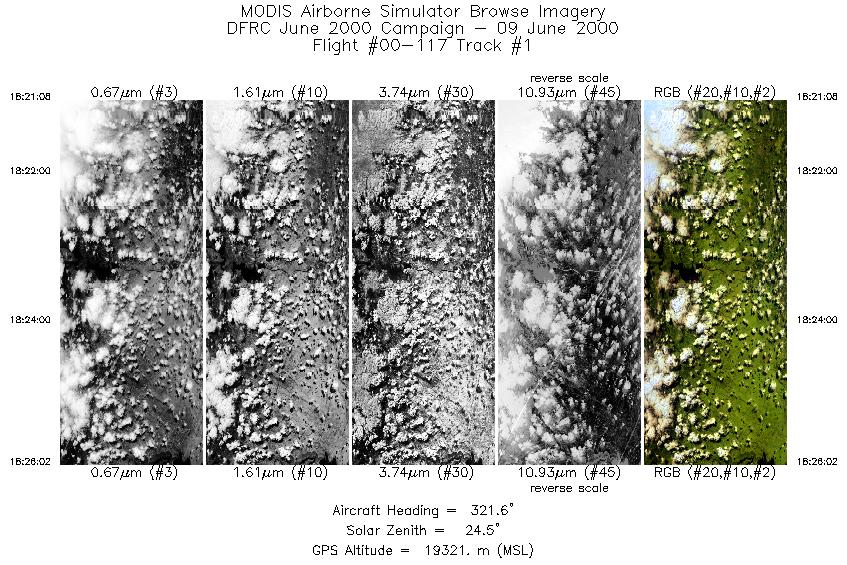
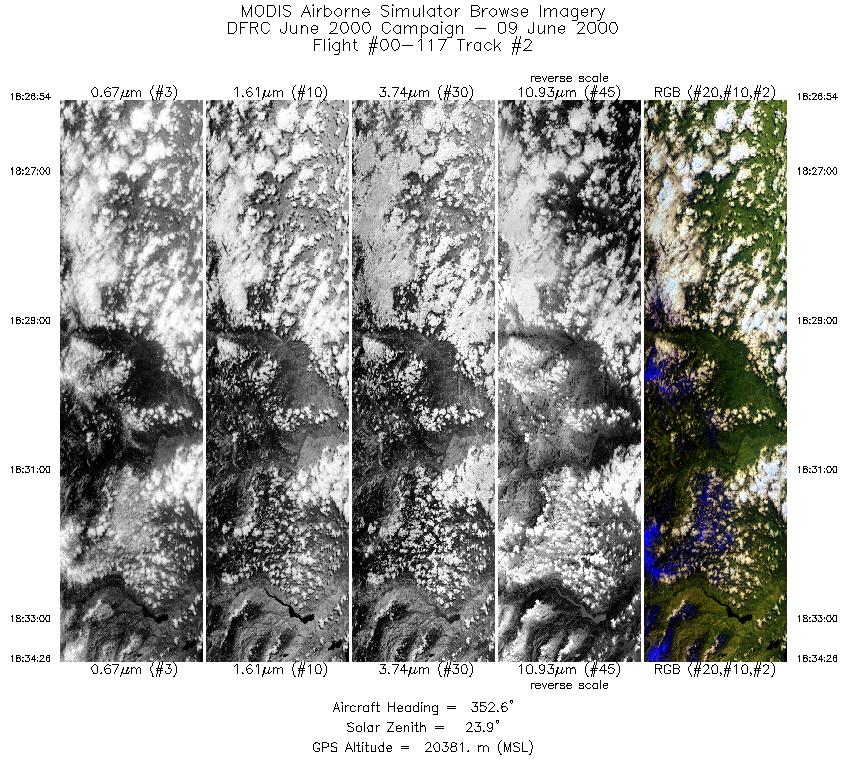
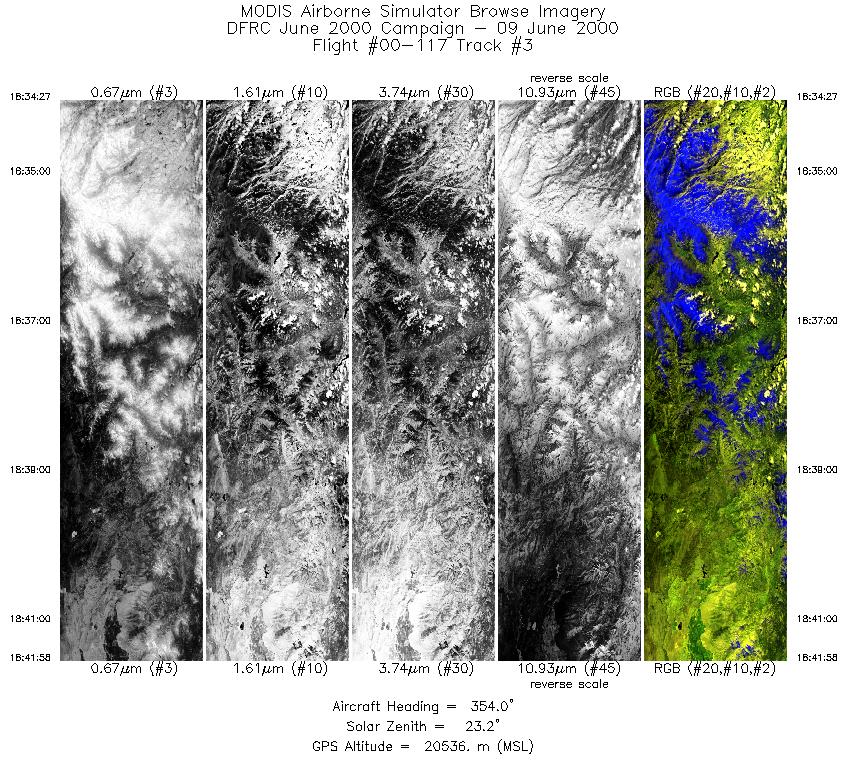
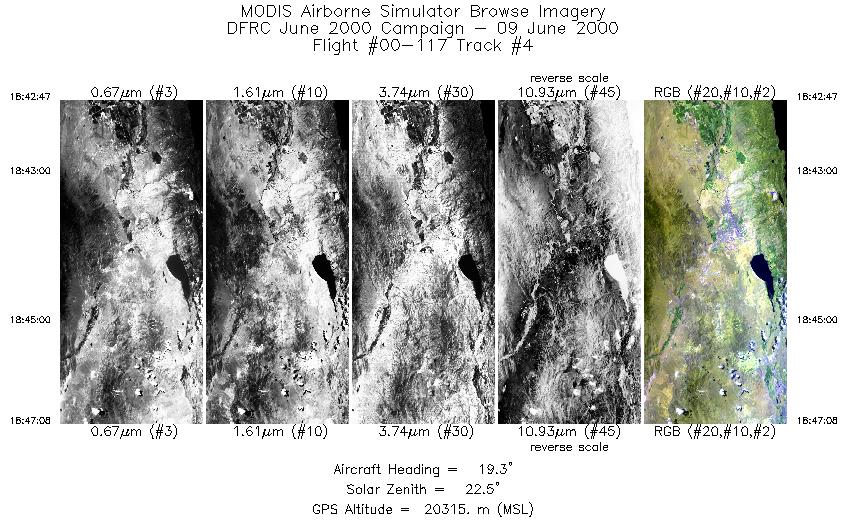
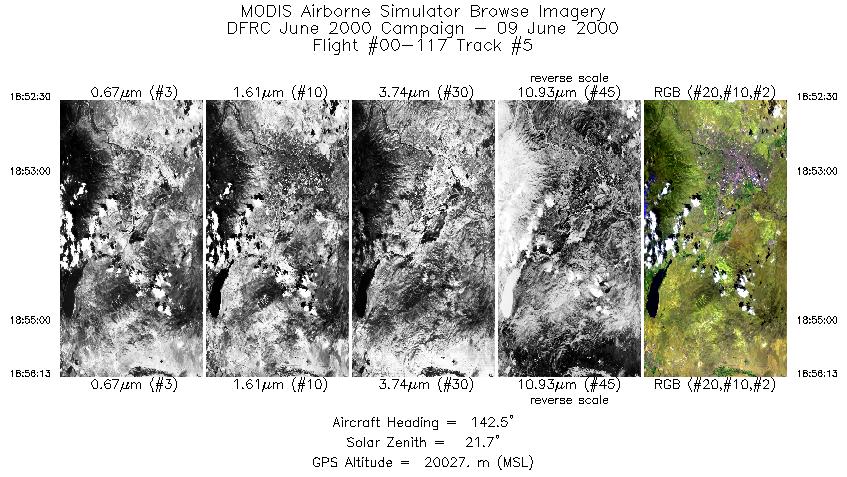
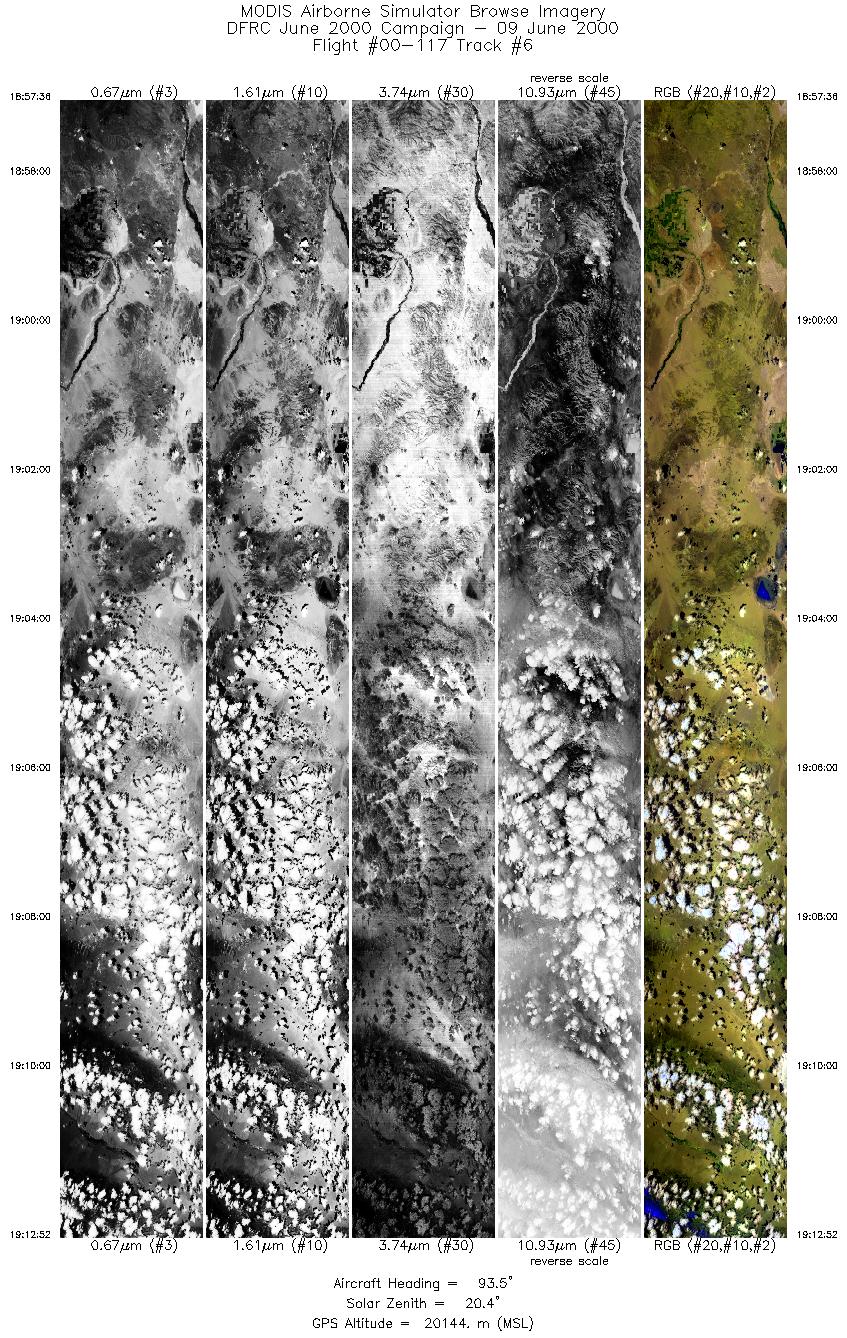
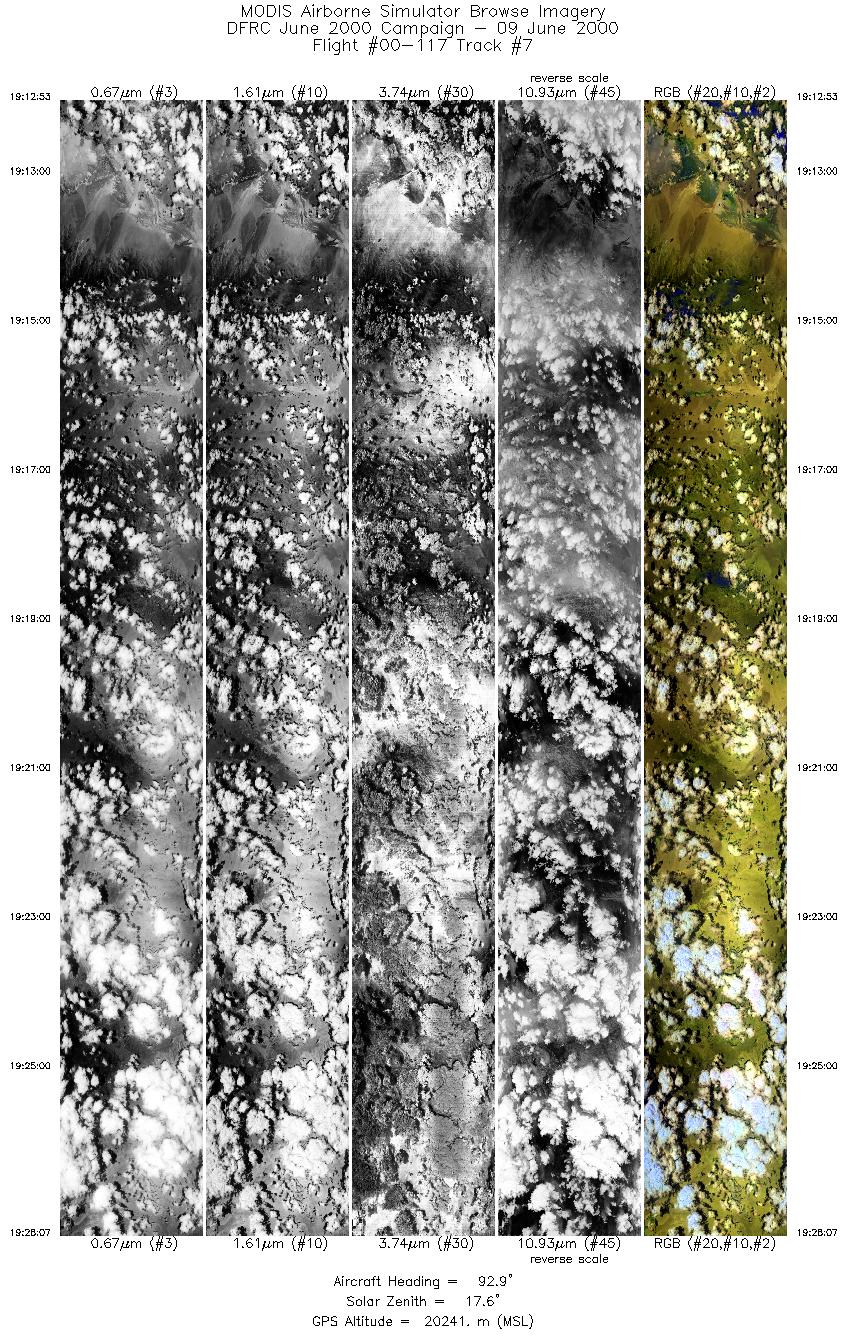
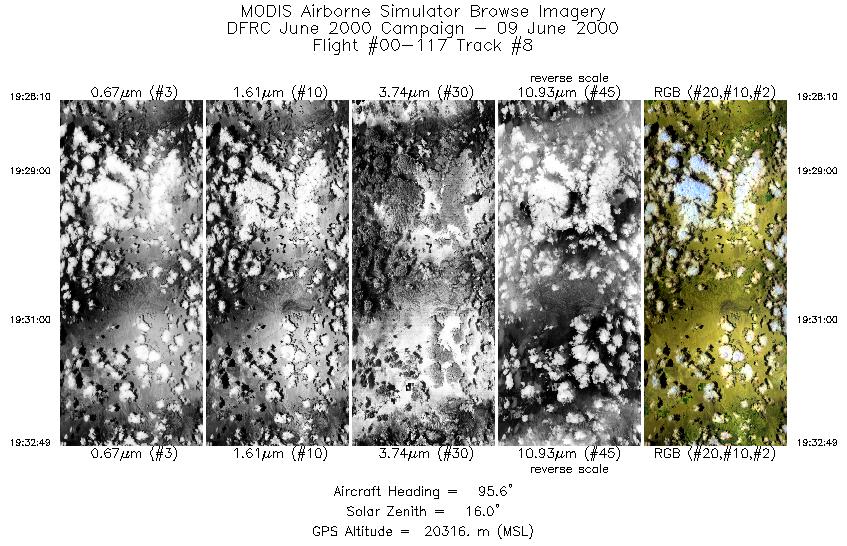
Flight: 00-117 Date: 9 June 2000 Location: Virginia City / Lunar Lake / Railroad Valley / Grapevine Mtns, NV Deployment: DFRC June 2000 Principal Investigator: Kruse (AIG) / Thome (UofAZ) Additional Sensors: AVIRIS, 12" RC-10 (CIR) |
||||||||||||||||||||||||||||||||||||||||||||||||||||||||||||||||||||||||||||||||||||||||||||||||||||||||||||||||||||||||||||||
|
Data Evaluation Overall quality is good |
||||||||||||||||||||||||||||||||||||||||||||||||||||||||||||||||||||||||||||||||||||||||||||||||||||||||||||||||||||||||||||||
|
Processing Information Level-1B Data in HDF format is available Flight Line Summary Spectral Band Configuration Spectral Response Function Table |
||||||||||||||||||||||||||||||||||||||||||||||||||||||||||||||||||||||||||||||||||||||||||||||||||||||||||||||||||||||||||||||
|
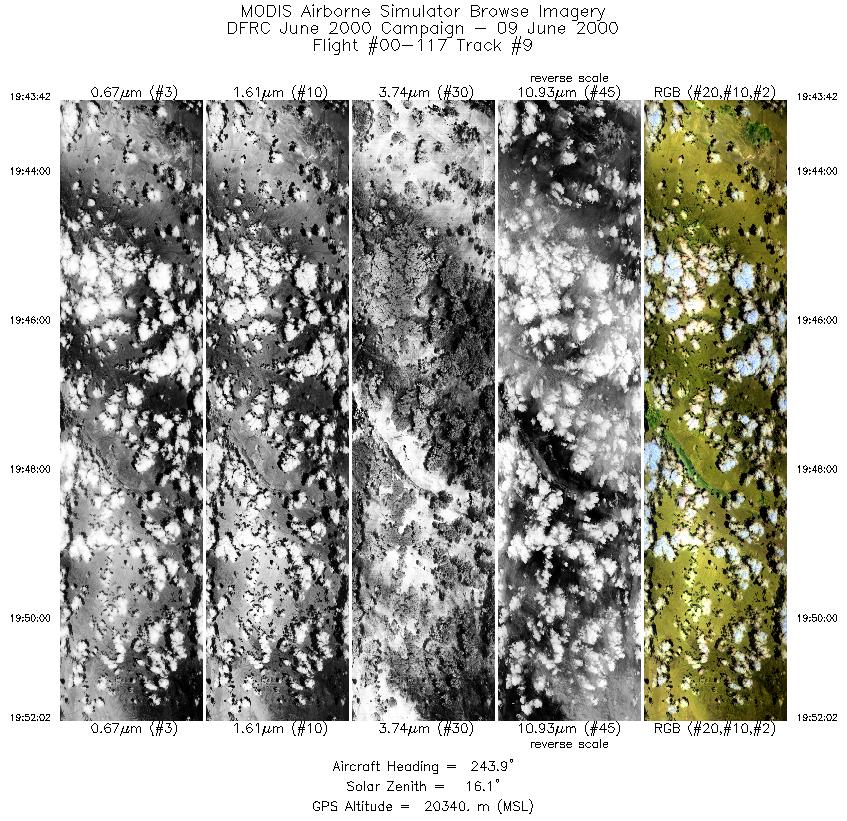
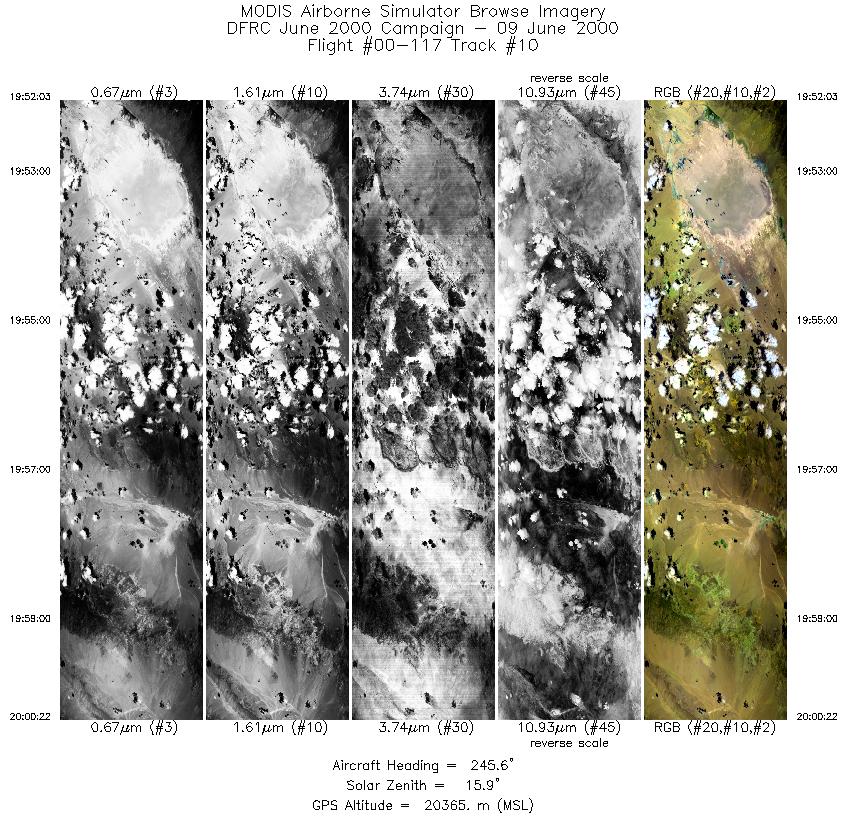
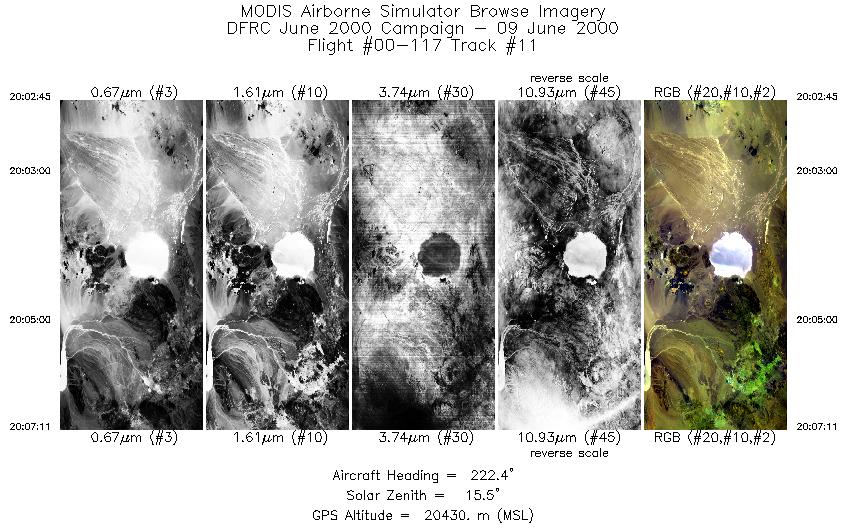
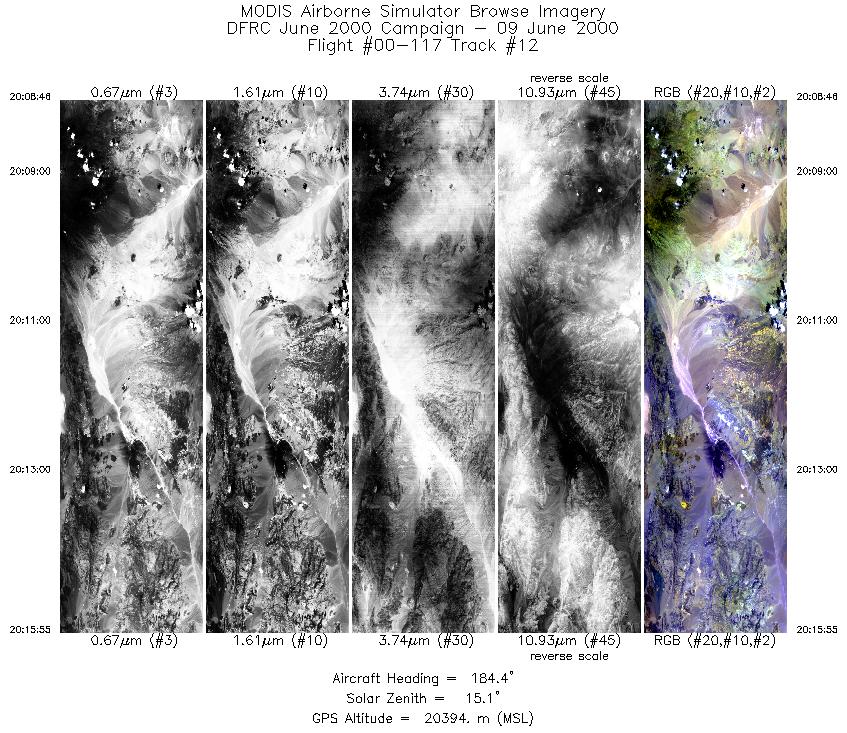
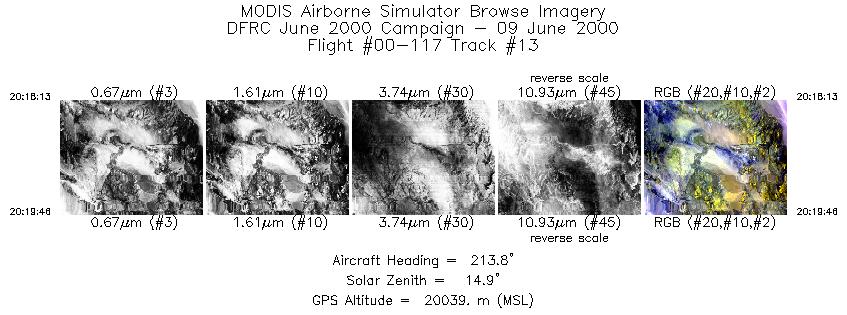
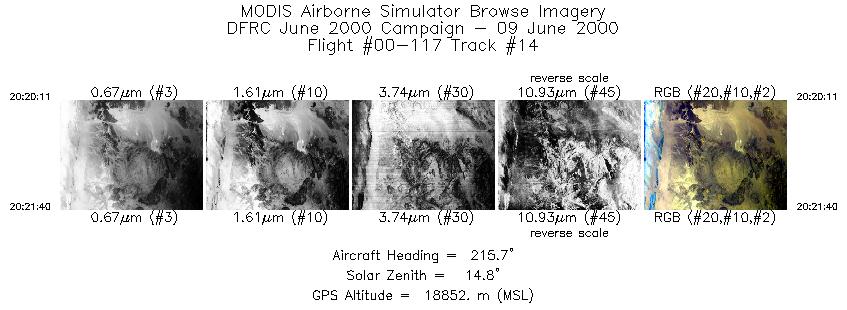
Browse Imagery Flight Tracks: 14 Scanlines: 35224 |
||||||||||||||||||||||||||||||||||||||||||||||||||||||||||||||||||||||||||||||||||||||||||||||||||||||||||||||||||||||||||||||
|
||||||||||||||||||||||||||||||||||||||||||||||||||||||||||||||||||||||||||||||||||||||||||||||||||||||||||||||||||||||||||||||

Flight 00-117


| Sample Imagery |
| Click image for full resolution |
|
Track #11 Mud Lake, NV |


|
|
R: 2.13µm G: 1.62µm B: 0.55µm |
- NASA Official: Matt Fladeland
- Project Manager: James Jacobson
- Website Editor: Eric Fraim
- Last Updated: November 16, 2021


