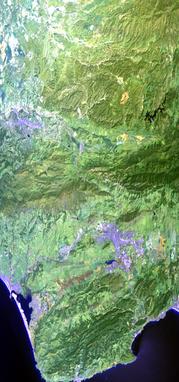
Flight: 00-079
Date: 7 April 2000
Location: California to Hawaii
Deployment: Hawaii 2000
Principal Investigator: Green (JPL) / Feldman (GSFC)
Additional Sensors: AVIRIS, Dual RC-10 (6" NC / 12" CIR)
|
Data Evaluation
Some noise noted in ports 2-4, but overall quality is good.
|
Processing Information
Level-1B Data in HDF format is available
Flight Line Summary
Spectral Band Configuration
Spectral Response Function Table
|
Browse Imagery
Flight Tracks: 23
Scanlines: 131089
|
Browse Imagery Table
|
Click a Flight Track number to view a quicklook image
Lat/Lon ranges are for the BEG-END scanline nadir pixels |
Flight
Track |
Time Span
(GMT) |
Heading
(Deg) |
Lat Range
(Deg North) |
Lon Range
(Deg West) |
Length
(scanlines) |
Altitude
(meters) |
| 01 |
19:38-19:39 |
7 |
36.62-36.81 |
118.48-118.44 |
618 |
~20000 |
| 02 |
19:43-19:53 |
322 |
37.15-38.04 |
118.63-119.37 |
3670 |
~20000 |
| 03 |
19:57-19:59 |
125 |
38.06-37.95 |
118.96-118.74 |
661 |
~20000 |
| 04 |
20:01-20:07 |
205 |
37.78-37.22 |
118.57-118.87 |
2087 |
~20000 |
| 05 |
20:12-20:16 |
88 |
36.78-36.78 |
118.95-118.37 |
1497 |
~20000 |
| 06 |
20:22-20:29 |
263 |
36.69-36.59 |
117.97-118.91 |
2717 |
~20000 |
| 07 |
20:30-20:37 |
231 |
36.51-36.01 |
119.07-119.75 |
2613 |
~20000 |
| 08 |
20:37-20:44 |
231 |
36.01-35.50 |
119.76-120.44 |
2611 |
~20000 |
| 09 |
20:44-20:49 |
230 |
35.49-35.19 |
120.44-120.83 |
1528 |
~20000 |
| 10 |
20:50-21:06 |
241 |
35.12-34.12 |
120.94-122.74 |
6301 |
~20000 |
| 11 |
21:06-21:23 |
238 |
34.11-33.09 |
122.74-124.49 |
6290 |
~20000 |
| 12 |
21:24-21:38 |
252 |
33.06-32.67 |
124.56-126.24 |
5105 |
~20000 |
| 13 |
21:38-21:51 |
254 |
32.67-32.26 |
126.24-127.92 |
5100 |
~20000 |
| 14 |
21:51-22:25 |
253 |
32.26-31.15 |
127.92-131.96 |
12500 |
~20000 |
| 15 |
22:25-22:58 |
251 |
31.15-29.91 |
131.96-135.96 |
12475 |
~20000 |
| 16 |
22:58-23:32 |
249 |
29.91-28.52 |
135.96-139.92 |
12494 |
~20000 |
| 17 |
23:32-00:05 |
248 |
28.52-27.03 |
139.92-143.74 |
12479 |
~20000 |
| 18 |
00:05-00:38 |
246 |
27.03-25.48 |
143.74-147.38 |
12485 |
~20000 |
| 19 |
00:38-01:12 |
244 |
25.48-23.83 |
147.38-150.93 |
12492 |
~20000 |
| 20 |
01:12-01:25 |
243 |
23.83-23.17 |
150.94-152.29 |
4805 |
~20000 |
| 21 |
01:25-01:32 |
244 |
23.16-22.79 |
152.31-153.04 |
2600 |
~20000 |
| 22 |
01:32-01:43 |
252 |
22.77-22.41 |
153.09-154.32 |
3984 |
~20000 |
| 23 |
01:43-01:54 |
252 |
22.41-22.04 |
154.32-155.54 |
3977 |
~20000 |
|


