


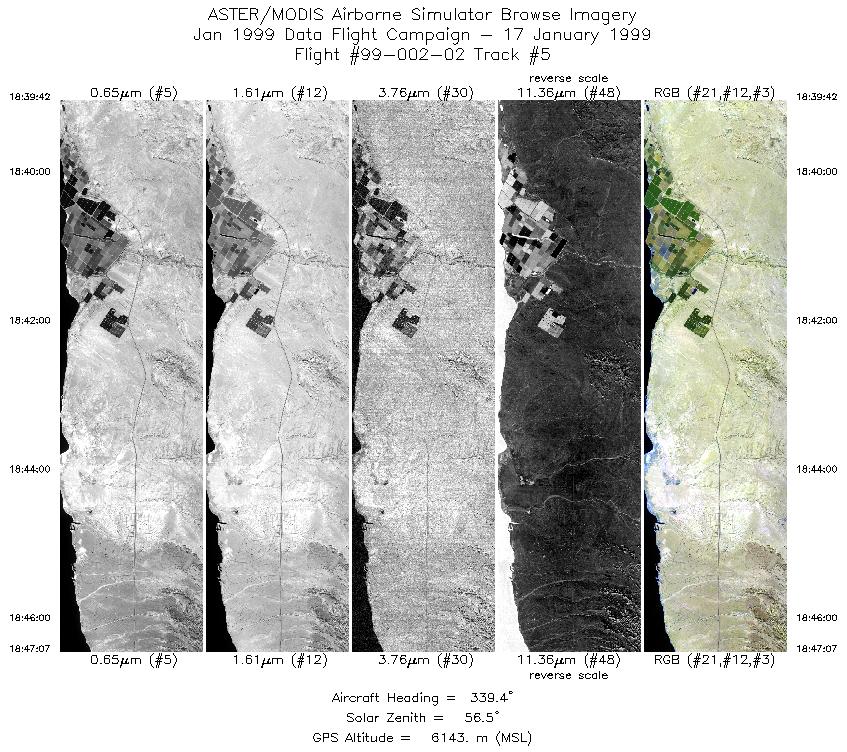
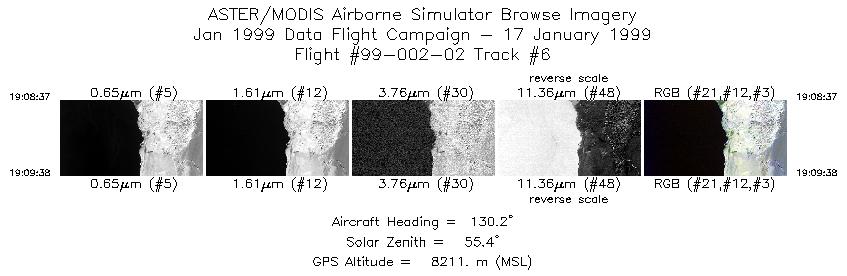
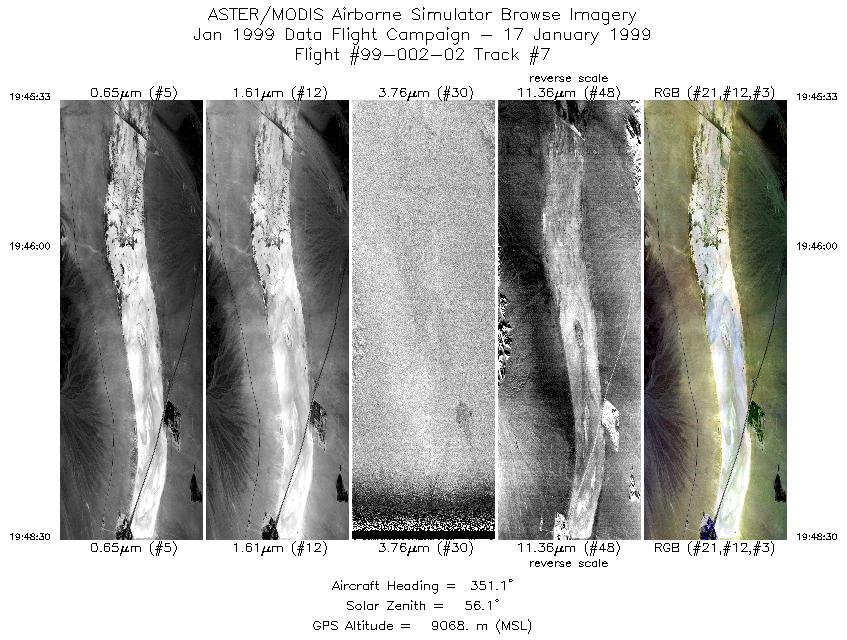
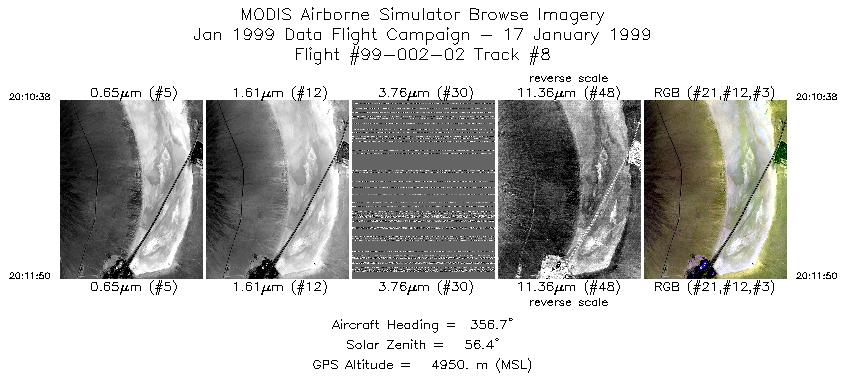
FLIGHT SUMMARY INFORMATION
Flight Track Map


|
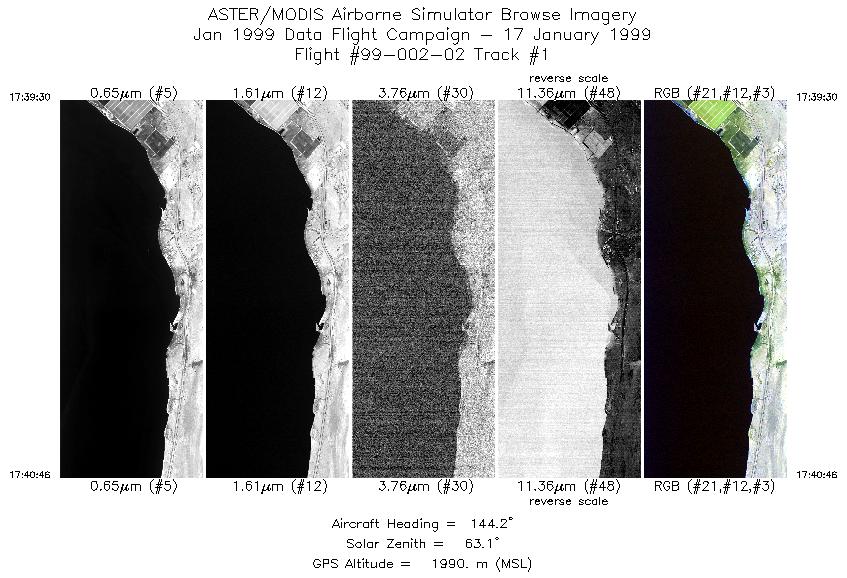
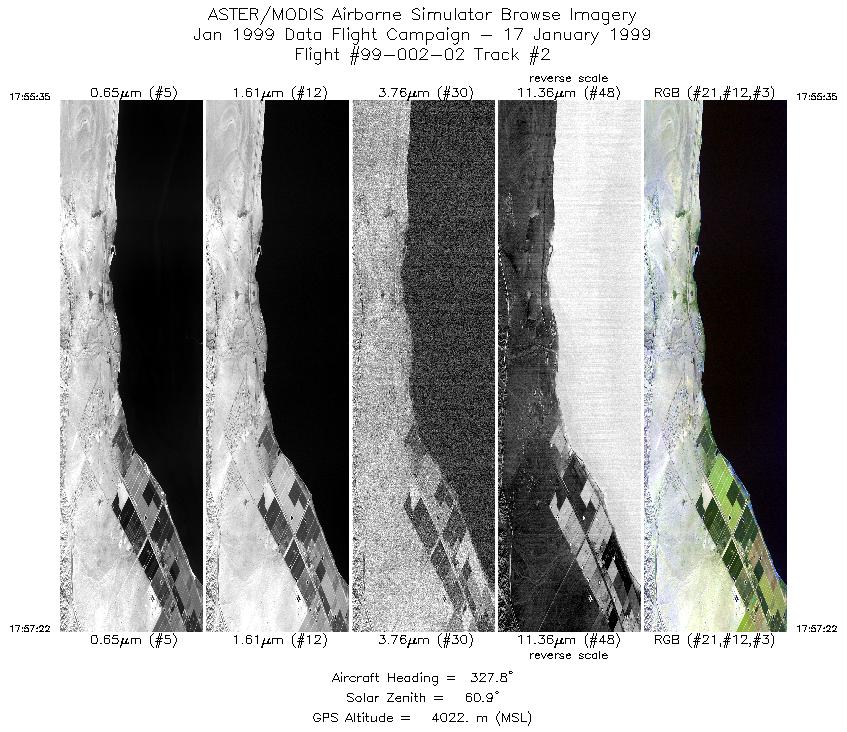
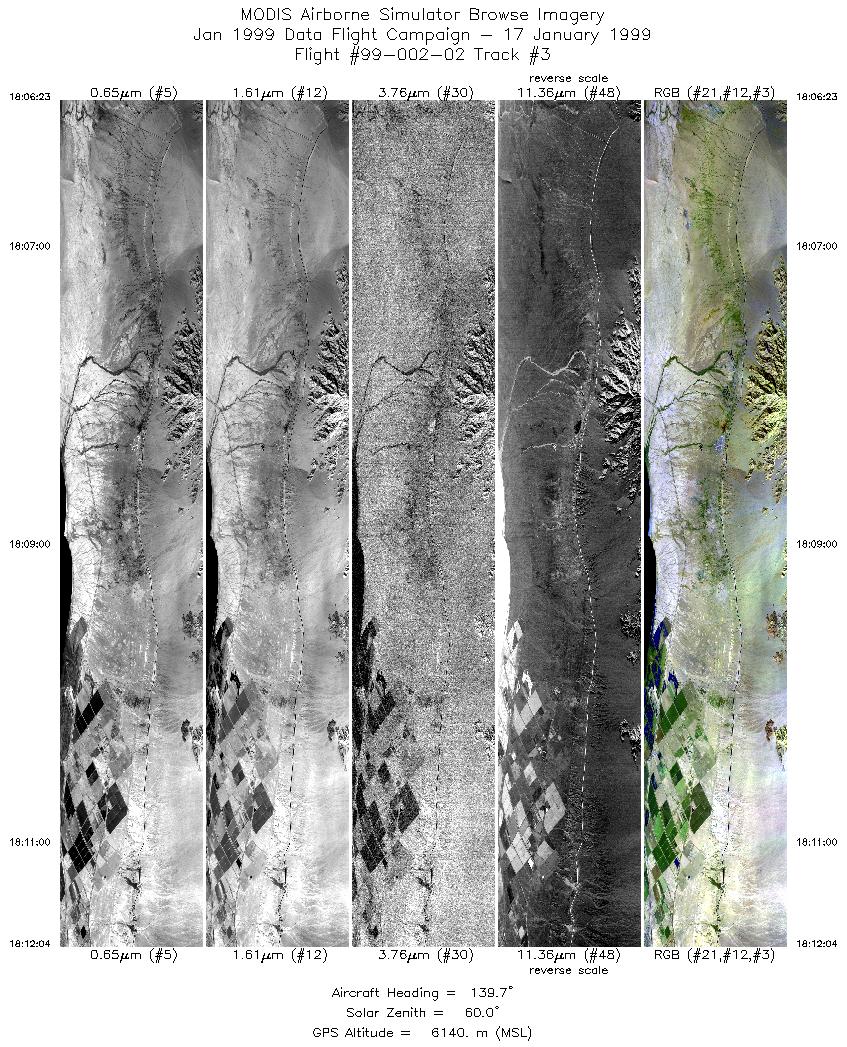
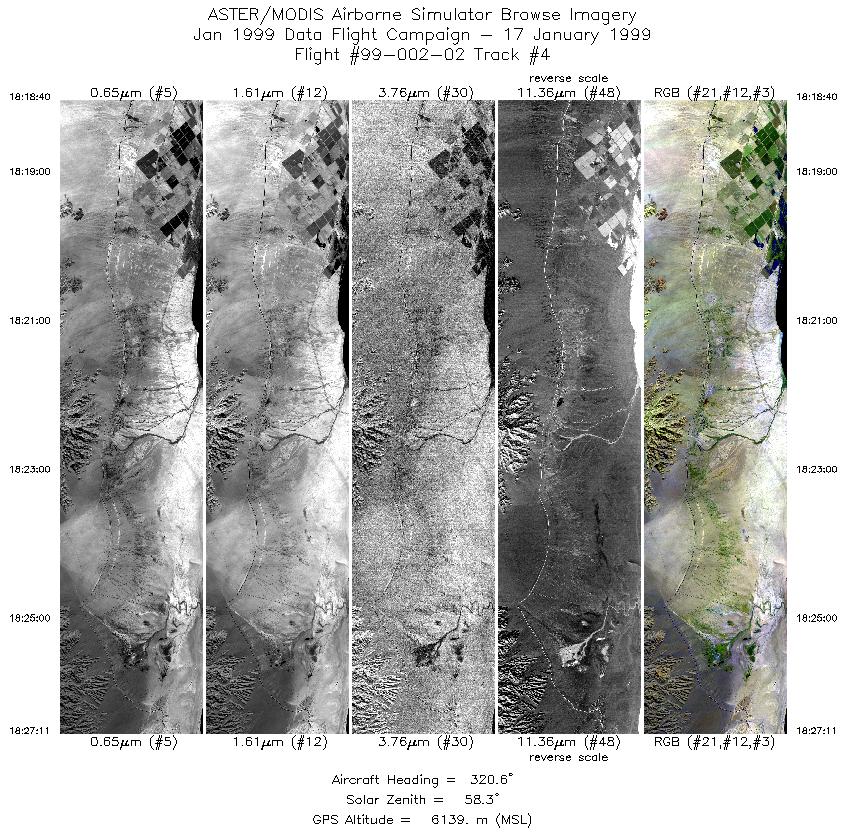
Flight: 99-002-02 Date: January 17, 1999 Aircraft: DOE B-200 Kingair Deployment: RSL Jan 1999 Flight Location: Salton Sea / Ivanpah, CA Principal Investigator: Palluconi / Hook (JPL) Additional Sensors: |
||||||||||||||||||||||||||||||||||||||||||||||||||||||||||||||||||||||||||||||||||||
|
Data Evaluation Liquid Nitrogen loss towards the end of flight affected data Port 3 (channels 26-14) and ch44. |
||||||||||||||||||||||||||||||||||||||||||||||||||||||||||||||||||||||||||||||||||||
|
Processing Information Level-1B Data in HDF format is available Flight Line Summary Spectral Band Configuration Spectral Response Function Table Spectral Response Function (text) |
||||||||||||||||||||||||||||||||||||||||||||||||||||||||||||||||||||||||||||||||||||
|
Browse Imagery Flight Tracks: 8 Scanlines: 18203 |
||||||||||||||||||||||||||||||||||||||||||||||||||||||||||||||||||||||||||||||||||||
|
||||||||||||||||||||||||||||||||||||||||||||||||||||||||||||||||||||||||||||||||||||


