


FLIGHT SUMMARY INFORMATION
Flight Track Map


|
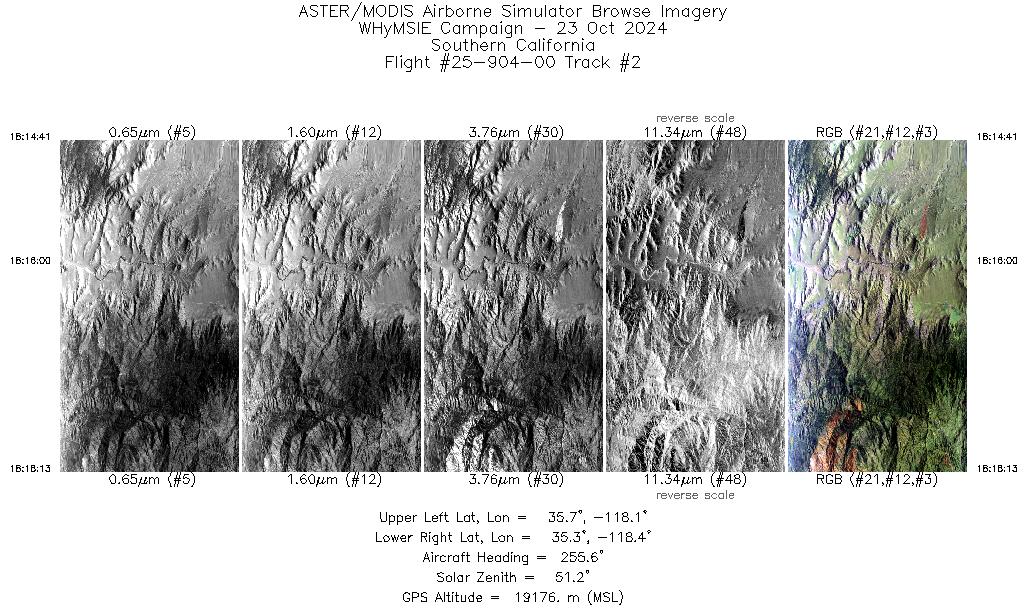
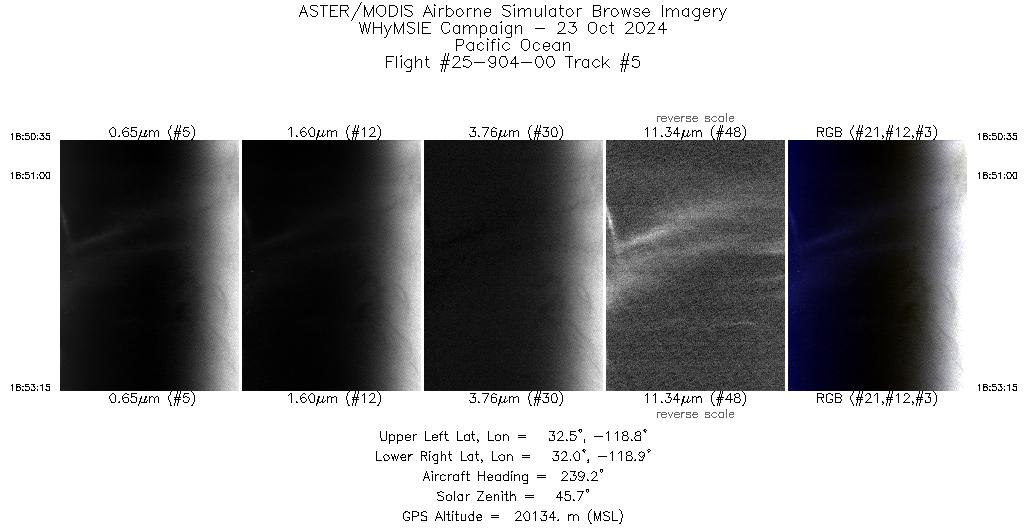
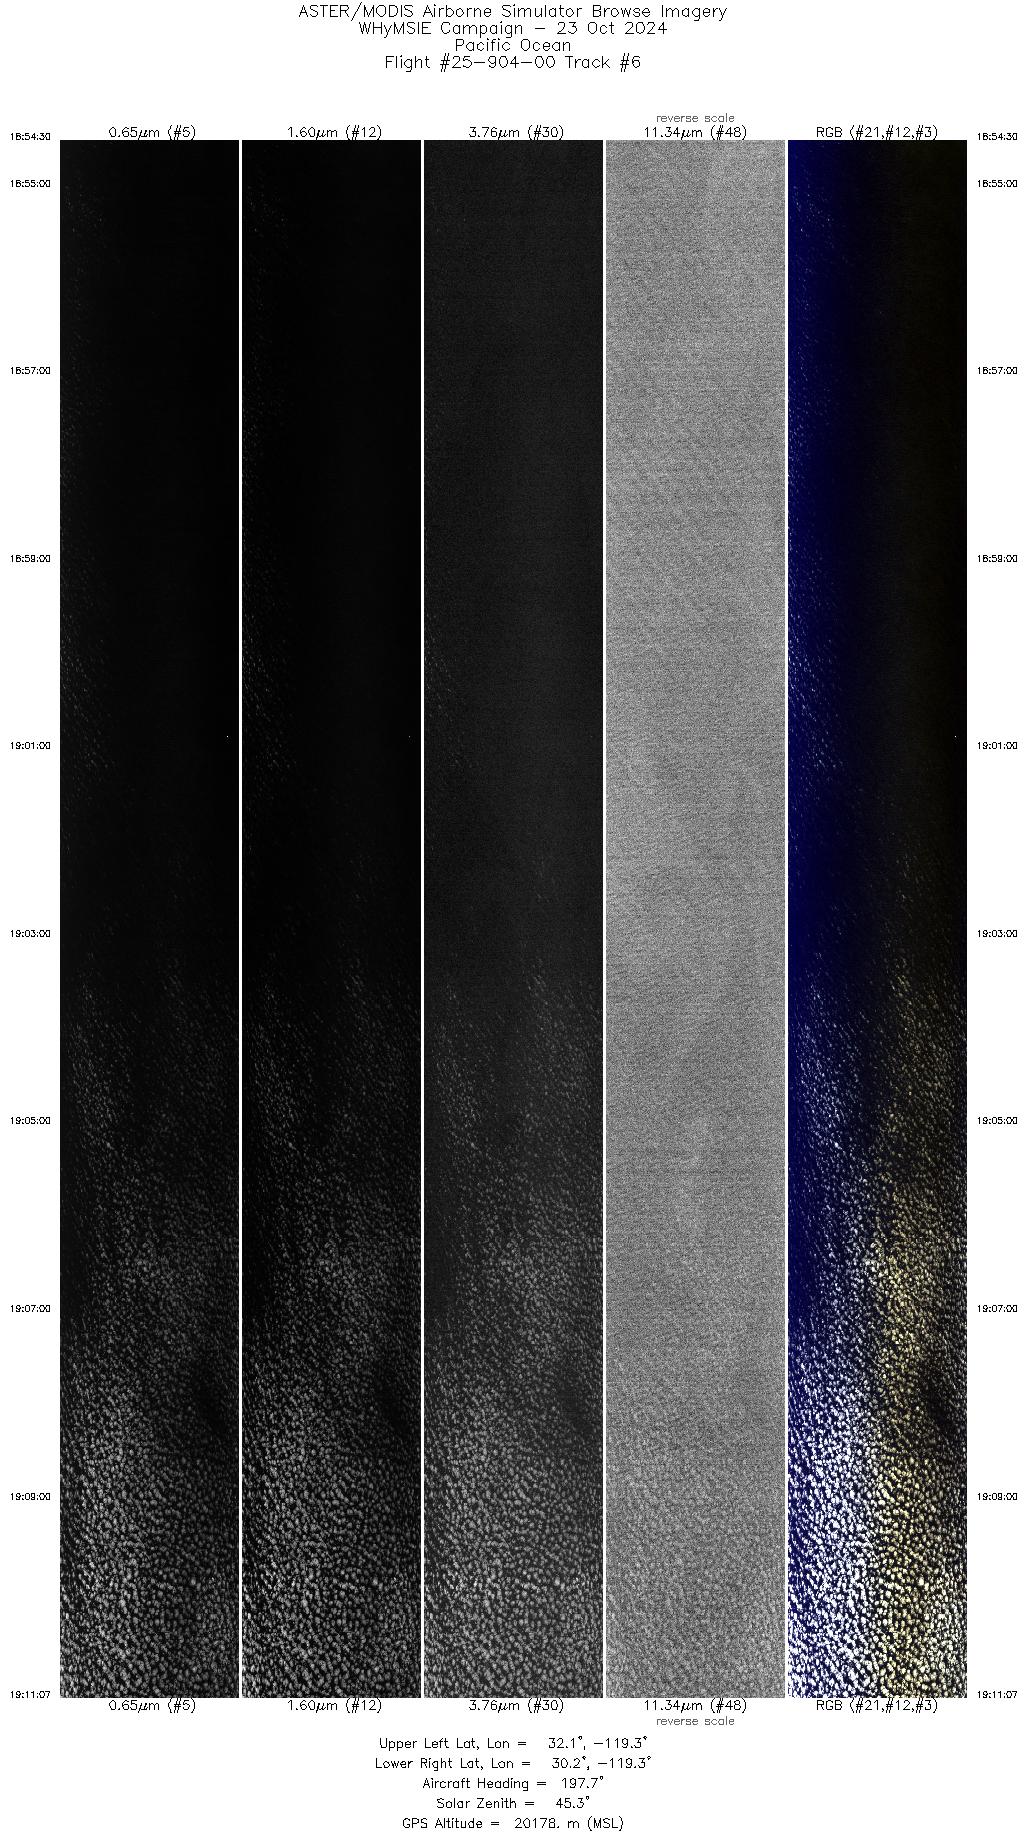
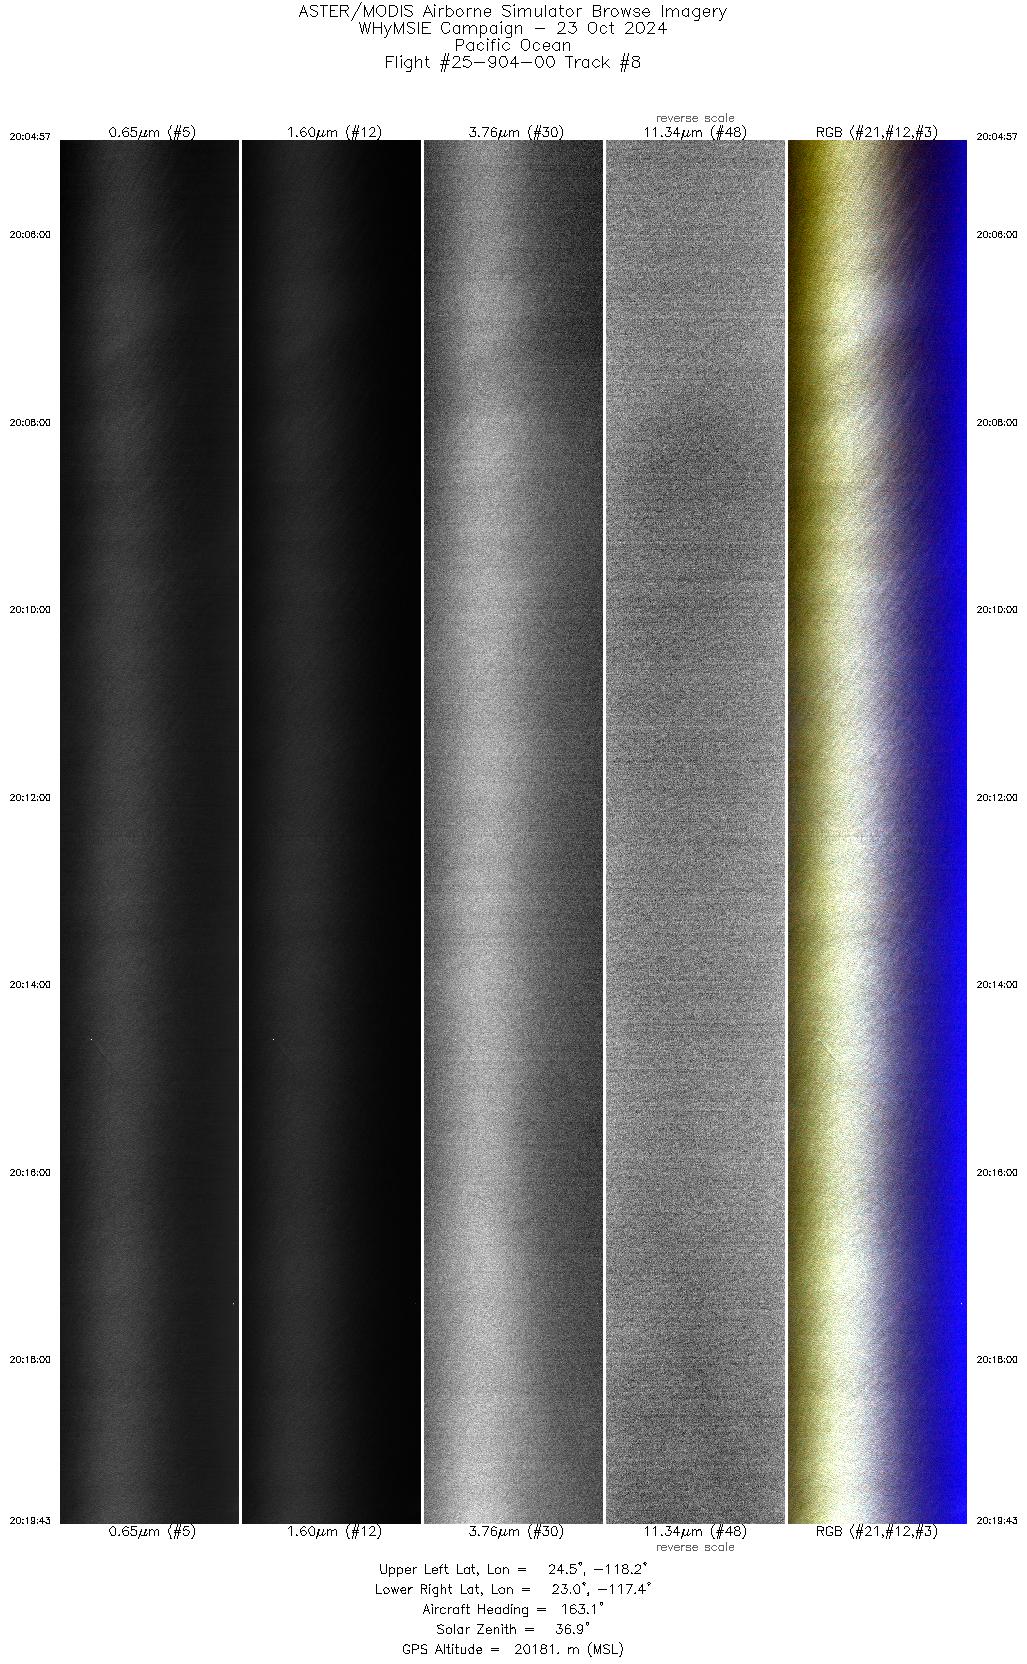
Flight: 25-904-00 Date: 23 Oct 2024 Aircraft: NASA ER-2 #809 Deployment: WH2yMSIE Flight Location: Pacific Ocean / NOAA-20 Principal Investigators: NASA / NOAA Additional Sensors: CoSMIR-H / MBARS / CRS / CPL / S-HIS / NAST-I / AMPR / ARO |
||||||||||||||||||||||||||||||||||||||||||||||||||||||||||||||||||||||||||||||||||||||||||||||||||||||||||||||||
|
Data Evaluation Overall quality is good NOAA-20 Underpass @ 21:03Z |
||||||||||||||||||||||||||||||||||||||||||||||||||||||||||||||||||||||||||||||||||||||||||||||||||||||||||||||||
|
Processing Information Level-1B Data in HDF format is available Flight Line Summary Spectral Band Configuration Spectral Response Function Table Spectral Response Function (text) |
||||||||||||||||||||||||||||||||||||||||||||||||||||||||||||||||||||||||||||||||||||||||||||||||||||||||||||||||
|
Browse Imagery Flight Tracks: 12 Scanlines: 80003 |
||||||||||||||||||||||||||||||||||||||||||||||||||||||||||||||||||||||||||||||||||||||||||||||||||||||||||||||||
|
||||||||||||||||||||||||||||||||||||||||||||||||||||||||||||||||||||||||||||||||||||||||||||||||||||||||||||||||

Flight 25-904-00


| Sample Imagery |
| Click image for full resolution |
|
Track: #12 Catalina / San Clemente Islands |


|
|
R: 2.13µm G: 1.61µm B: 0.47µm |


