


FLIGHT SUMMARY INFORMATION
Flight Track Map


|
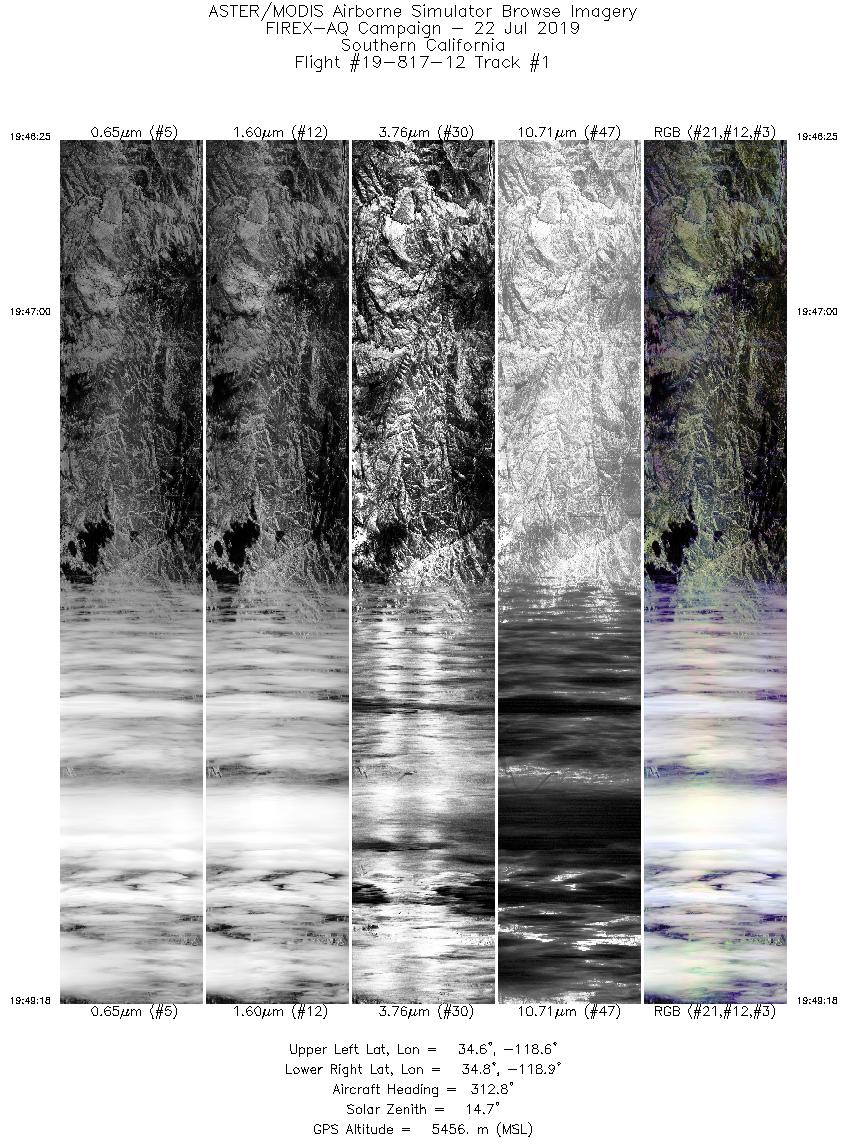
Flight: 19-817-12 Date: July 22, 2019 Aircraft: NASA DC-8, #817 Deployment: FIREX-AQ Flight Location: California / Ferry to Idaho Principal Investigator: Crawford (NASA), Warneke (CIRES), Schwarz (NOAA) Additional Sensors: DC-8 Payload |
|||||||||||||||||||||||||||||||||||||||||||||||||||||||||||||||||||||||||||||
|
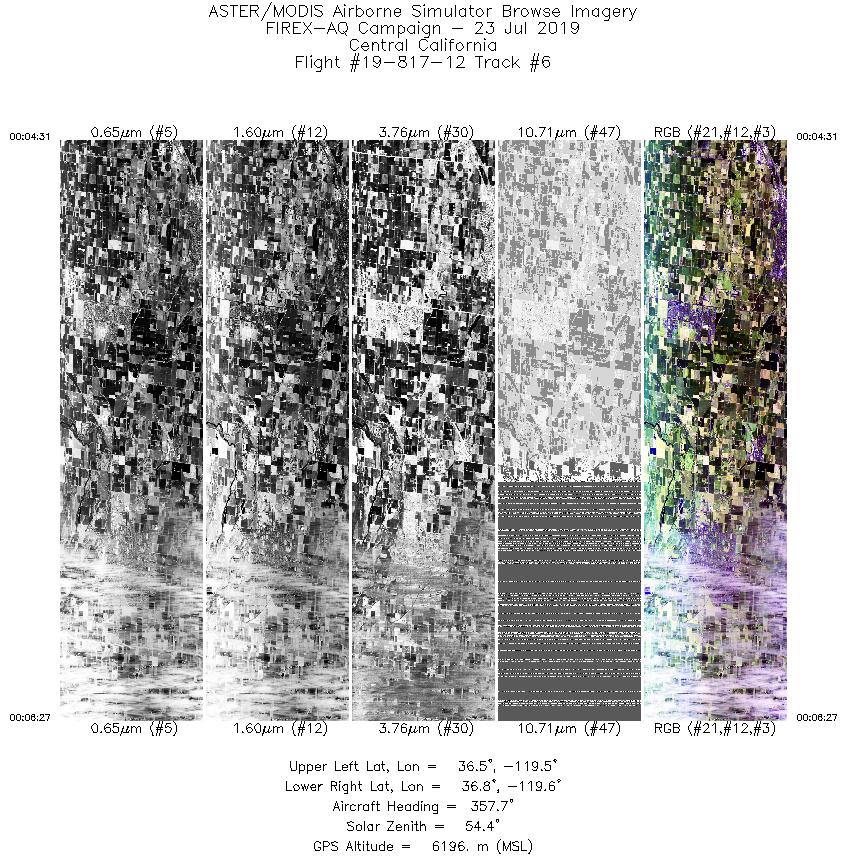
Data Evaluation Overall data quality is good. All data collected @25Hz. Significant VIS/SWIR reponse degradation during campaign. Port 4 IR channels effected by loss of LN2 towards end of flight, effecting flight line 6. |
|||||||||||||||||||||||||||||||||||||||||||||||||||||||||||||||||||||||||||||
|
Processing Information Level-1B Data in HDF format is available Flight Line Summary Spectral Band Configuration Spectral Response Function Table Spectral Response Function (text) |
|||||||||||||||||||||||||||||||||||||||||||||||||||||||||||||||||||||||||||||
|
Browse Imagery Flight Tracks: 7 Scanlines: 58785 |
|||||||||||||||||||||||||||||||||||||||||||||||||||||||||||||||||||||||||||||
|
|||||||||||||||||||||||||||||||||||||||||||||||||||||||||||||||||||||||||||||

Flight 19-817-12


| Sample Imagery |
| Click image for full resolution |
|
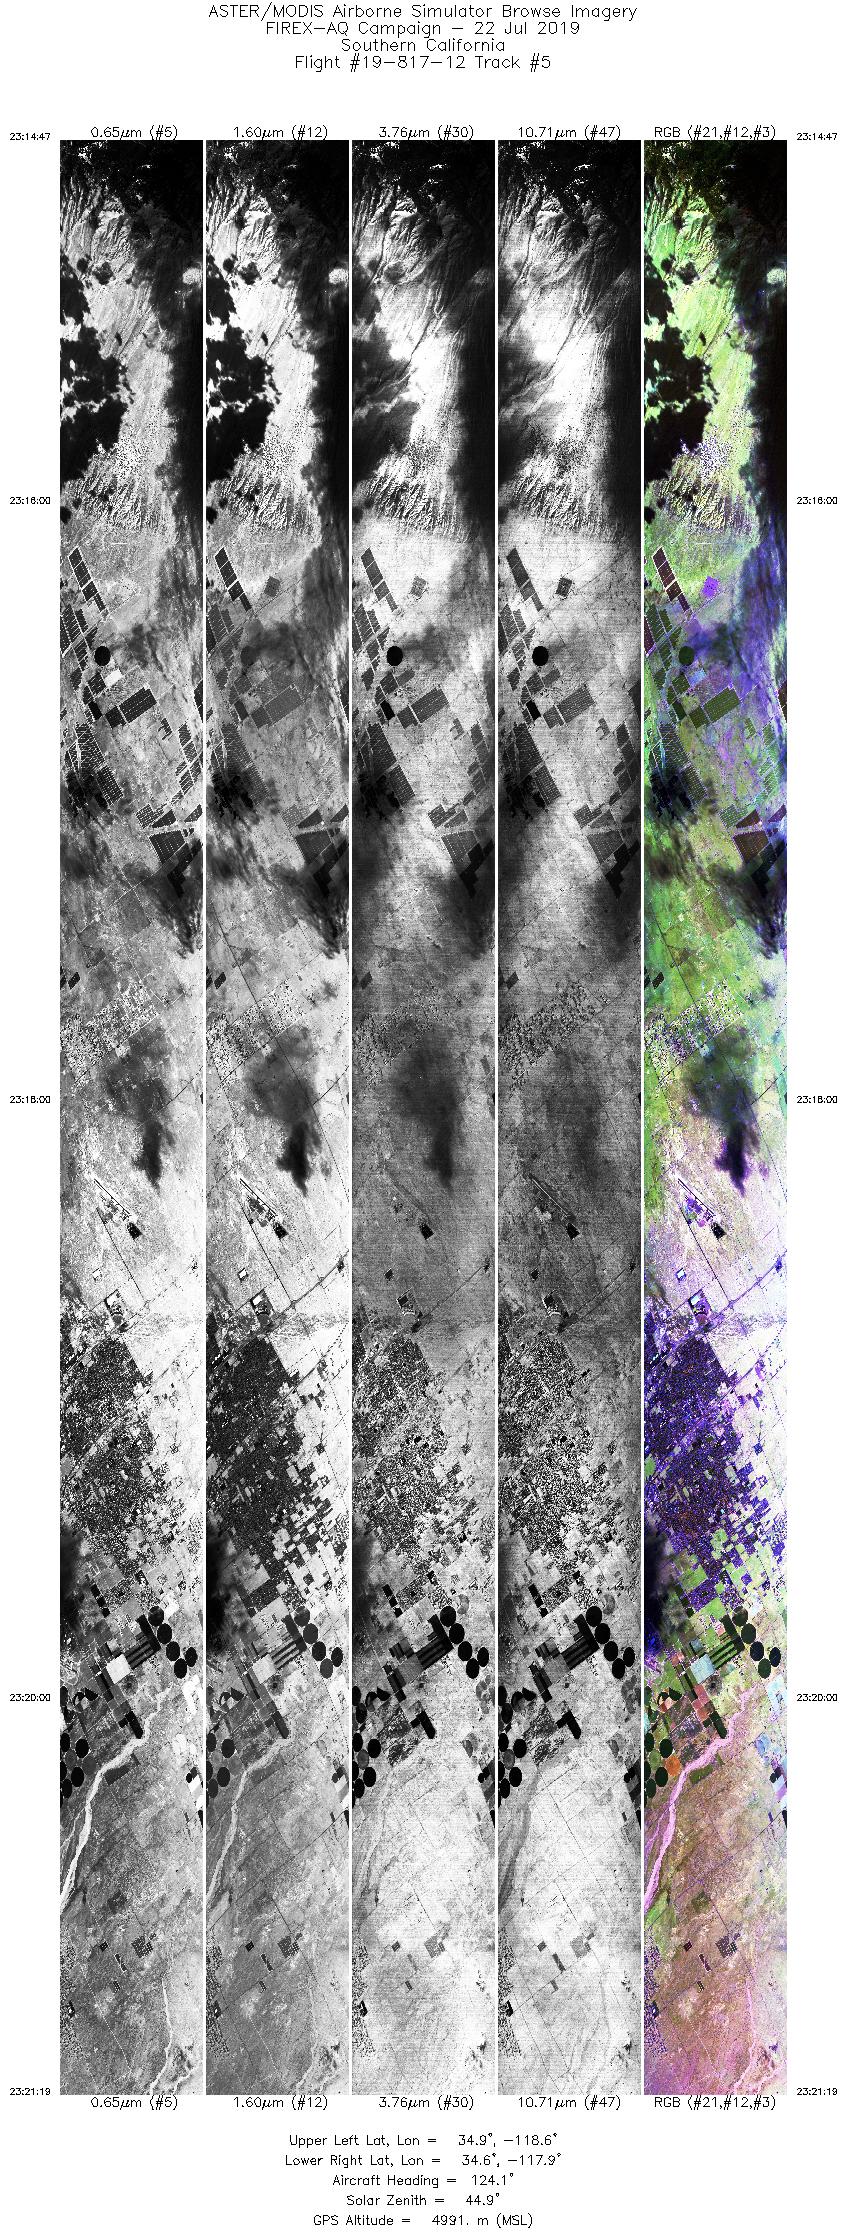
Track #5 Palmdale, CA |


|
|
R: 0.75µm G: 0.66µm B: 0.54µm |


