Flight: 18-632-00
Date: February 9, 2018
Aircraft: NASA ER-2, #806
Deployment: HyspIRI HyTES Hawaii (H3C)
Flight Location: Big Island Hawaii
Principal Investigator: Simon Hook / Rob Green (JPL)
Additional Sensors: HyTES / AVIRIS / PRISM
|
Data Evaluation
New Digitizer and Blackbody Controller
Overall data quality is good; digital noise in MWIR channels
|
Processing Information
Level-1B Data in HDF format is available
Flight Line Summary
Spectral Band Configuration
Spectral Response Function Table
Spectral Response Function (text)
|
Browse Imagery
Flight Tracks: 13
Scanlines: 42504
|
Browse Imagery Table
|
Click a Flight Track number to view a quicklook image
Lat/Lon ranges are for the BEG-END scanline nadir pixels
|
Flight
Track |
Time Span
(UTC) |
Heading
(Deg) |
Lat Range
(Deg N) |
Lon Range
(Deg W) |
Length
(Scanlines) |
Altitude
(Meters) |
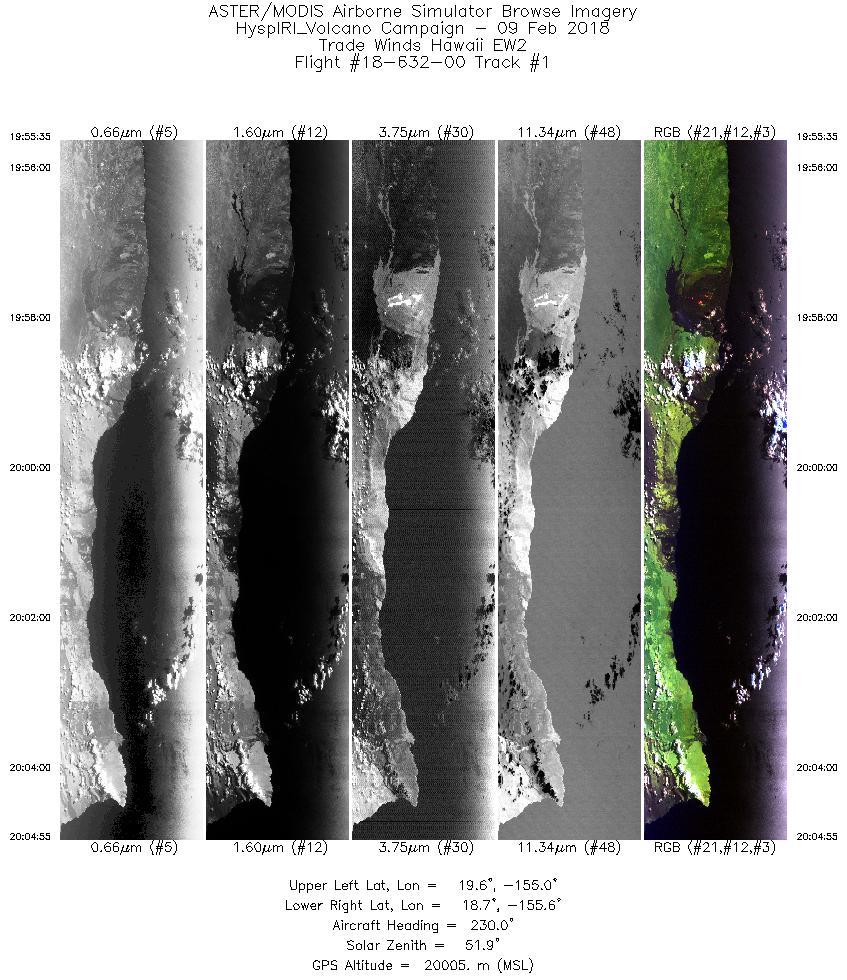
| 1 |
19:55 - 20:04 |
231.2 |
19.483 - 18.871 |
154.845 - 155.712 |
3502 |
20031 |
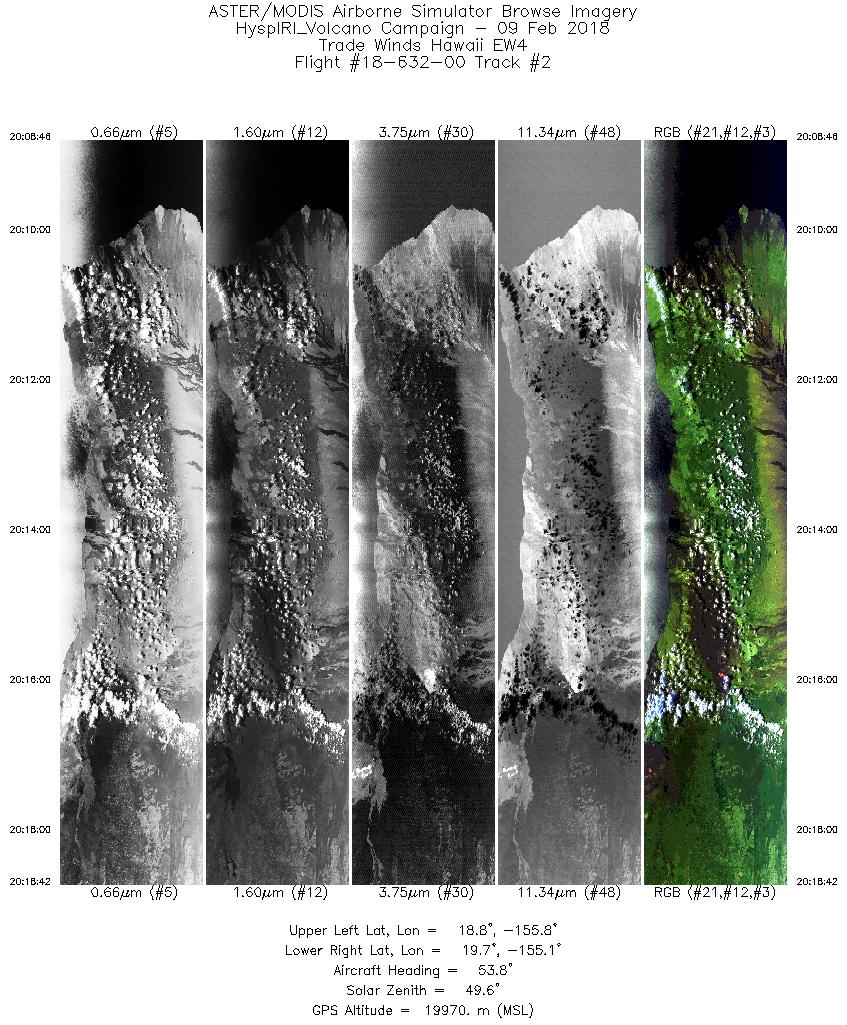
| 2 |
20:08 - 20:18 |
54.0 |
18.936 - 19.580 |
155.923 - 155.010 |
3728 |
19945 |
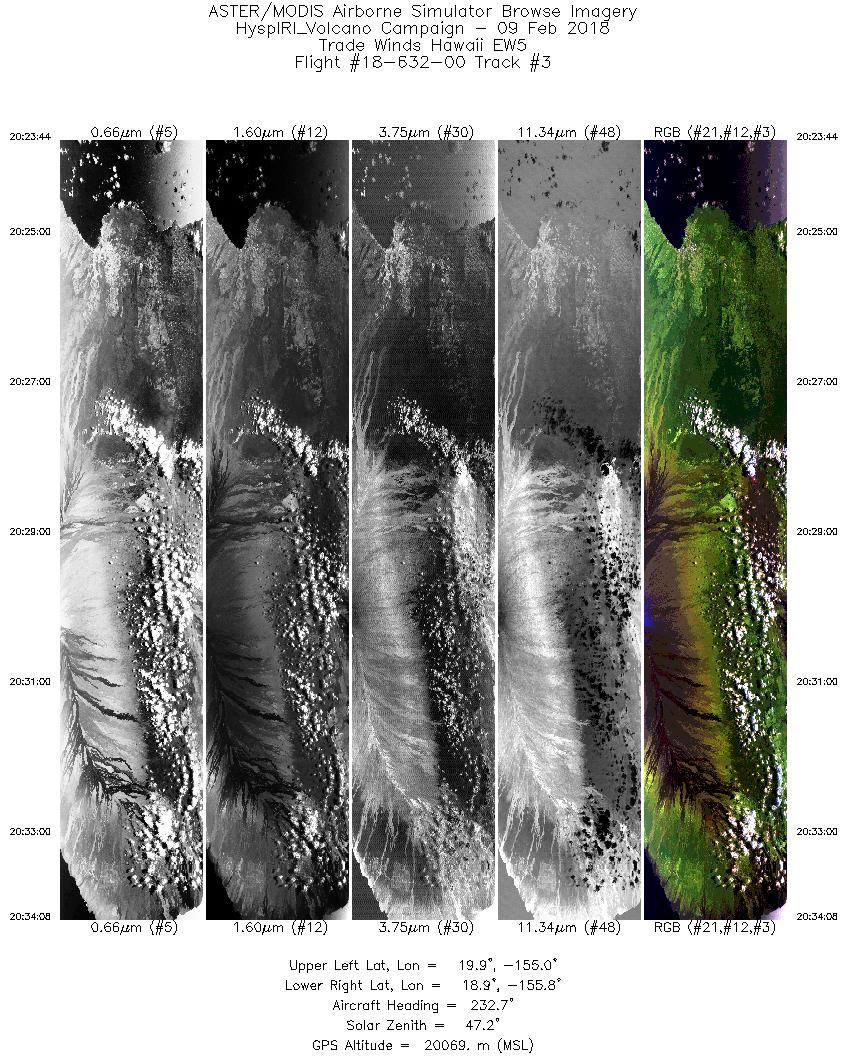
| 3 |
20:23 - 20:34 |
232.5 |
19.767 - 19.080 |
154.902 - 155.872 |
3901 |
20016 |
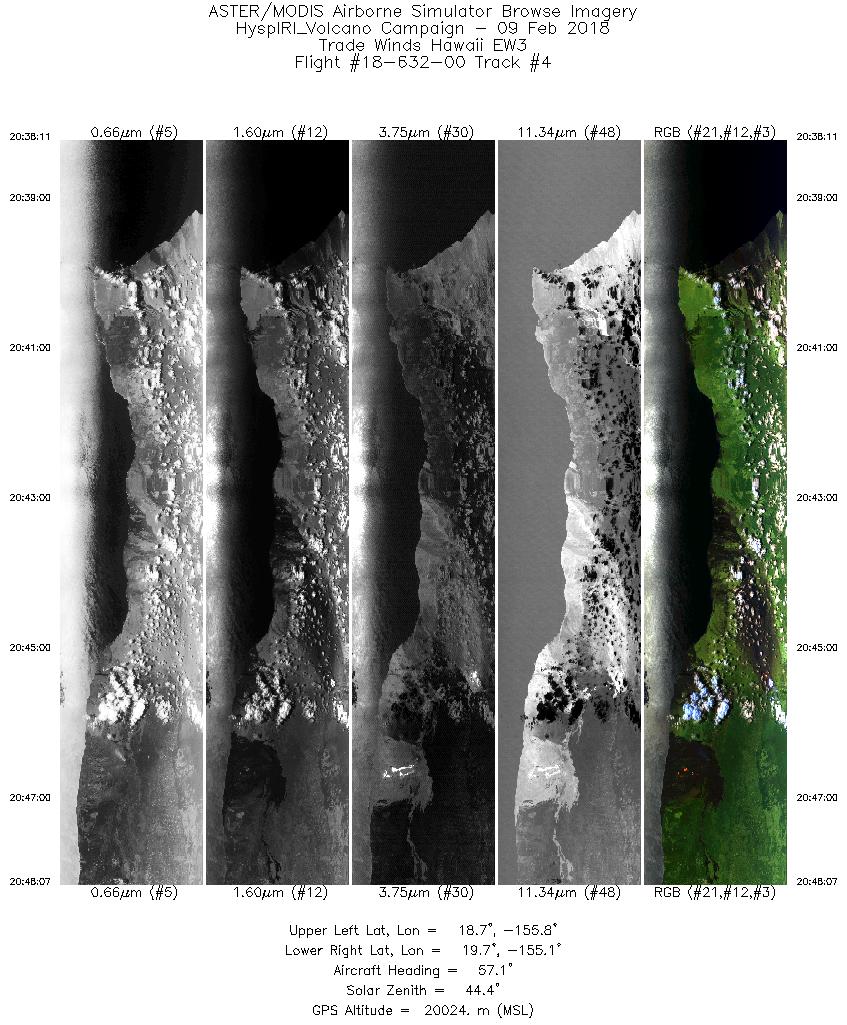
| 4 |
20:38 - 20:48 |
56.0 |
18.860 - 19.509 |
155.883 - 154.957 |
3727 |
20004 |
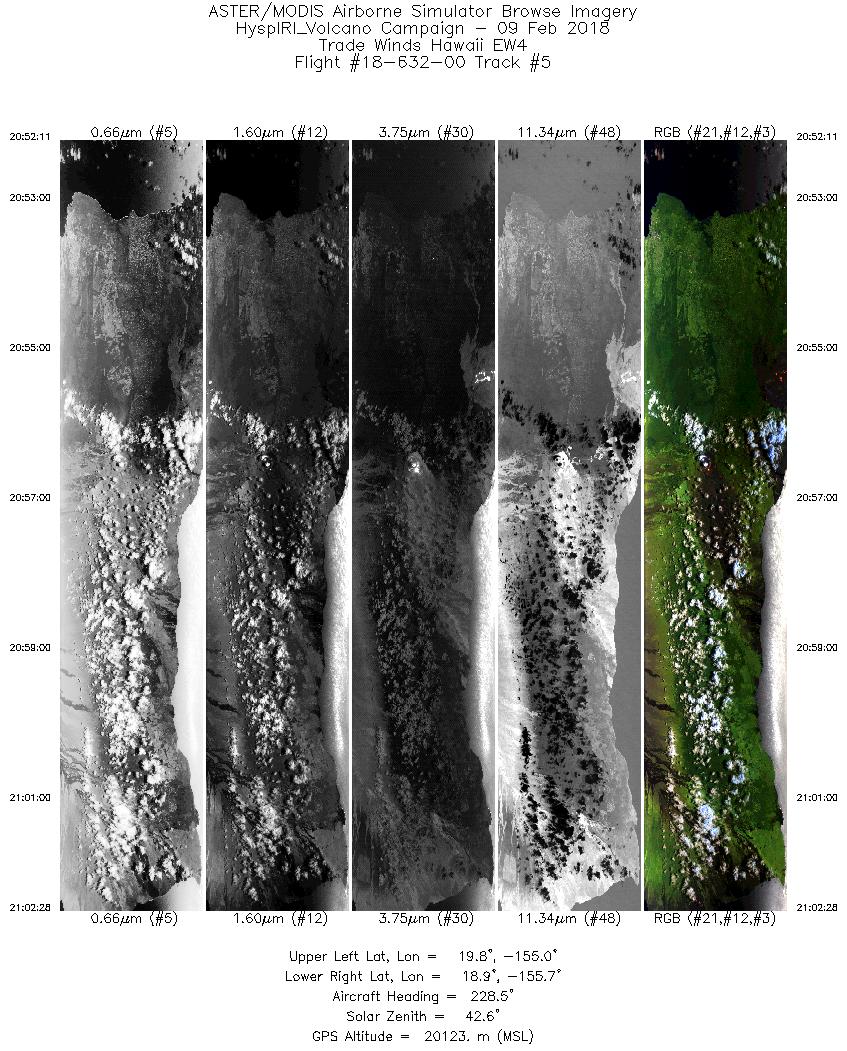
| 5 |
20:52 - 21:02 |
230.6 |
19.688 - 19.012 |
154.860 - 155.817 |
3856 |
20079 |
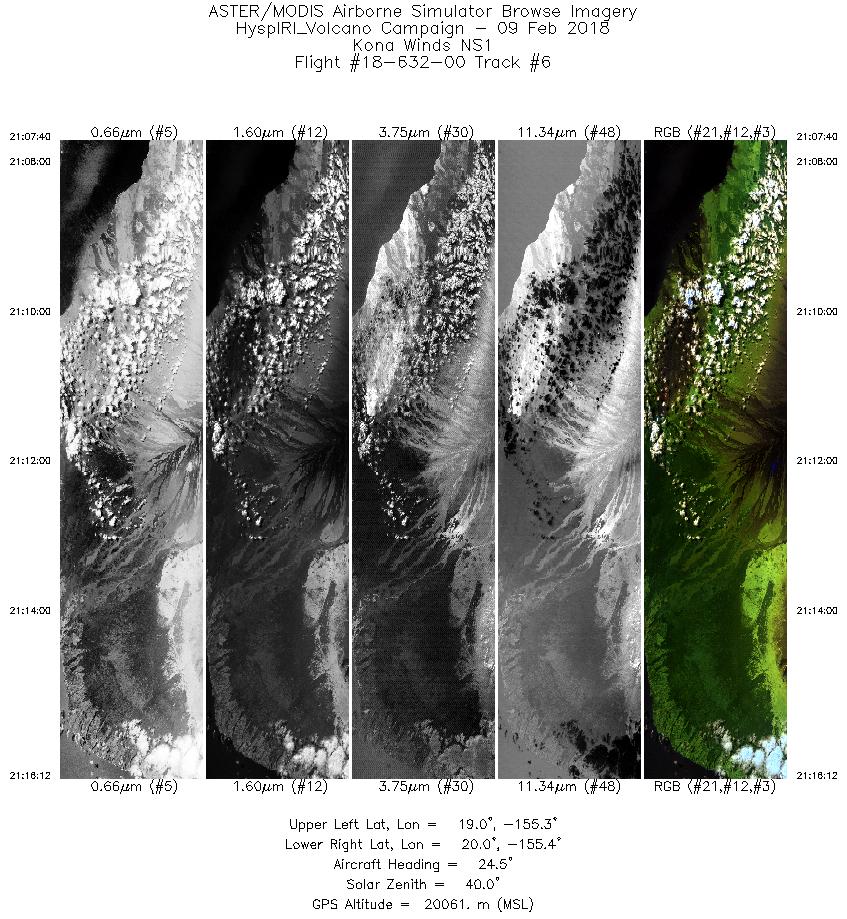
| 6 |
21:07 - 21:16 |
22.4 |
19.079 - 19.970 |
155.506 - 155.192 |
3197 |
20058 |
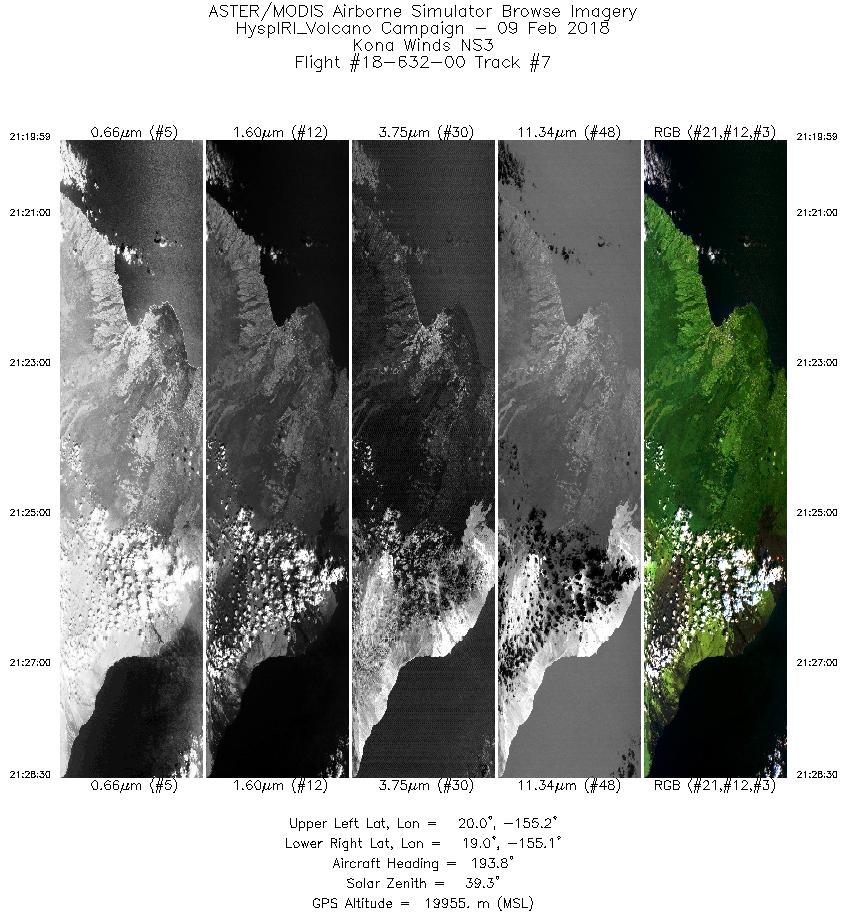
| 7 |
21:19 - 21:28 |
195.6 |
19.982 - 19.094 |
155.001 - 155.308 |
3194 |
19950 |
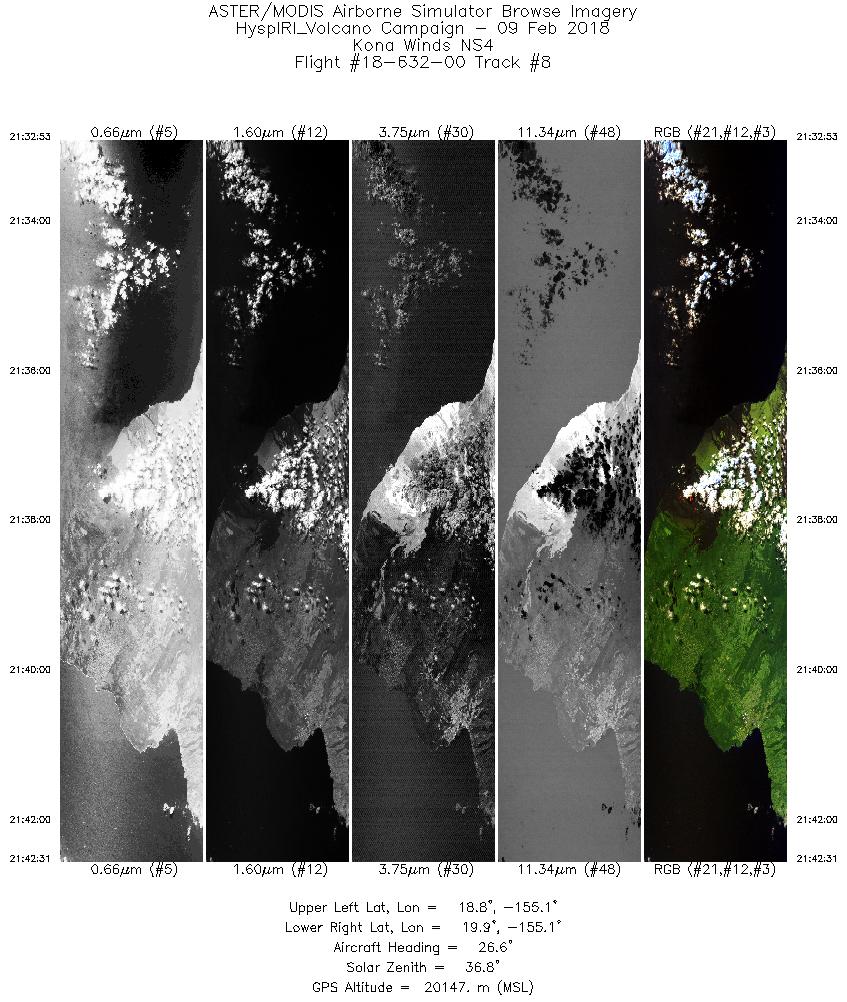
| 8 |
21:32 - 21:42 |
23.5 |
18.877 - 19.885 |
155.299 - 154.932 |
3613 |
20092 |
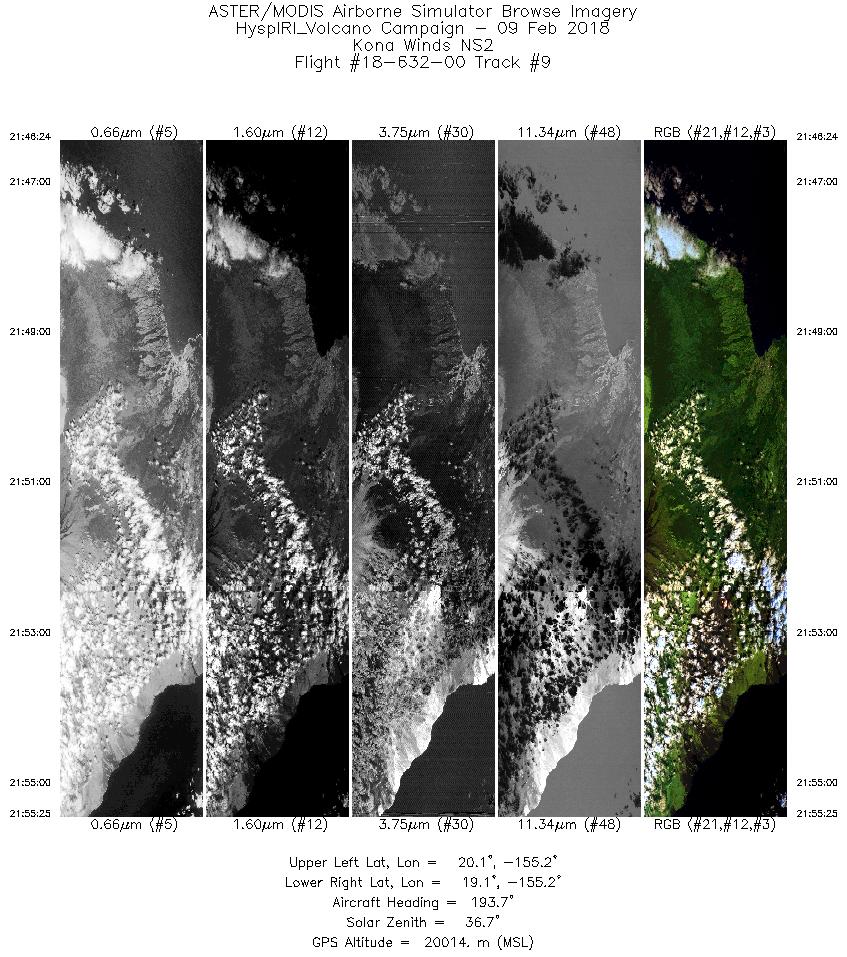
| 9 |
21:46 - 21:55 |
195.5 |
20.053 - 19.110 |
155.075 - 155.398 |
3386 |
20013 |
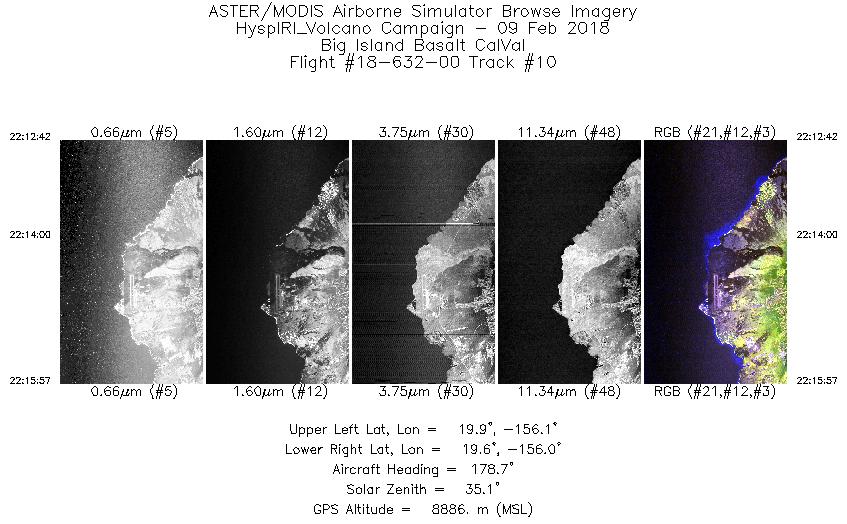
| 10 |
22:12 - 22:15 |
185.0 |
19.878 - 19.664 |
156.038 - 156.051 |
1220 |
8893 |
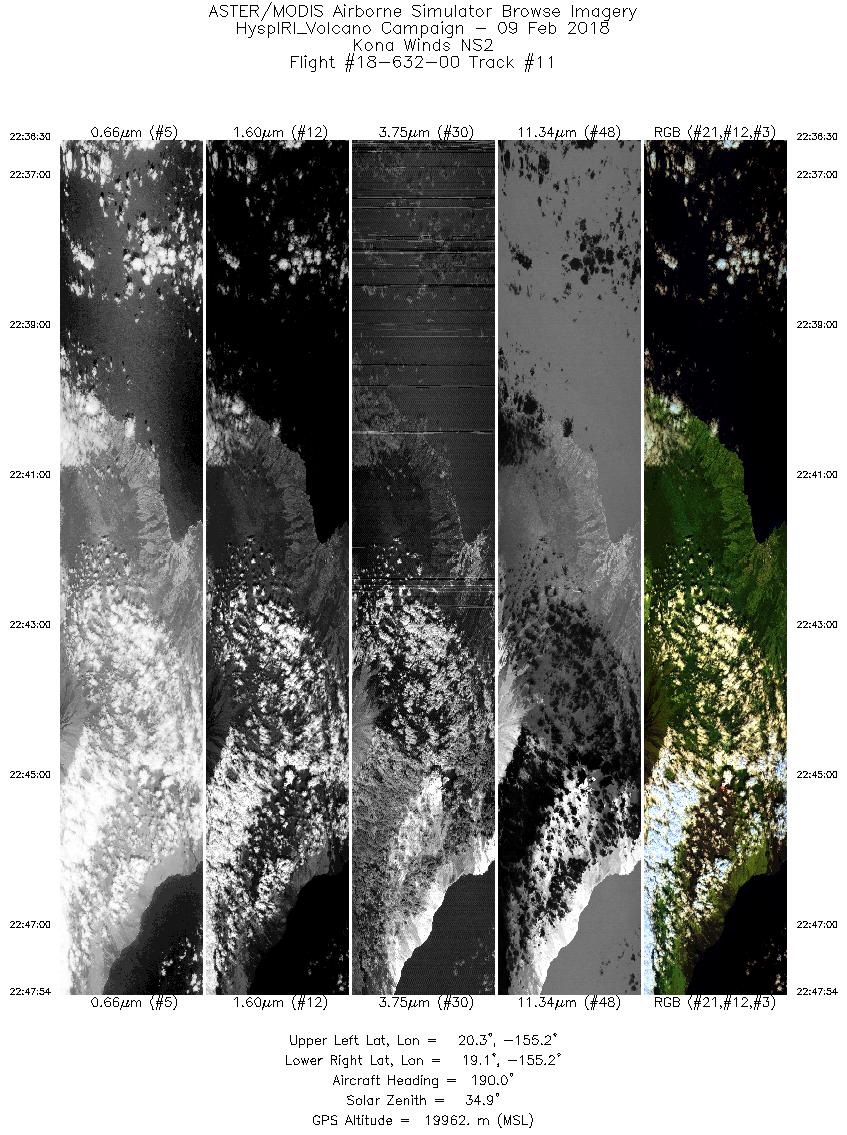
| 11 |
22:36 - 22:47 |
194.0 |
20.277 - 19.126 |
155.004 - 155.395 |
4278 |
19810 |
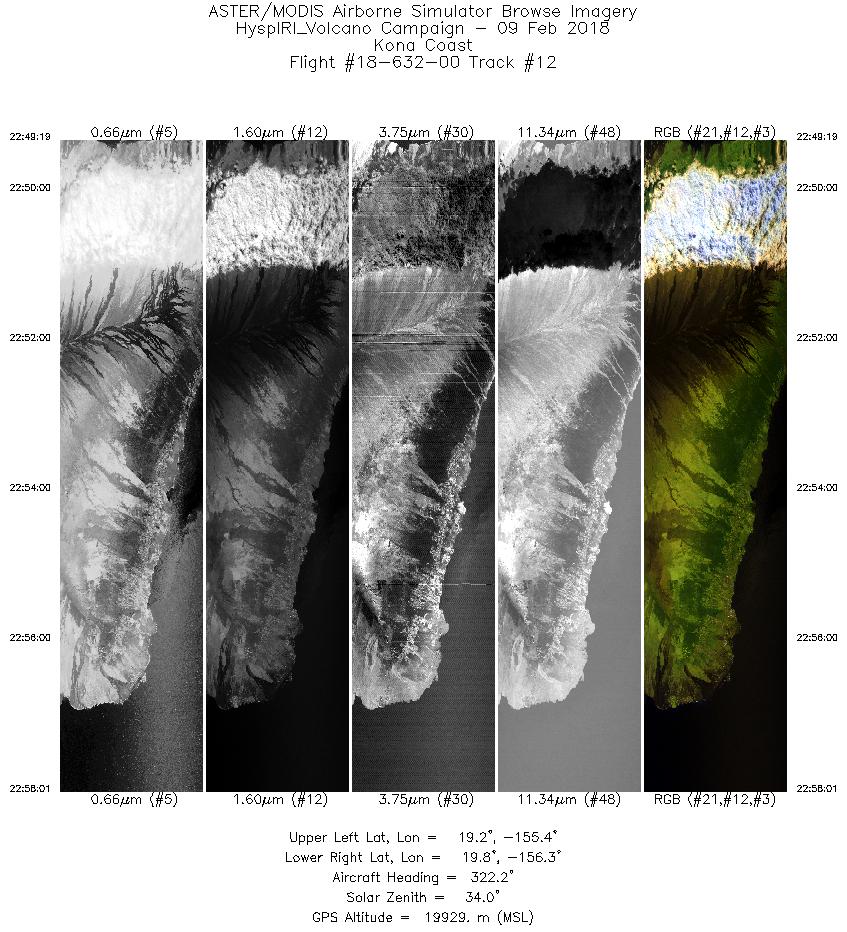
| 12 |
22:49 - 22:58 |
323.3 |
19.100 - 19.882 |
155.525 - 156.147 |
3264 |
19958 |
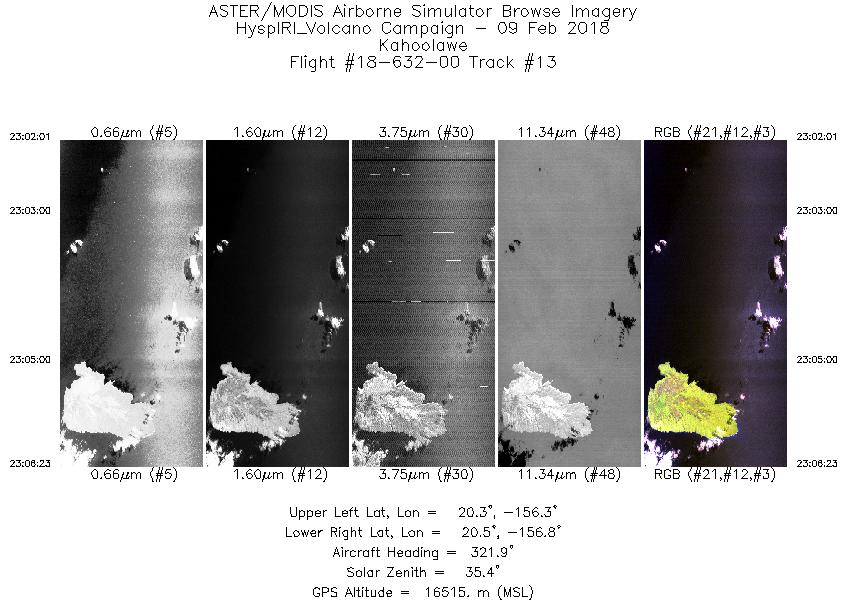
| 13 |
23:02 - 23:06 |
322.1 |
20.237 - 20.586 |
156.434 - 156.708 |
1638 |
16501 |
|


