Flight: 15-929-00
Date: March 28, 2015
Aircraft: NASA ER-2, #809
Flight Number: 15-929-00
Deployment: SNPP Greenland 2015
Flight Location: Greenland Summit / Satellite Underpass
Principal Investigator: Chris Moeller (UWisc)
Additional Sensors: NAST-I / NAST-M / SHIS
|
Data Evaluation
Overall data quality is good.
All data collected @6.25Hz
|
Processing Information
Level-1B Data in HDF format is available
Flight Line Summary
Spectral Band Configuration
Spectral Response Function Table
Spectral Response Function (text)
|
Browse Imagery
Flight Tracks: 13
Scanlines: 122544
|
Browse Imagery Table
|
Click a Flight Track number to view a quicklook image
Lat/Lon ranges are for the BEG-END scanline nadir pixels
|
Flight
Track |
Time Span
(UTC) |
Heading
(Deg) |
Lat Range
(Deg N) |
Lon Range
(Deg W) |
Length
(Scanlines) |
Altitude
(Meters) |
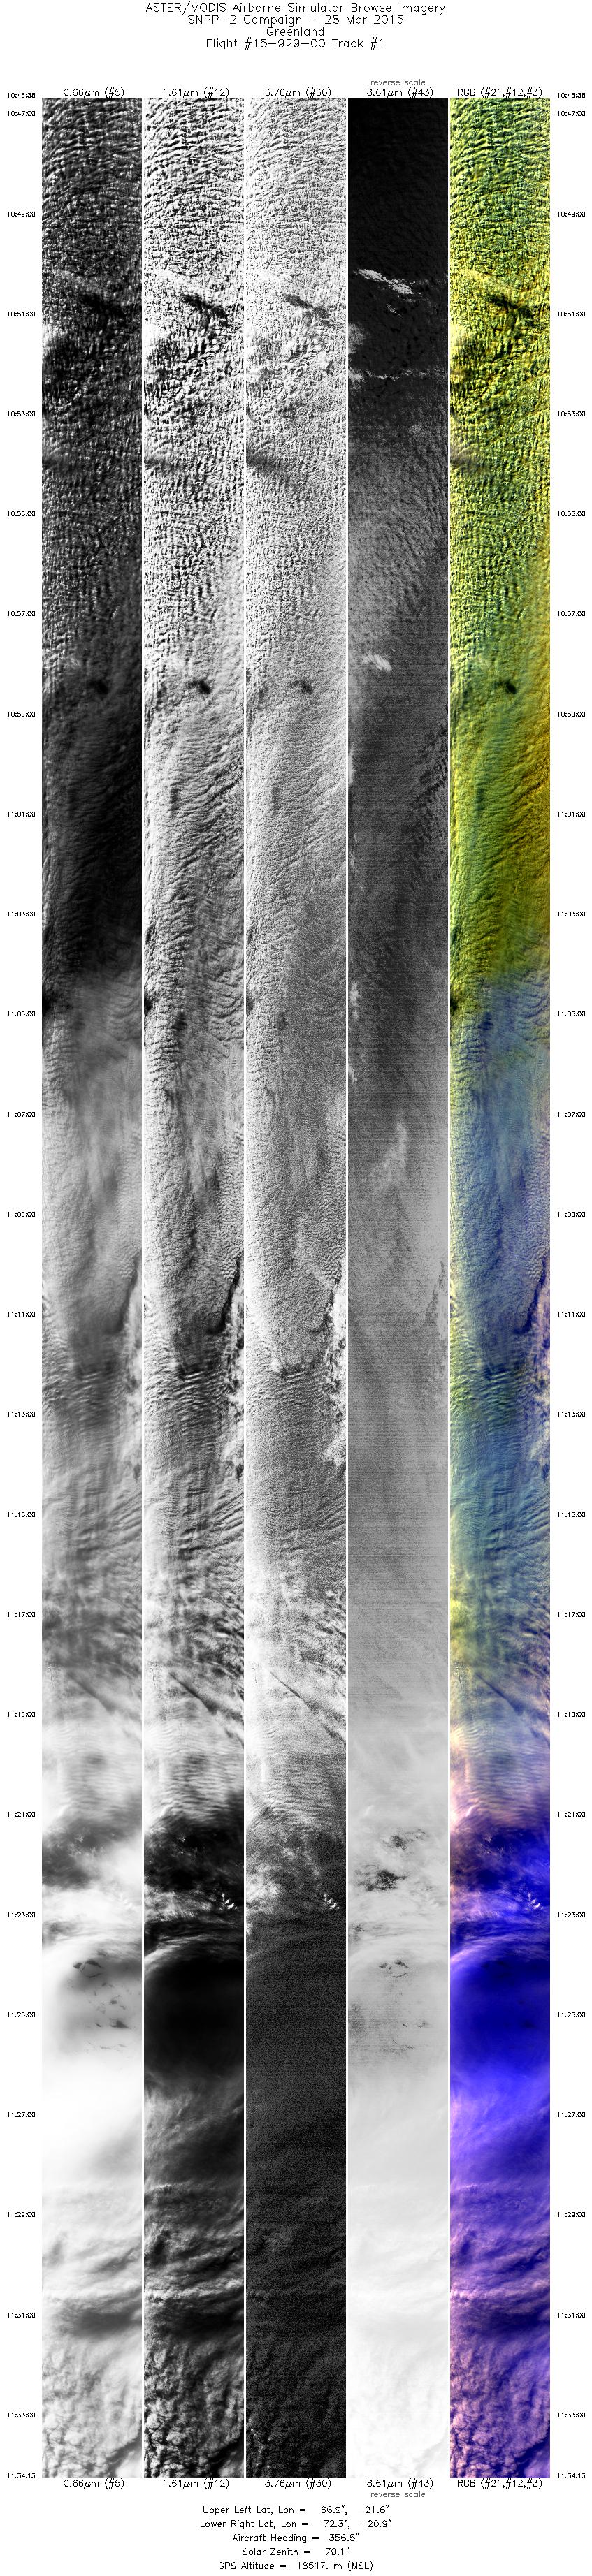
| 1 |
10:46 - 11:34 |
358.0 |
66.916 - 72.275 |
22.020 - 20.403 |
17041 |
18232 |
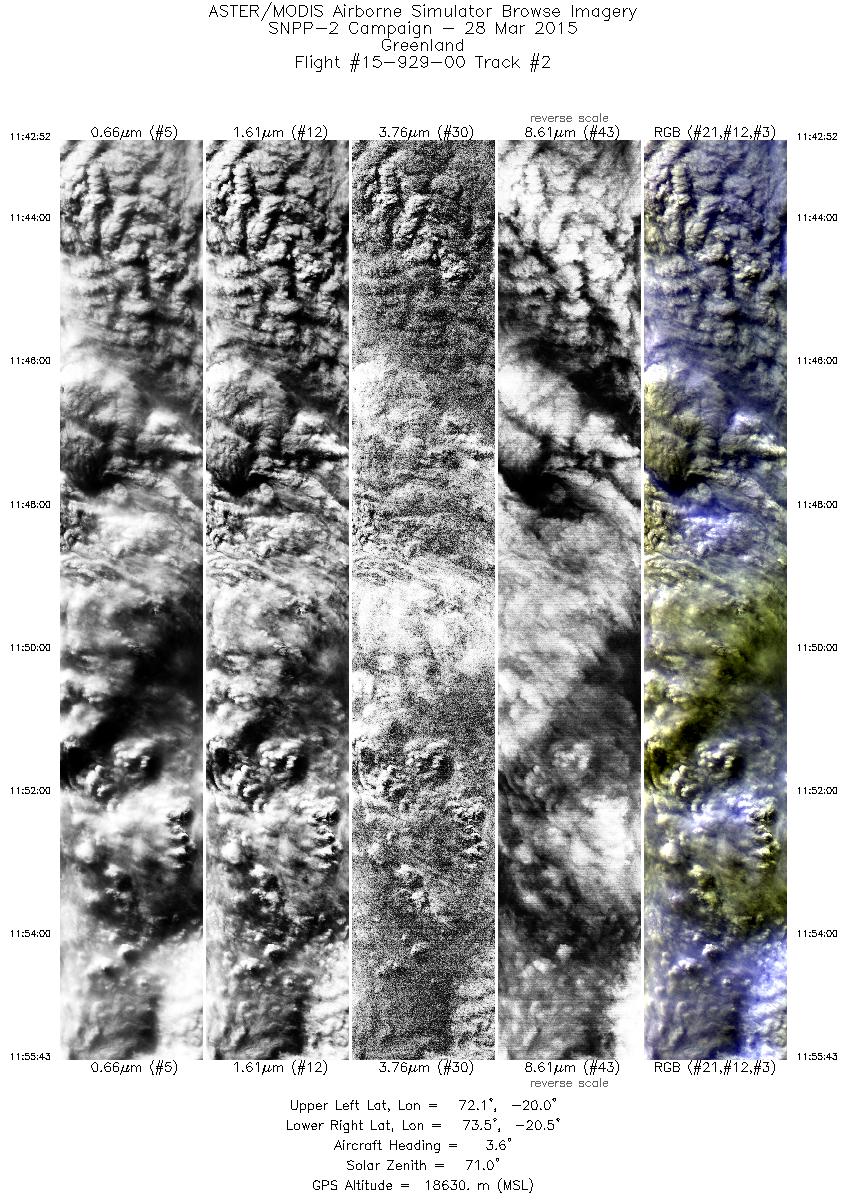
| 2 |
11:42 - 11:55 |
2.9 |
72.071 - 73.480 |
20.468 - 19.974 |
4600 |
18510 |
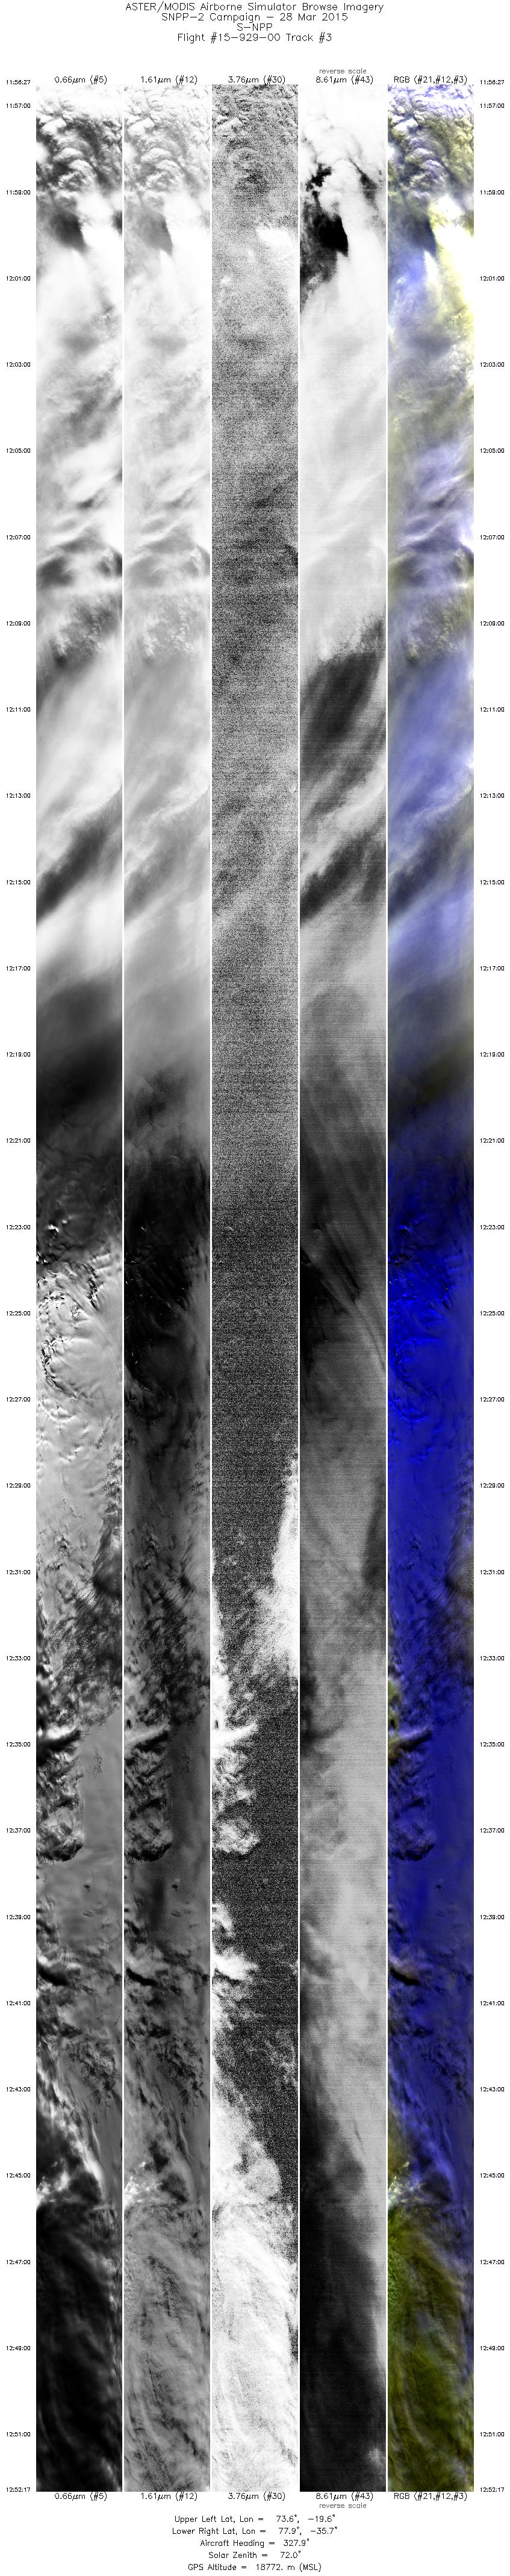
| 3 |
11:56 - 12:52 |
321.2 |
73.556 - 78.033 |
20.034 - 35.195 |
19999 |
18747 |
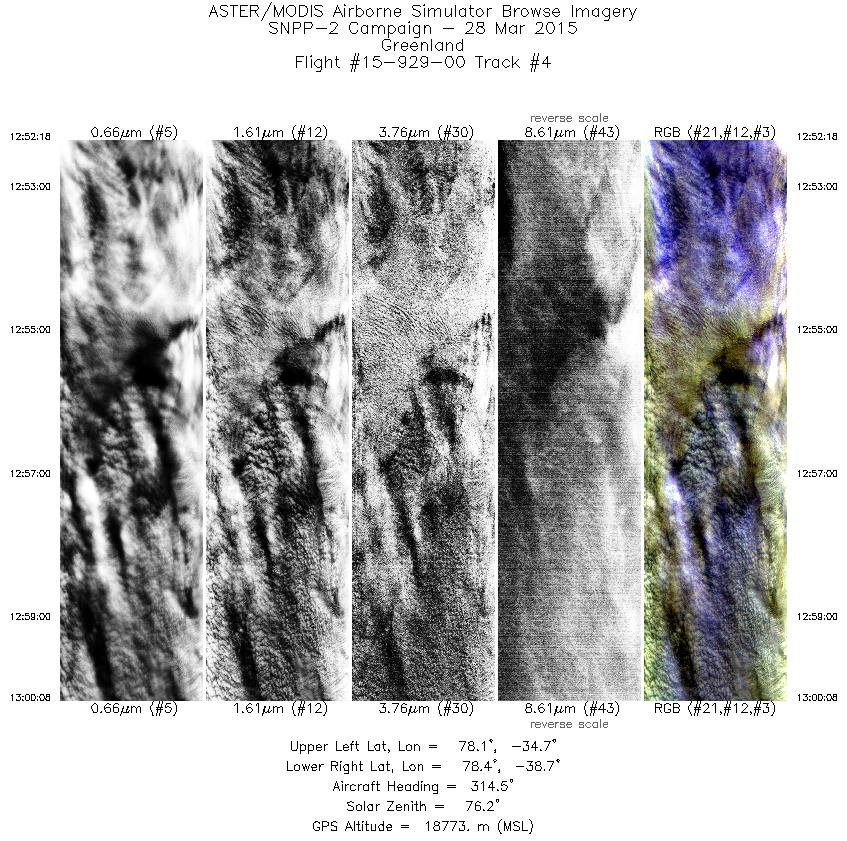
| 4 |
12:52 - 13:00 |
313.3 |
78.033 - 78.563 |
35.196 - 38.174 |
2806 |
18774 |
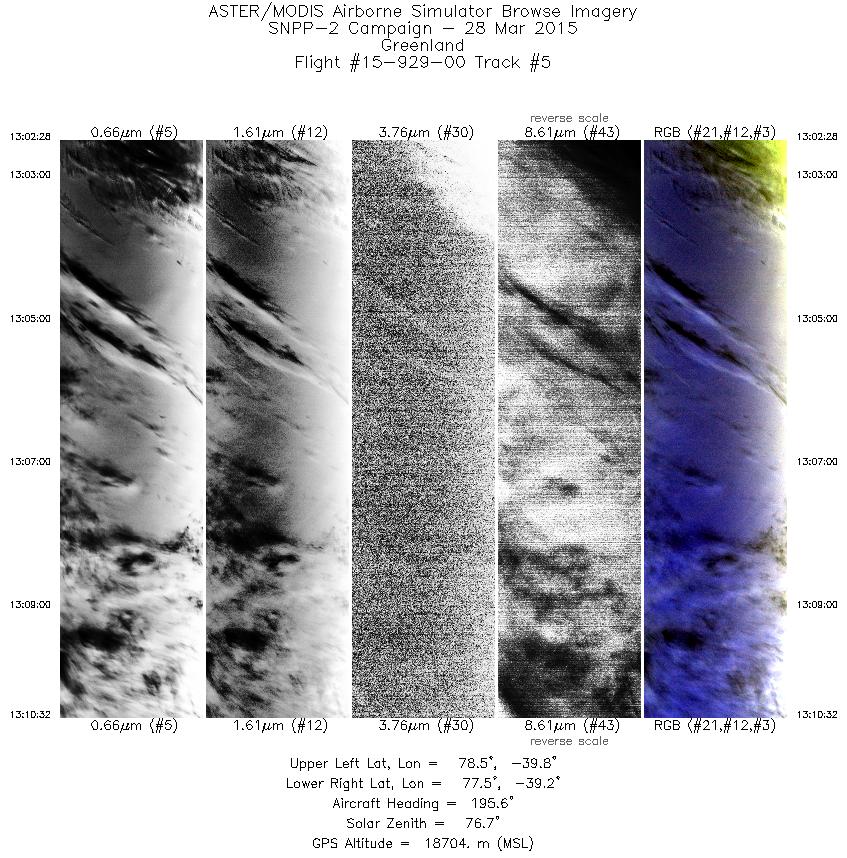
| 5 |
13:02 - 13:10 |
194.5 |
78.455 - 77.529 |
39.069 - 39.921 |
2891 |
18674 |
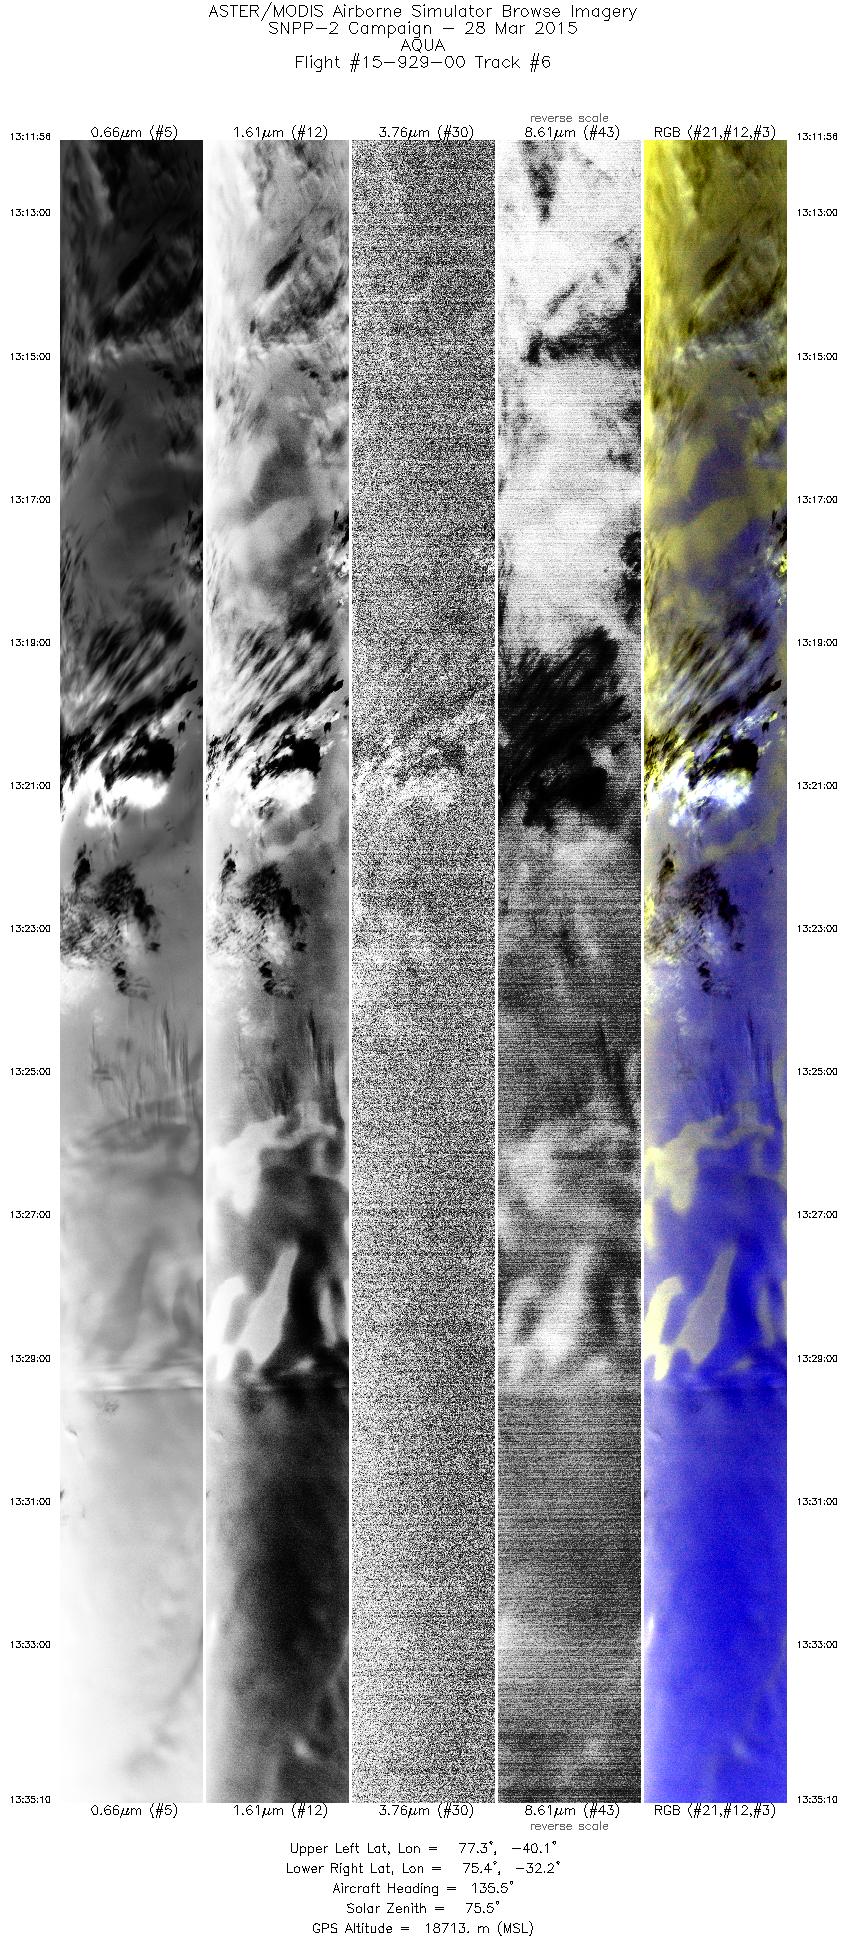
| 6 |
13:11 - 13:35 |
140.2 |
77.382 - 75.299 |
39.635 - 32.732 |
8318 |
18705 |
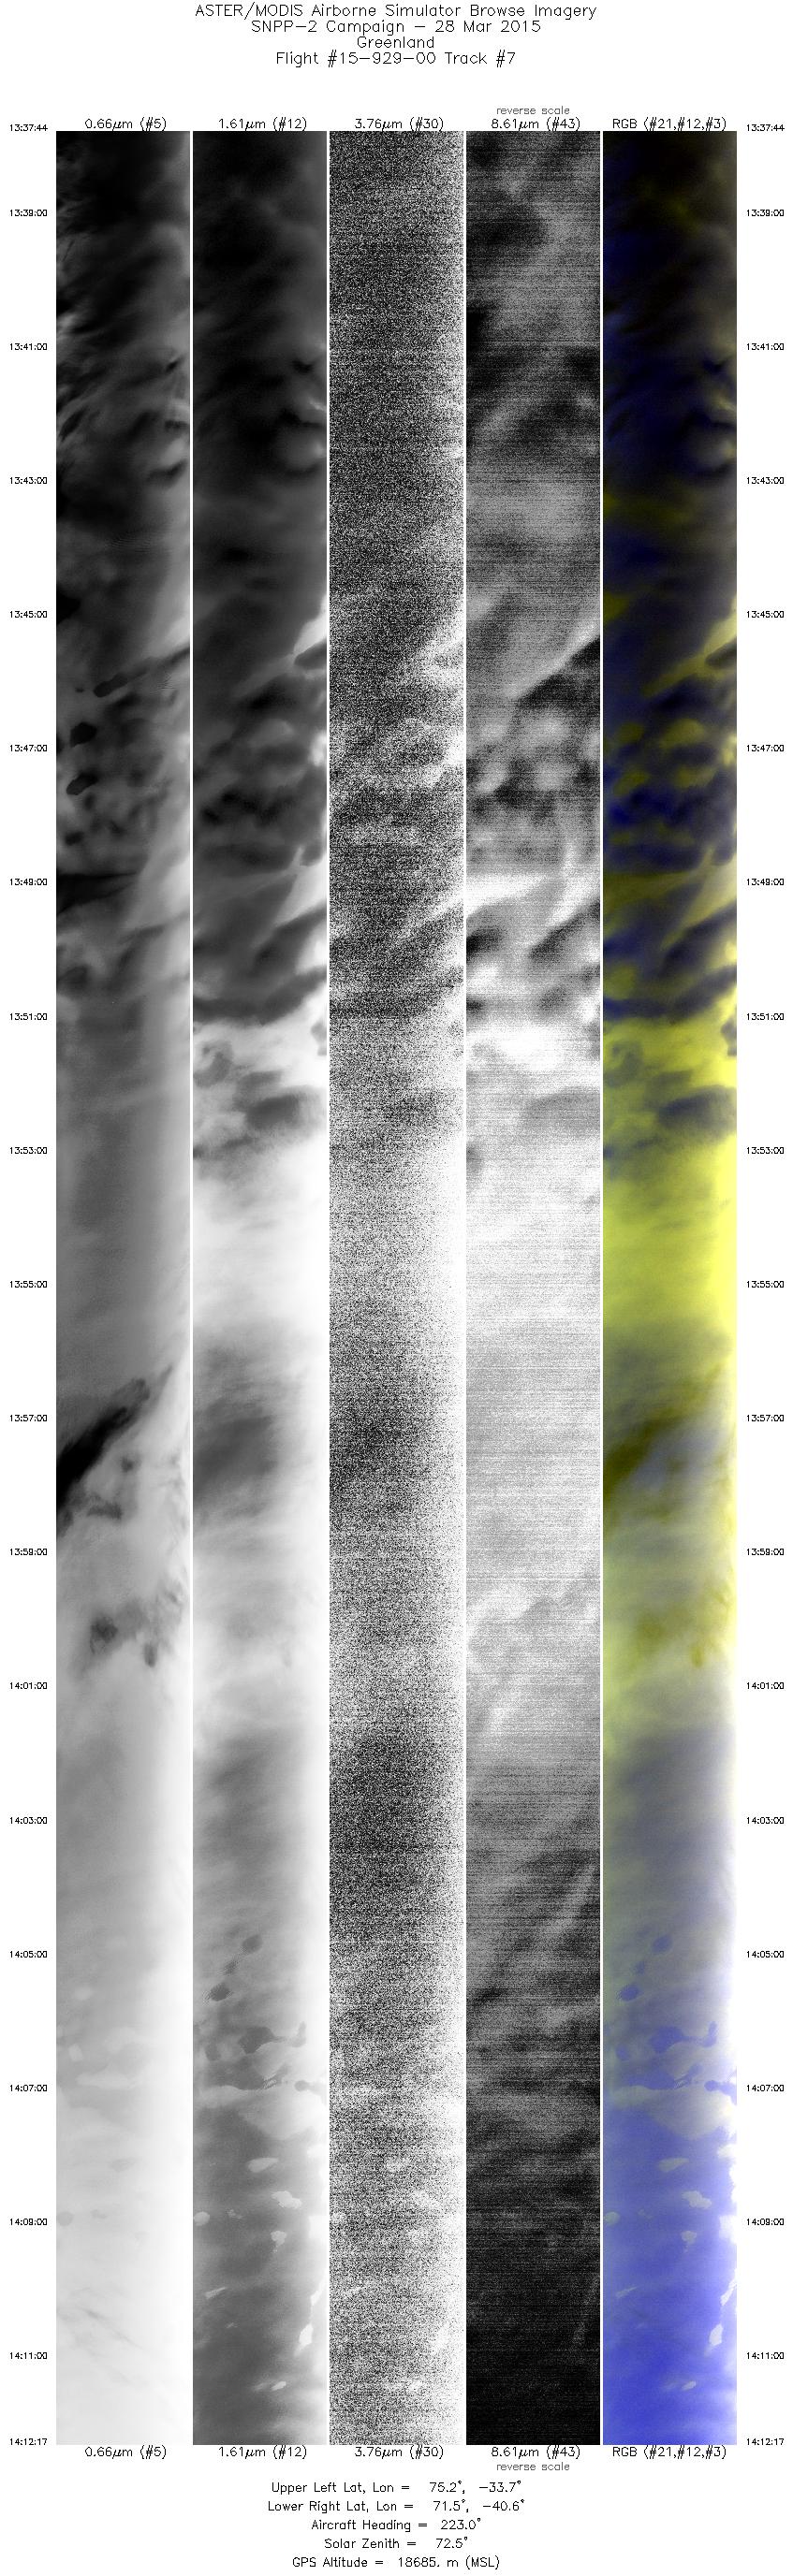
| 7 |
13:37 - 14:12 |
219.7 |
75.090 - 71.630 |
33.255 - 41.018 |
12368 |
18620 |
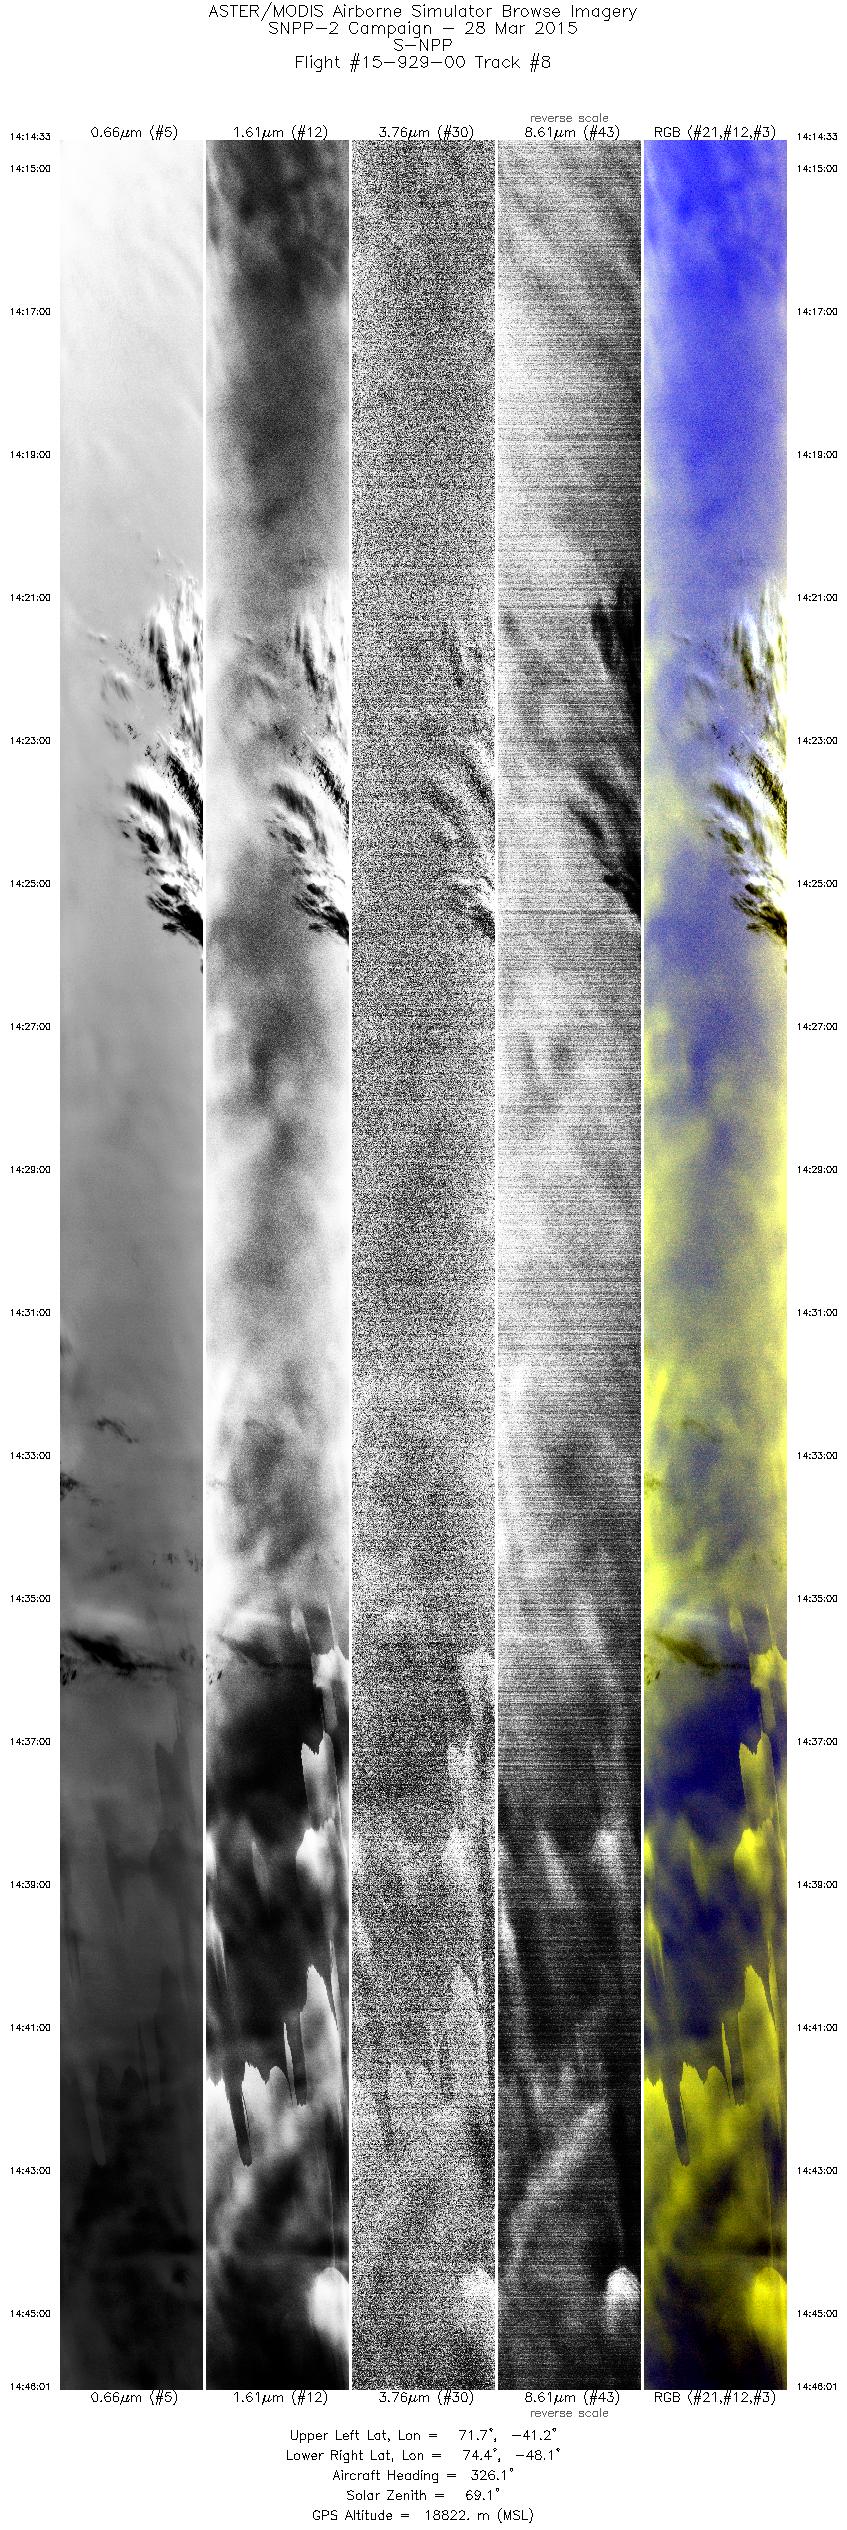
| 8 |
14:14 - 14:46 |
325.9 |
71.664 - 74.451 |
41.600 - 47.671 |
11252 |
18850 |
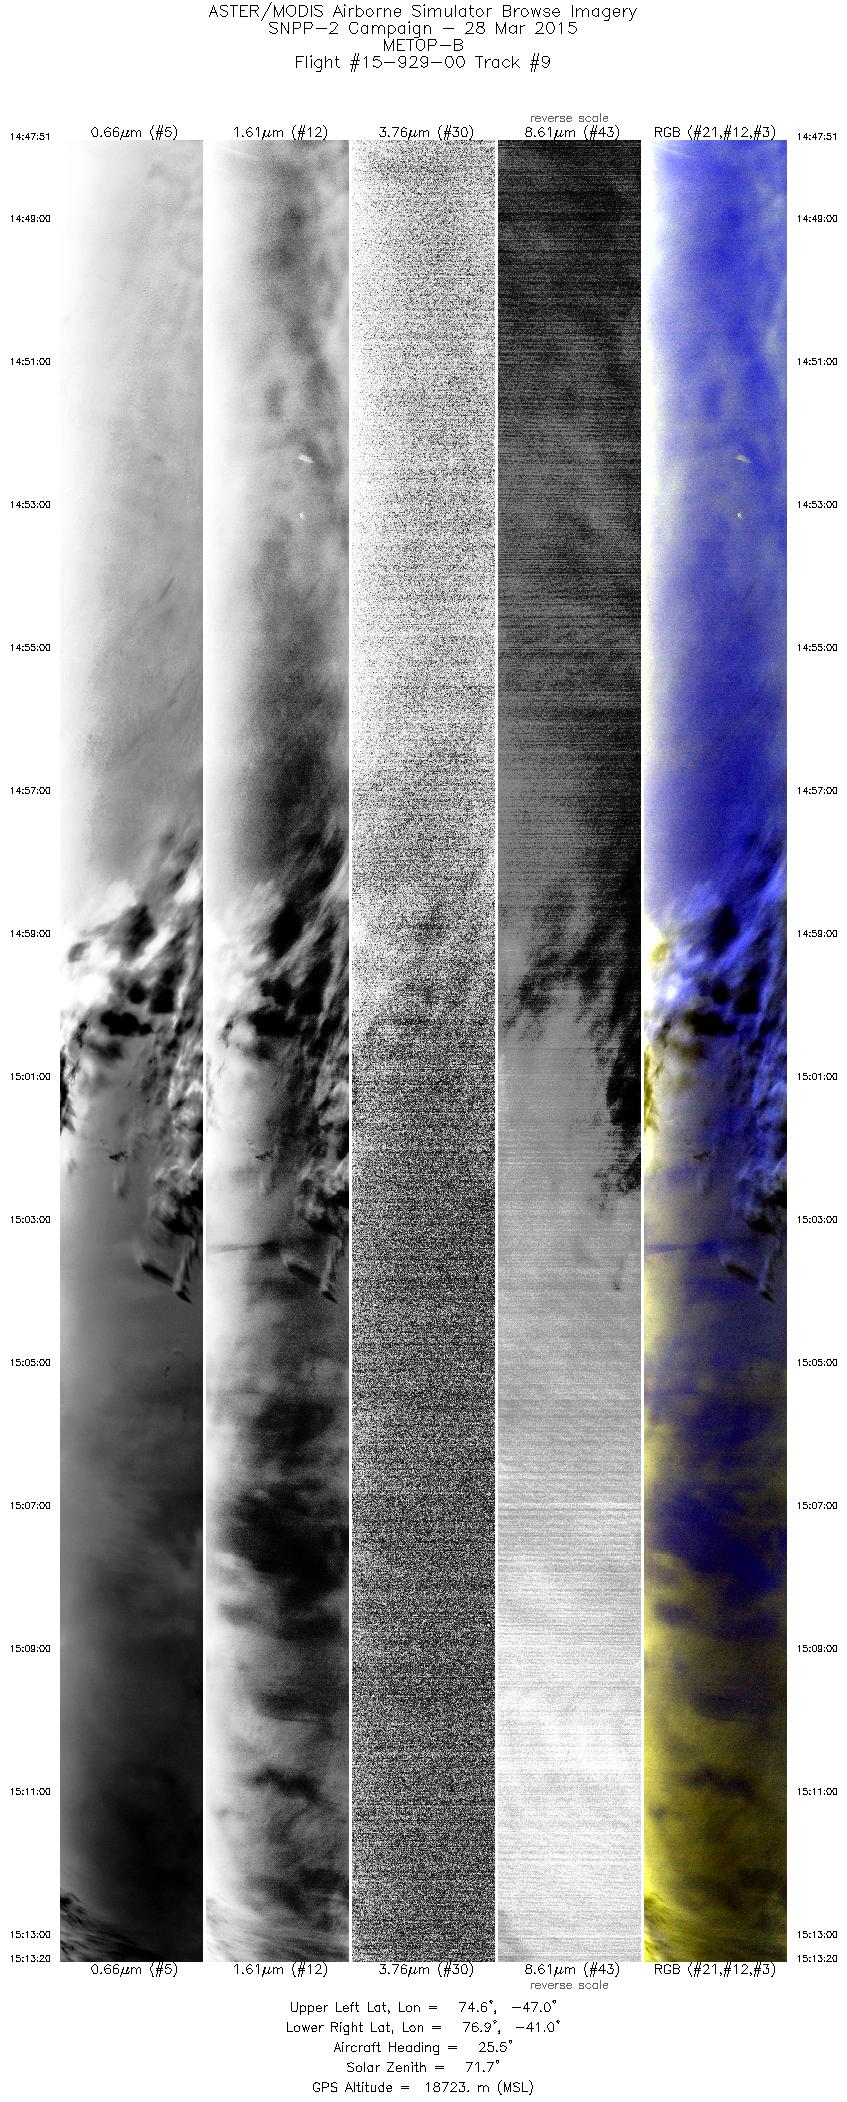
| 9 |
14:47 - 15:13 |
31.1 |
74.626 - 76.828 |
47.528 - 40.508 |
9114 |
18699 |
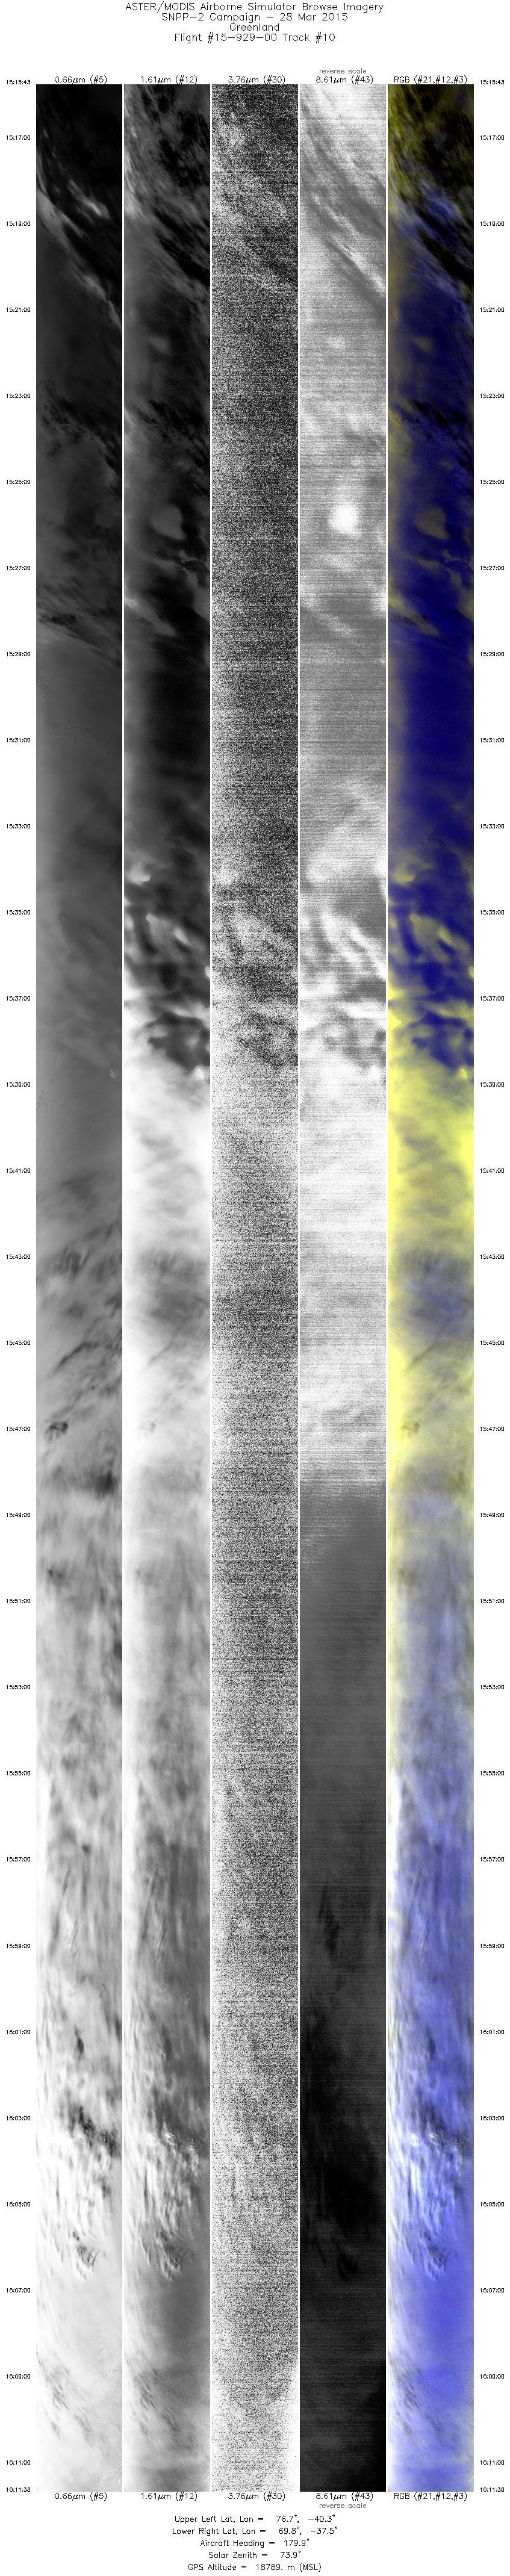
| 10 |
15:15 - 16:11 |
181.9 |
76.752 - 69.804 |
39.599 - 37.928 |
19999 |
18752 |
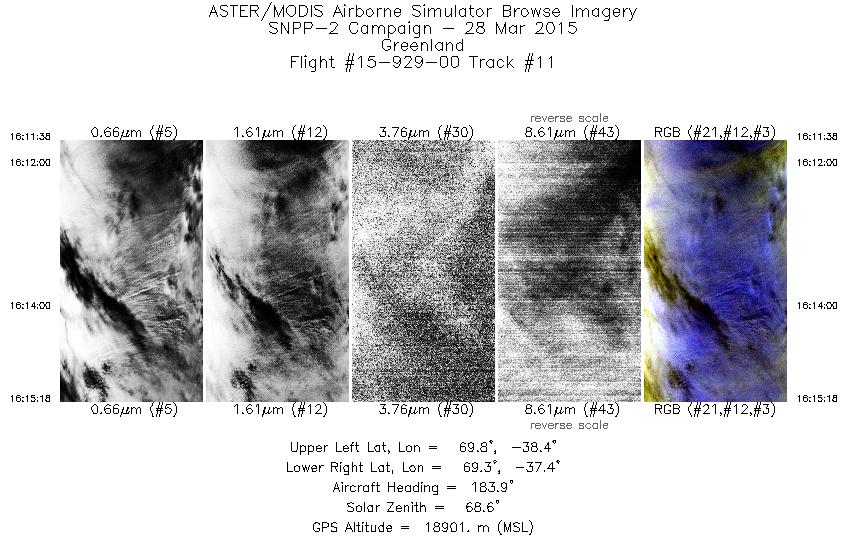
| 11 |
16:11 - 16:15 |
184.1 |
69.804 - 69.353 |
37.928 - 37.864 |
1313 |
18907 |
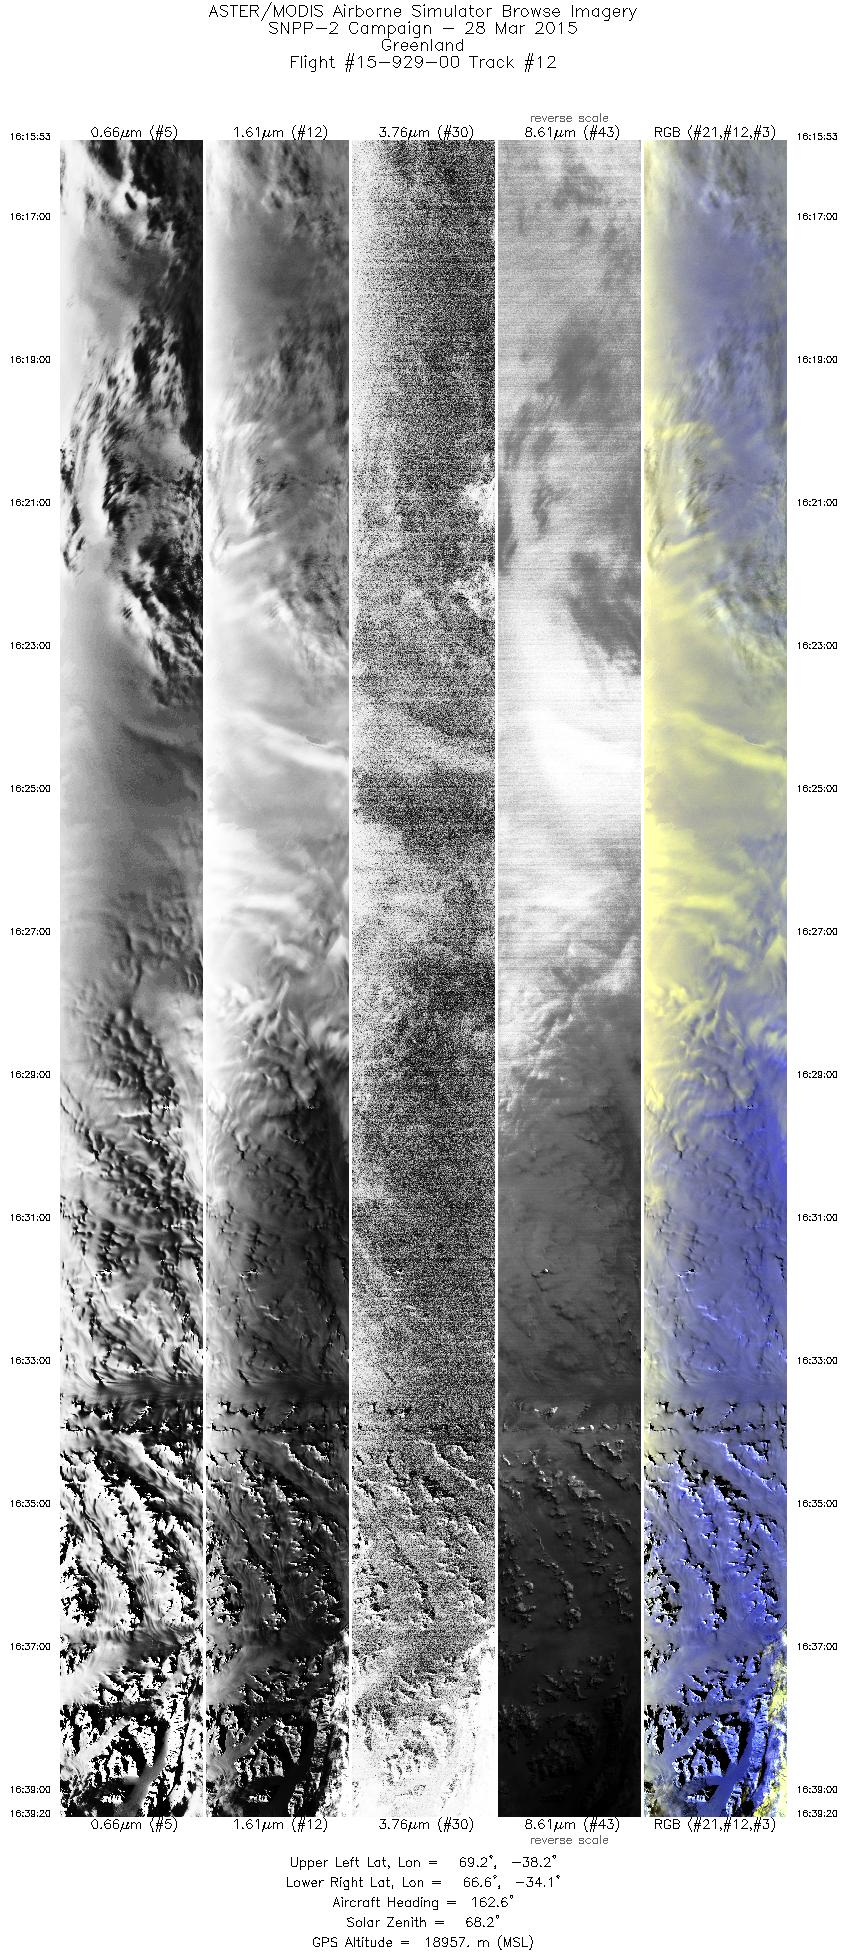
| 12 |
16:15 - 16:39 |
163.2 |
69.283 - 66.576 |
37.813 - 34.446 |
8387 |
18975 |
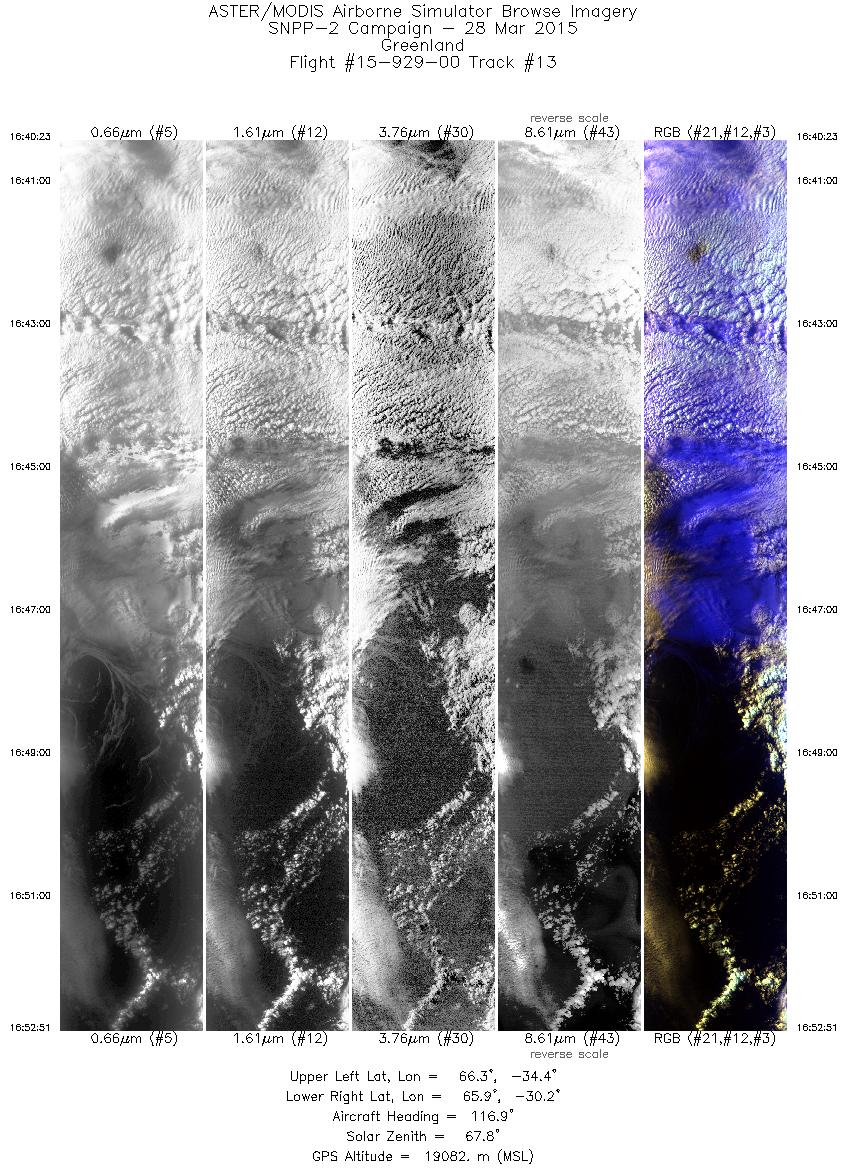
| 13 |
16:40 - 16:52 |
118.1 |
66.485 - 65.811 |
34.199 - 30.388 |
4456 |
19063 |
|


