Flight: 14-939-00
Date: August 26, 2014
Aircraft: NASA ER-2, #809
Deployment: HyspIRI Summer 2014
Flight Location: Southern California
Principal Investigator: Rob Green / Simon Hook (JPL)
Additional Sensors: AVIRIS / RSP
|
Data Evaluation
Overall data quality is good.
All data collected @6.25Hz
|
Processing Information
Level-1B Data in HDF format is available
Flight Line Summary
Spectral Band Configuration
Spectral Response Function Table
Spectral Response Function (text)
|
Browse Imagery
Flight Tracks: 13
Scanlines: 122520
|
Browse Imagery Table
|
Click a Flight Track number to view a quicklook image
Lat/Lon ranges are for the BEG-END scanline nadir pixels
|
Flight
Track |
Time Span
(UTC) |
Heading
(Deg) |
Lat Range
(Deg N) |
Lon Range
(Deg W) |
Length
(Scanlines) |
Altitude
(Meters) |
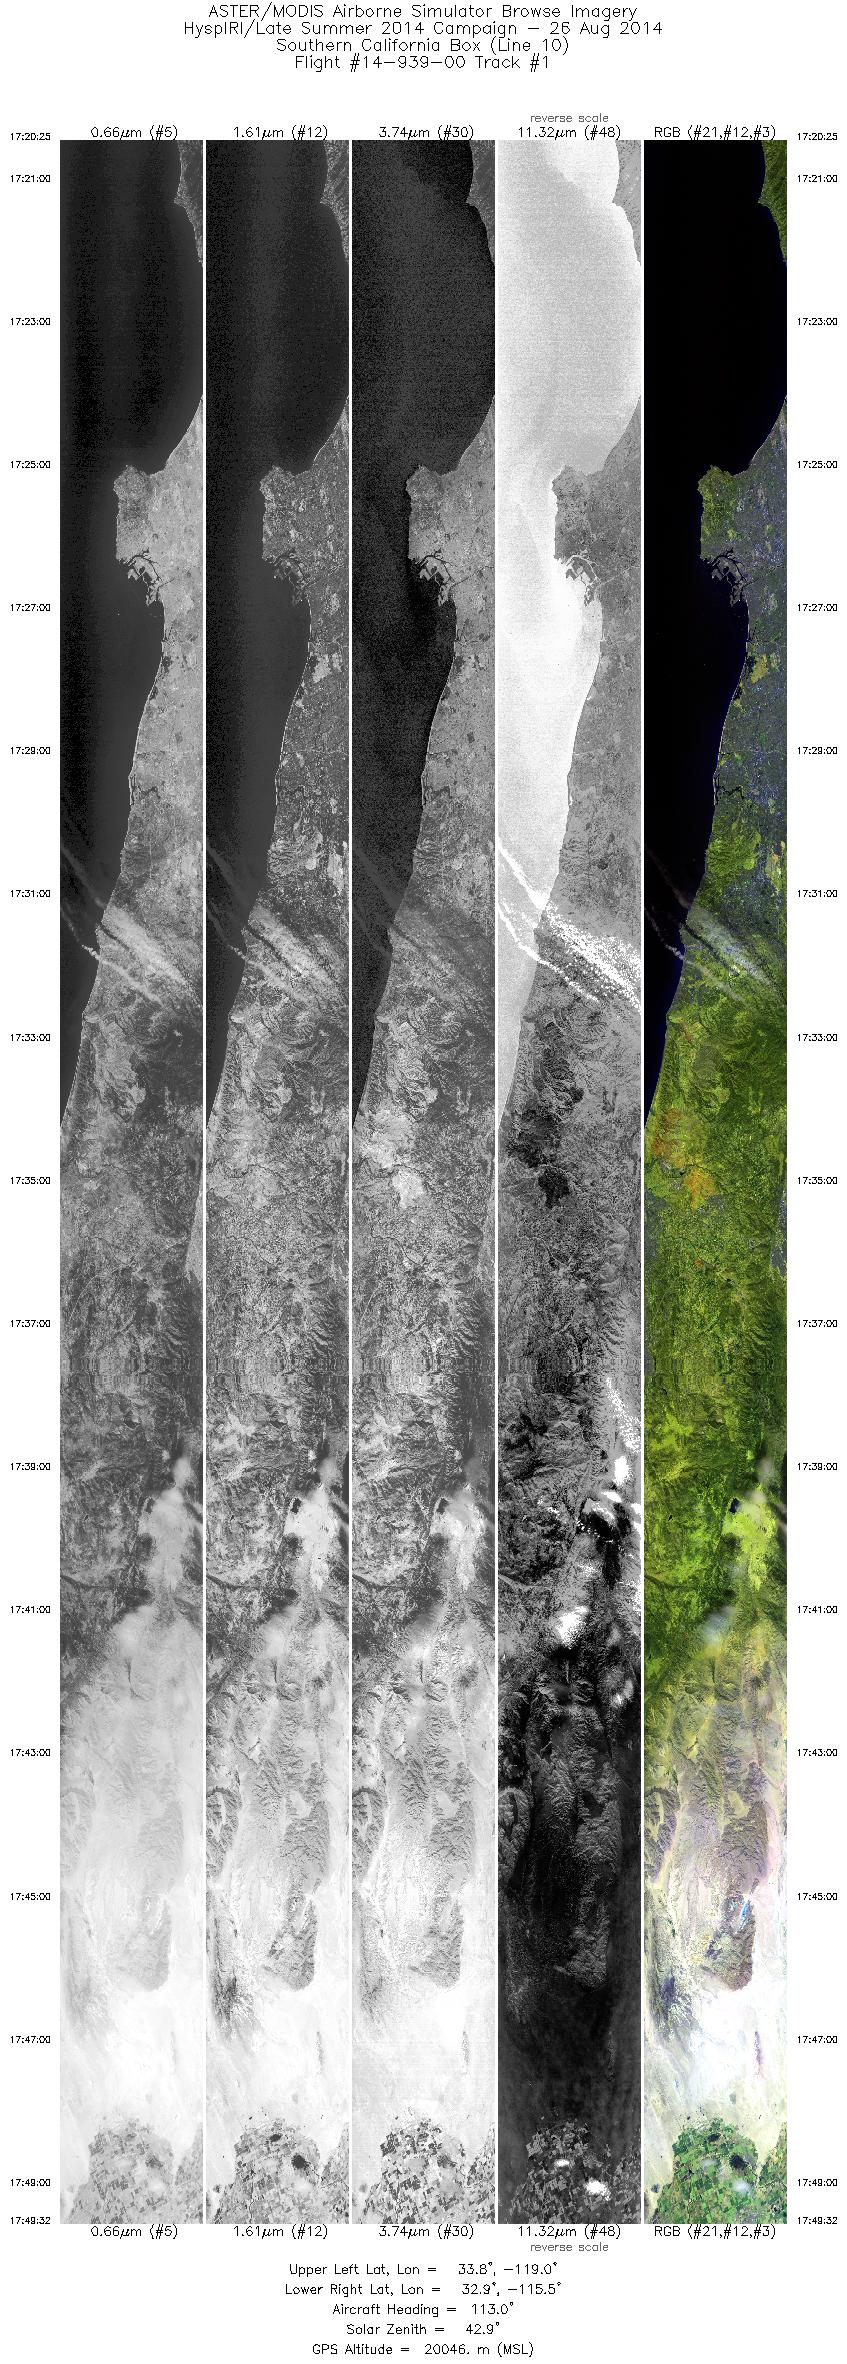
| 1 |
17:20 - 17:49 |
112.6 |
33.959 - 32.781 |
118.946 - 115.595 |
10420 |
19777 |
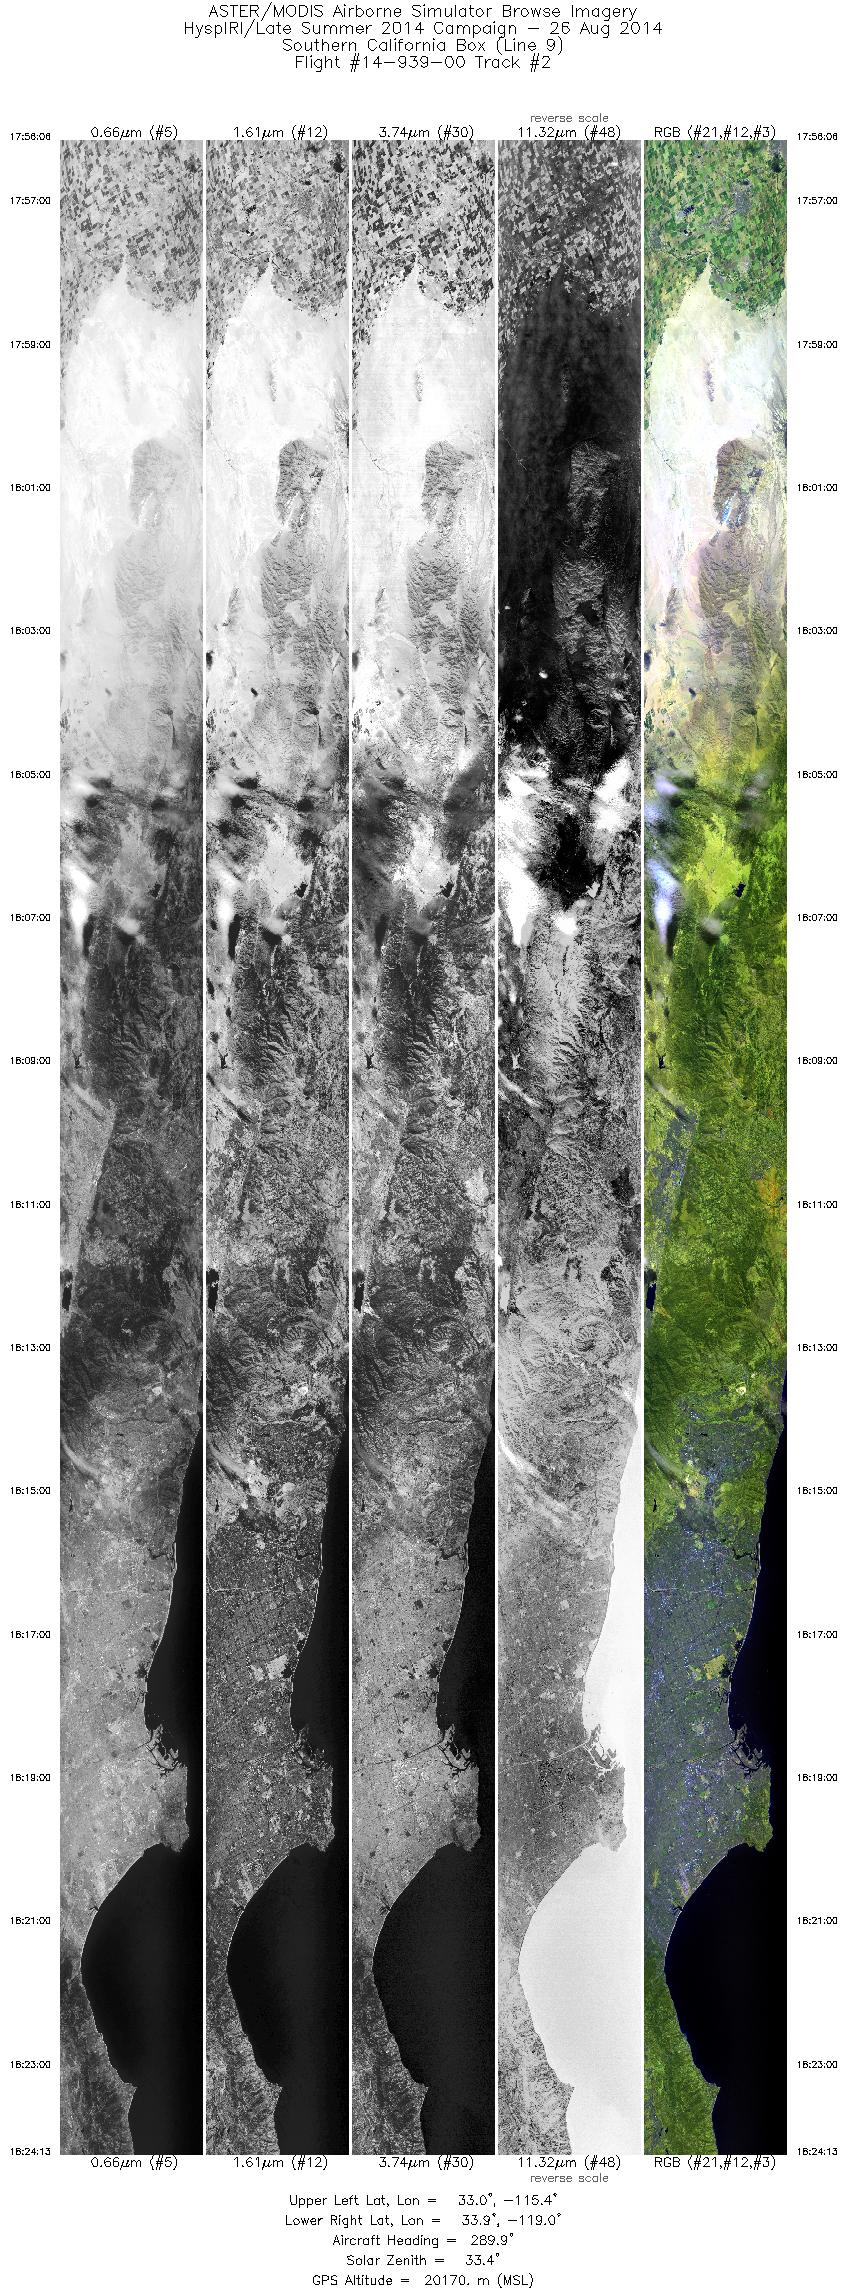
| 2 |
17:56 - 18:24 |
291.6 |
32.796 - 34.048 |
115.429 - 118.920 |
10079 |
20176 |
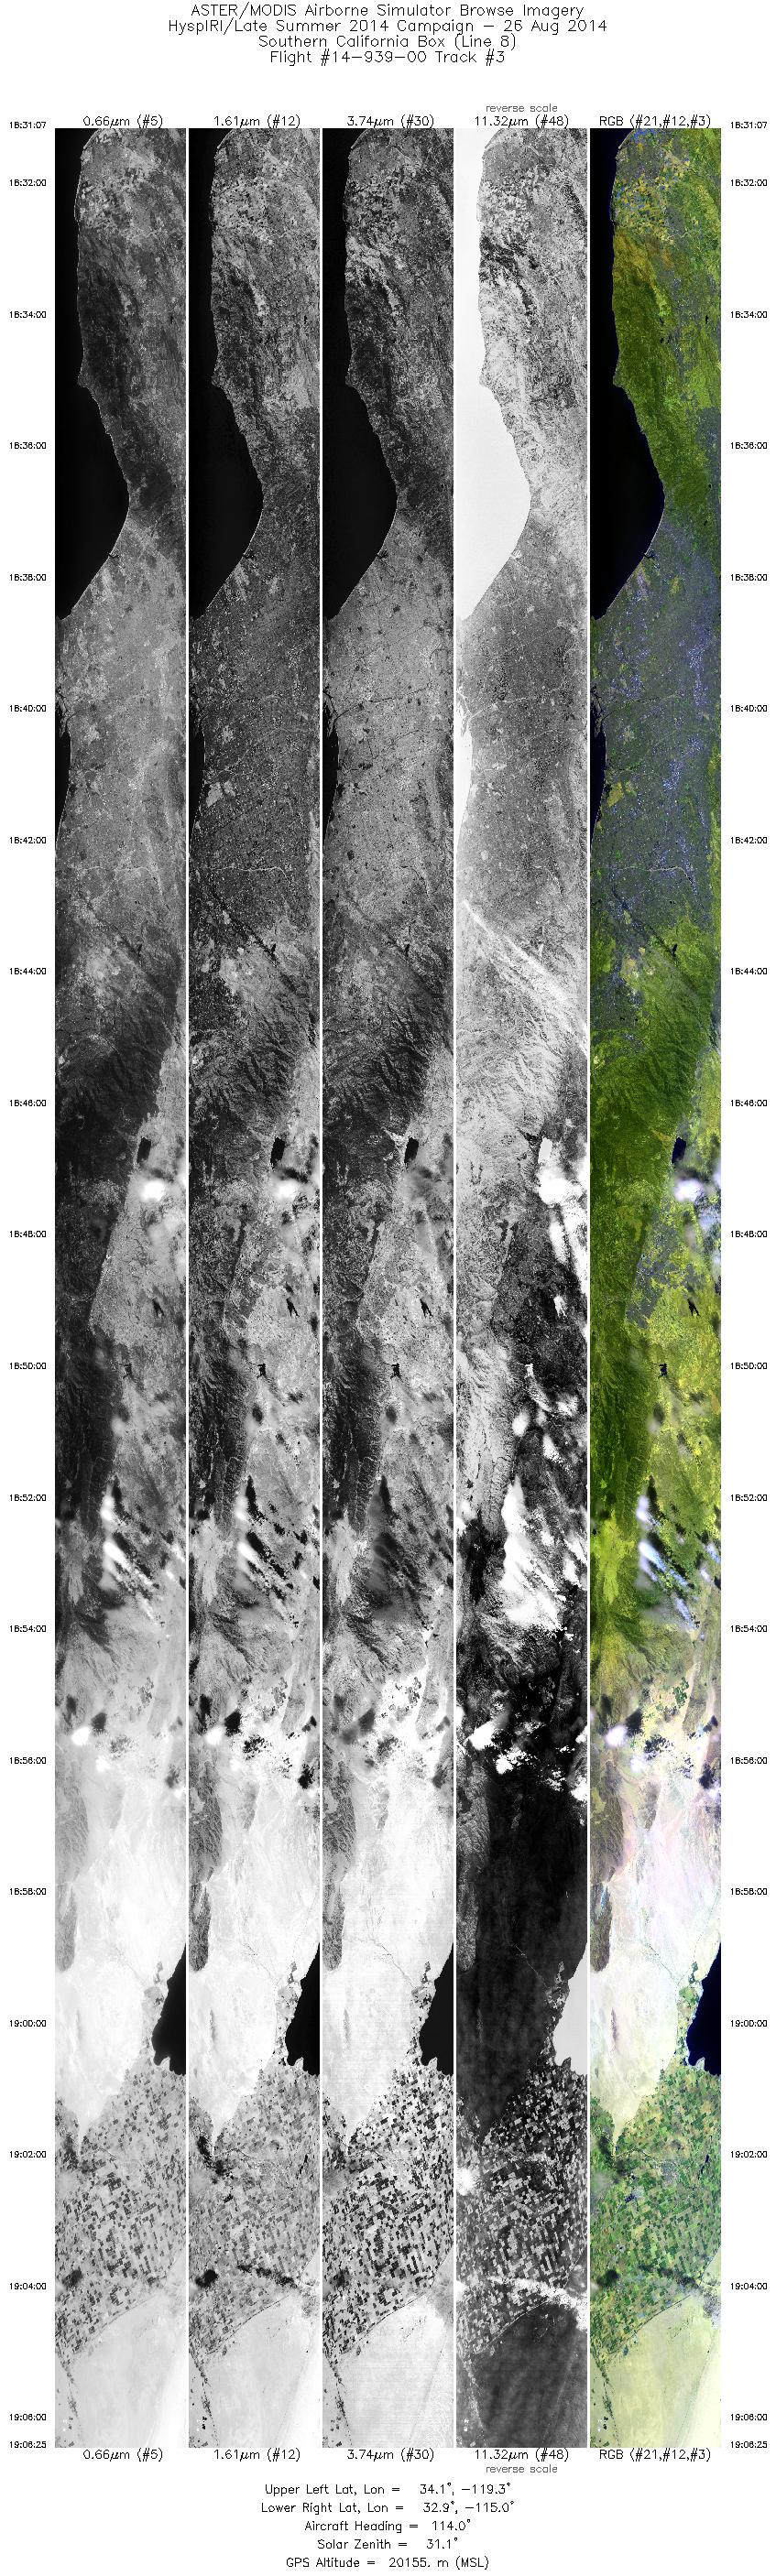
| 3 |
18:31 - 19:06 |
107.2 |
34.247 - 32.783 |
119.231 - 115.056 |
12666 |
20046 |
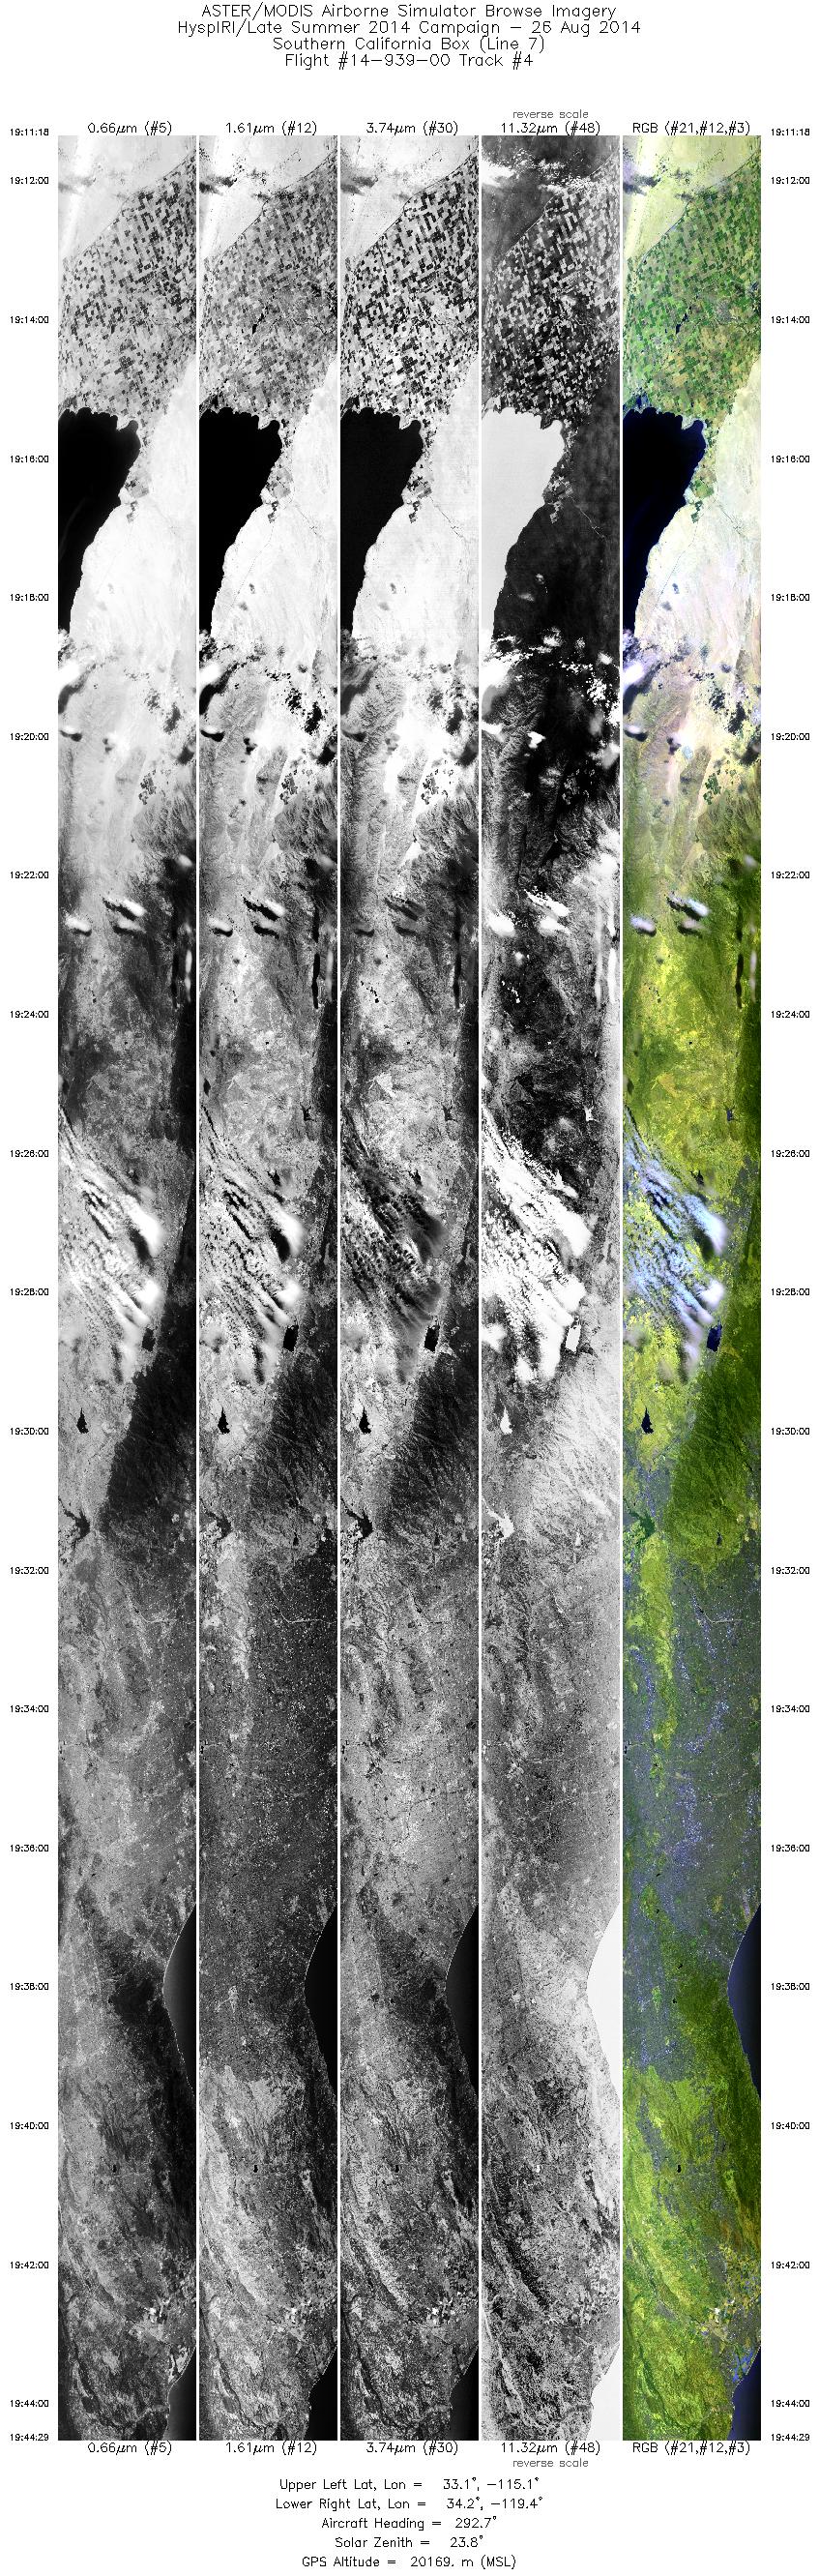
| 4 |
19:11 - 19:44 |
293.0 |
32.924 - 34.375 |
115.183 - 119.323 |
11918 |
20172 |
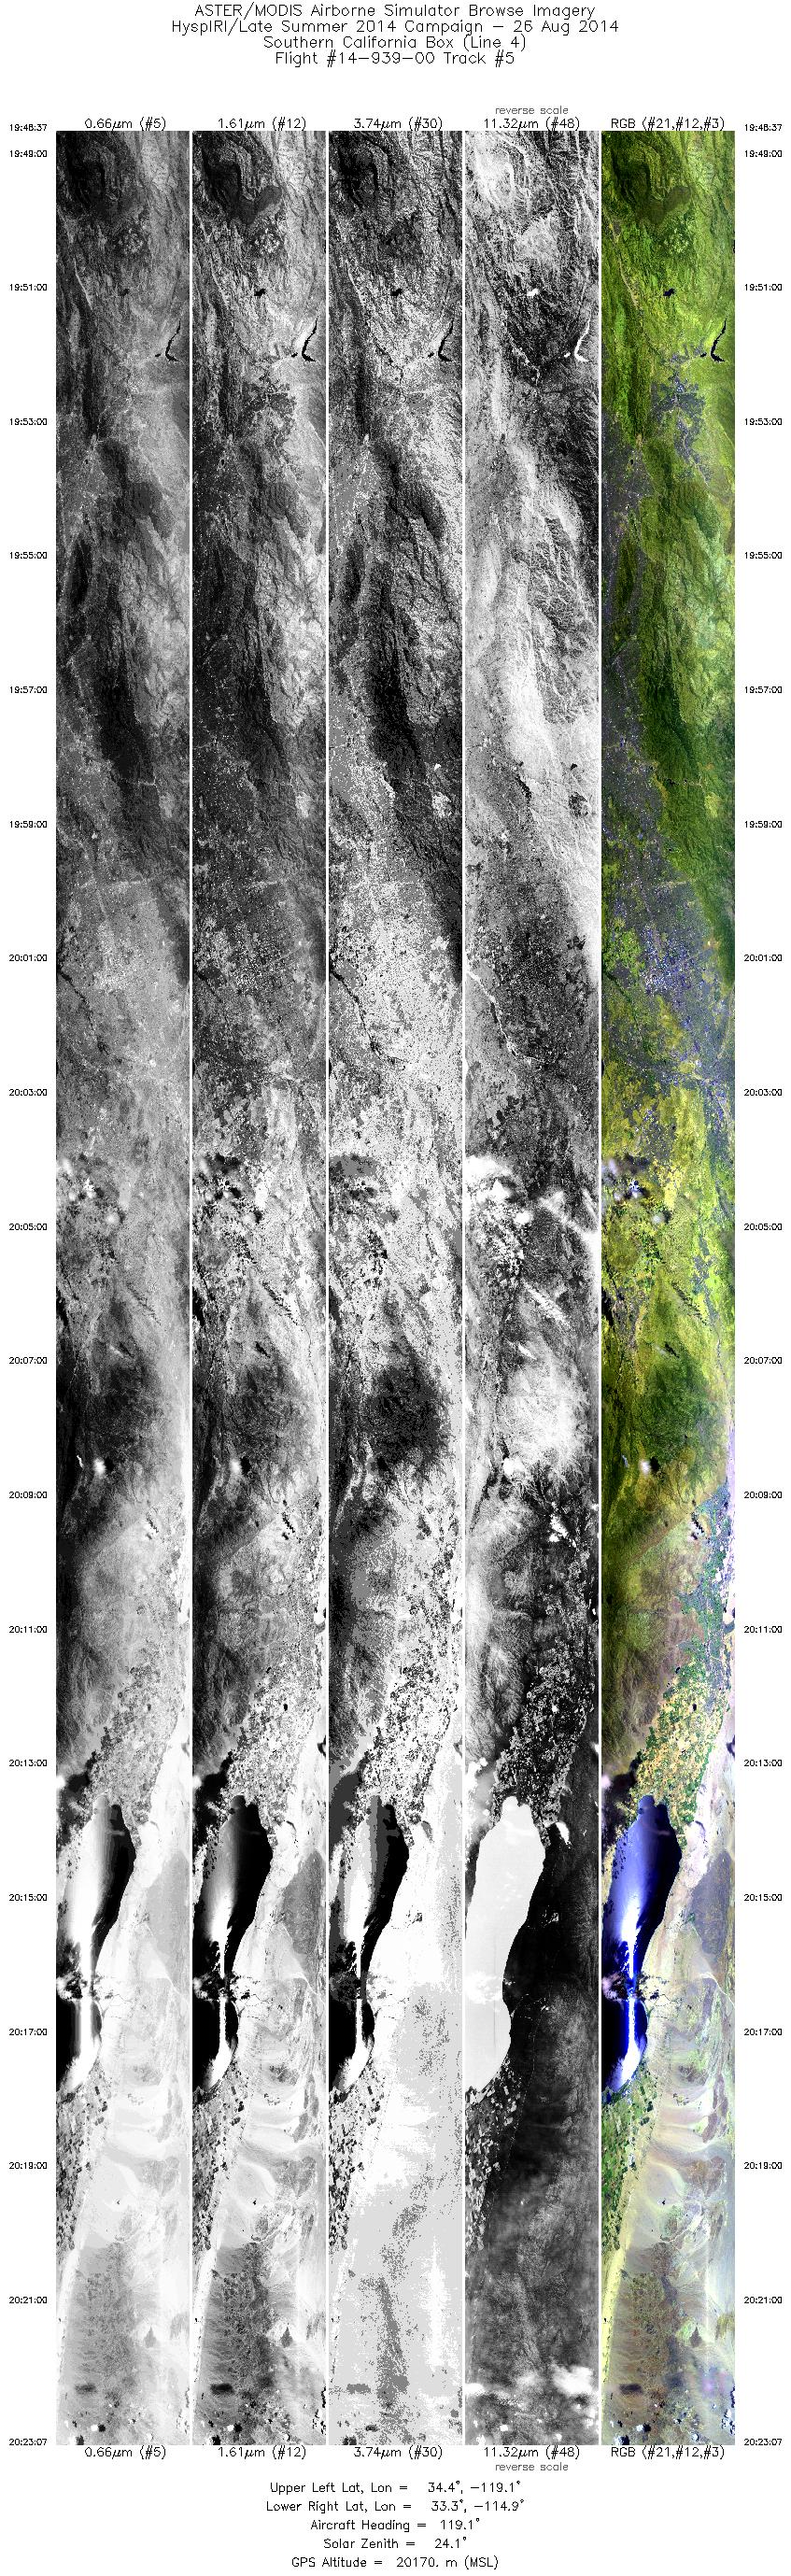
| 5 |
19:48 - 20:23 |
115.1 |
34.574 - 33.123 |
119.050 - 114.943 |
12390 |
20171 |
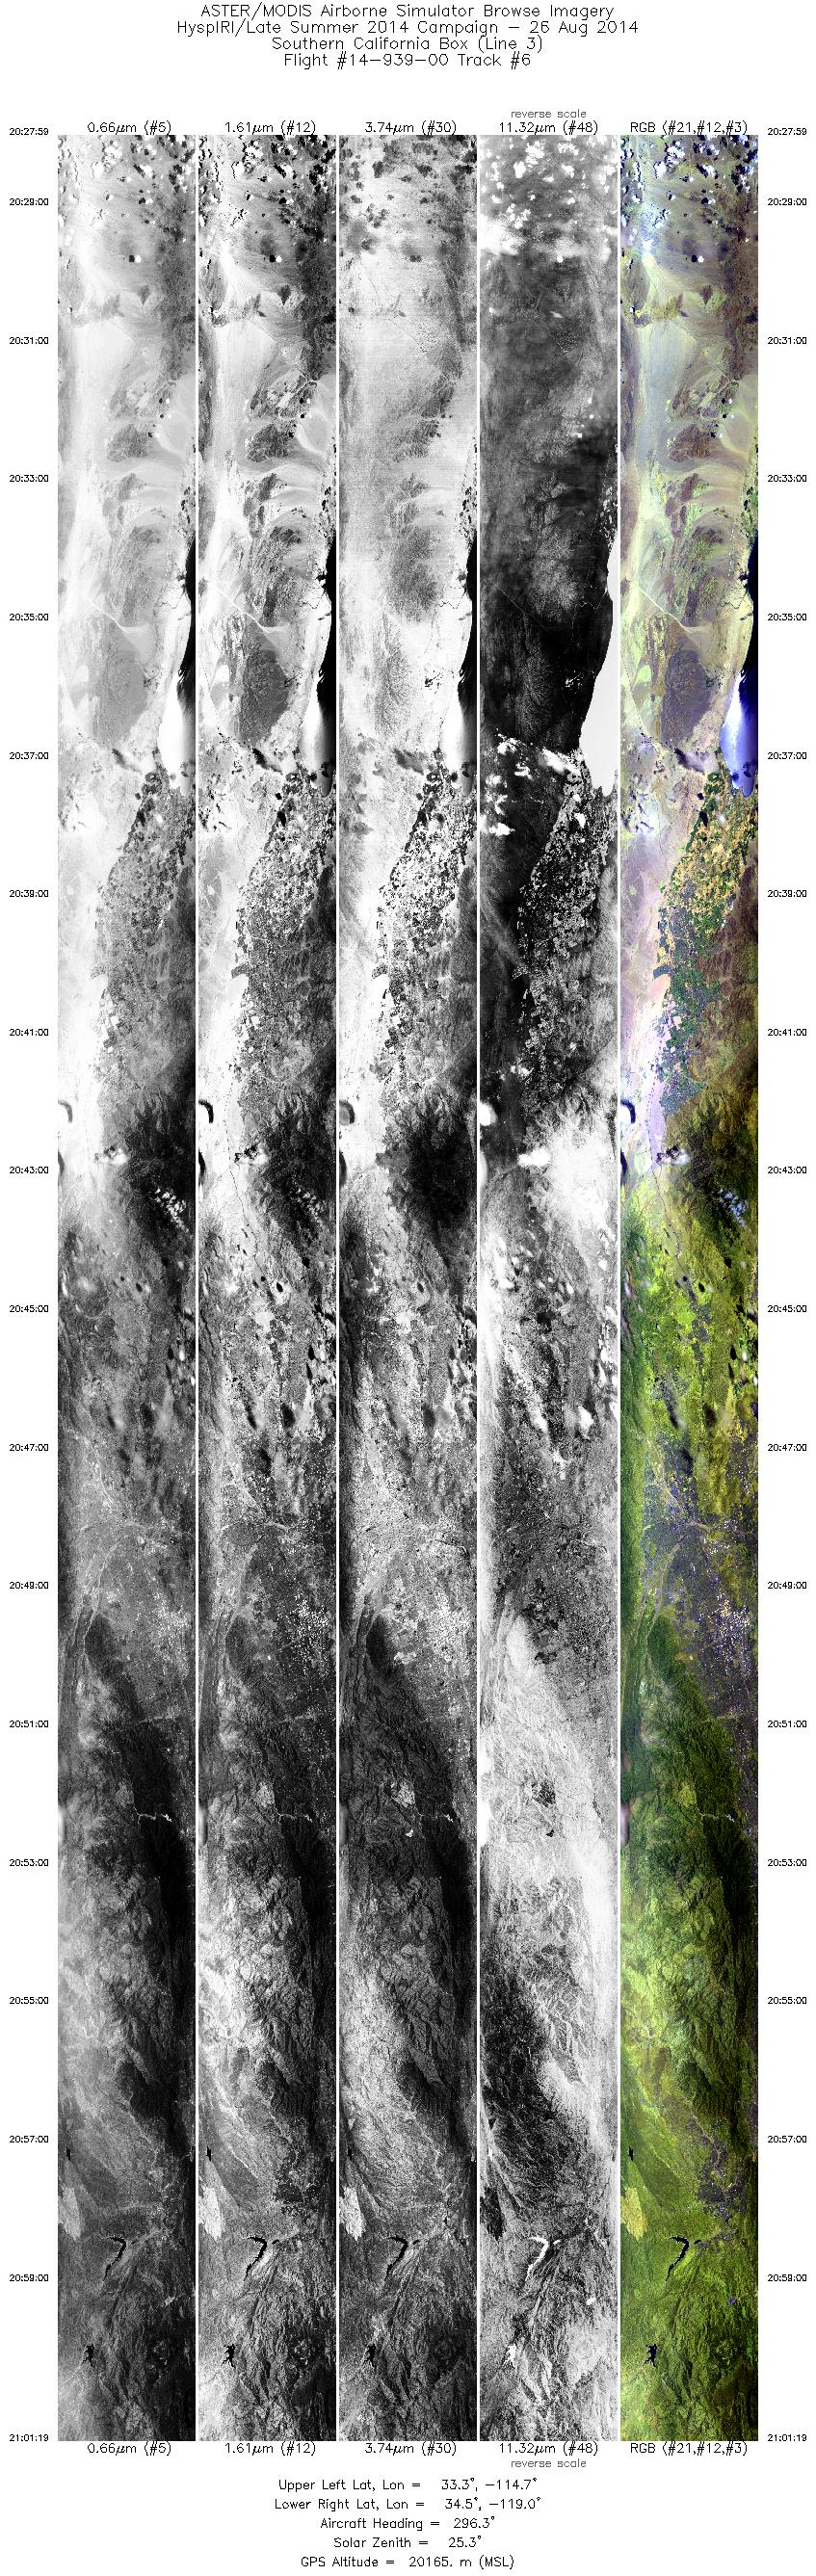
| 6 |
20:27 - 21:01 |
295.1 |
33.161 - 34.642 |
114.795 - 118.974 |
11970 |
20161 |
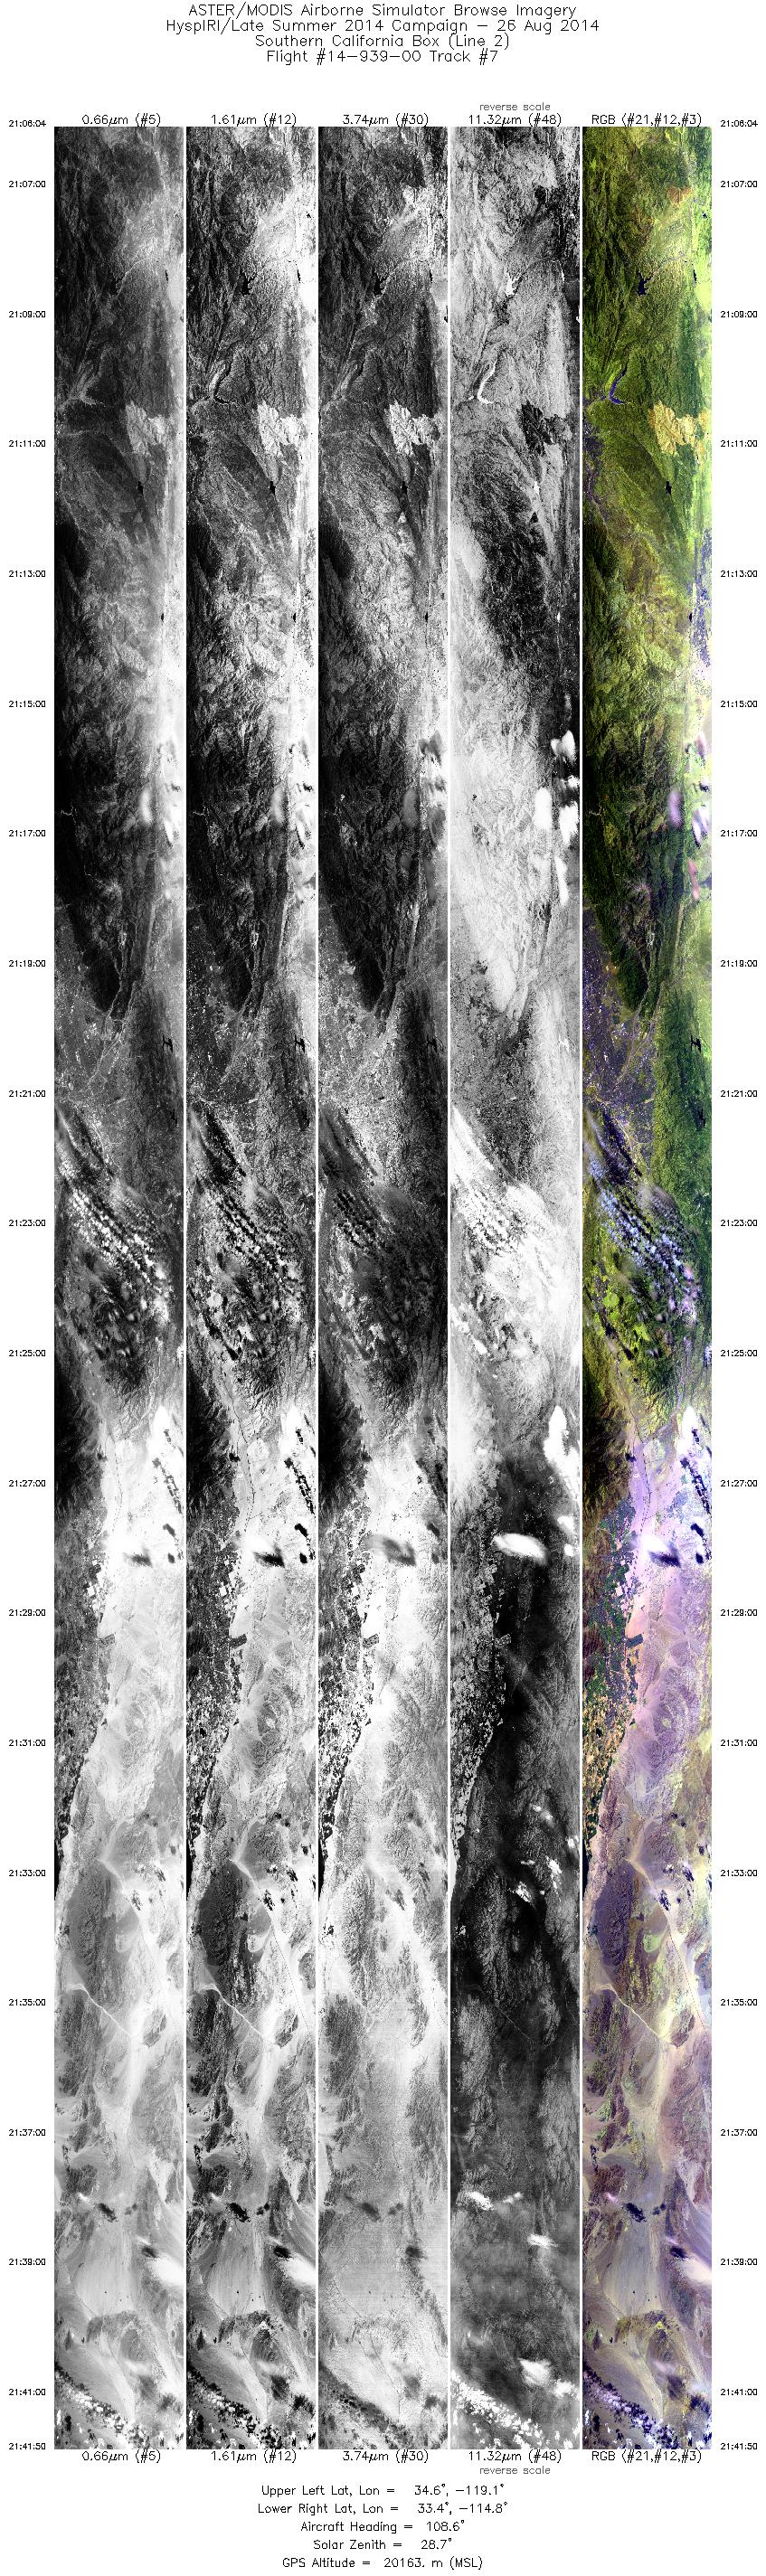
| 7 |
21:06 - 21:41 |
109.6 |
34.764 - 33.284 |
119.068 - 114.862 |
12845 |
20165 |
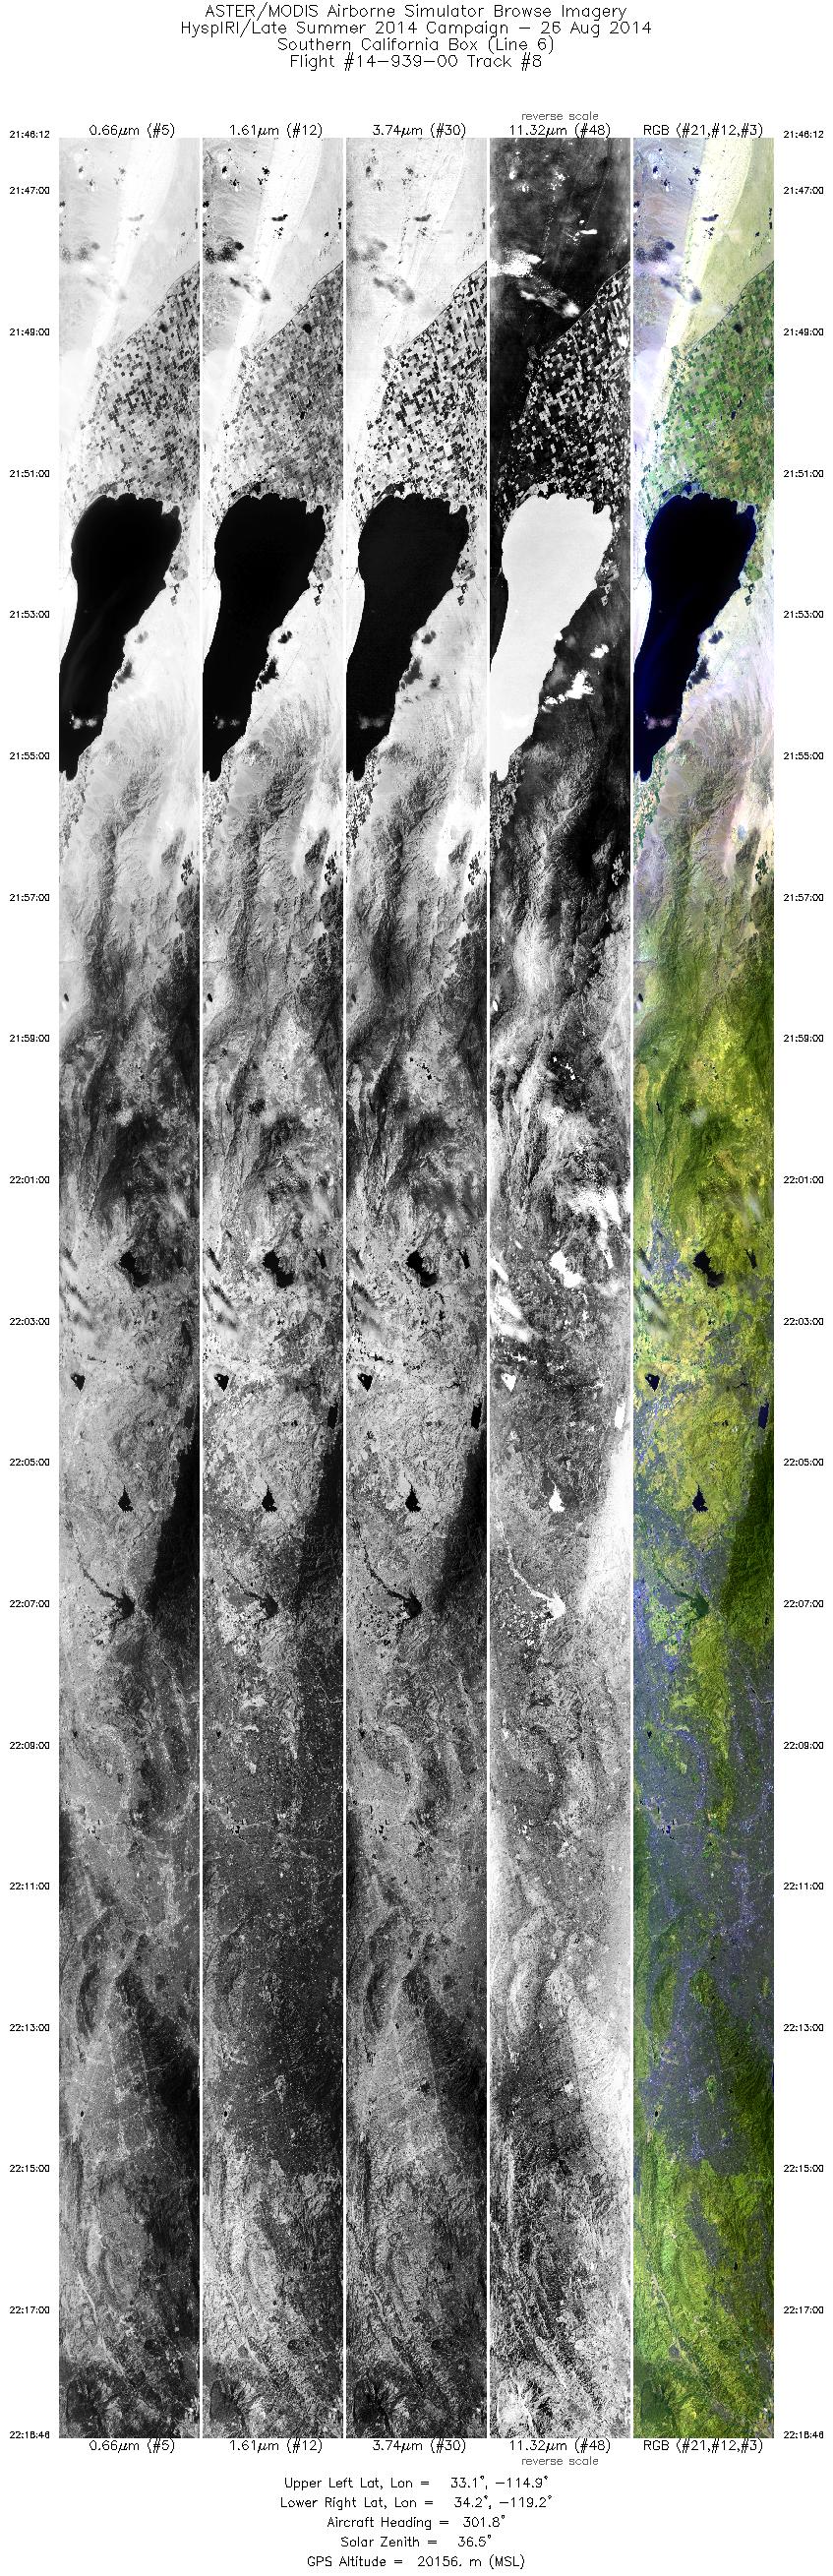
| 8 |
21:46 - 22:18 |
298.0 |
32.944 - 34.398 |
114.995 - 119.105 |
11697 |
20172 |
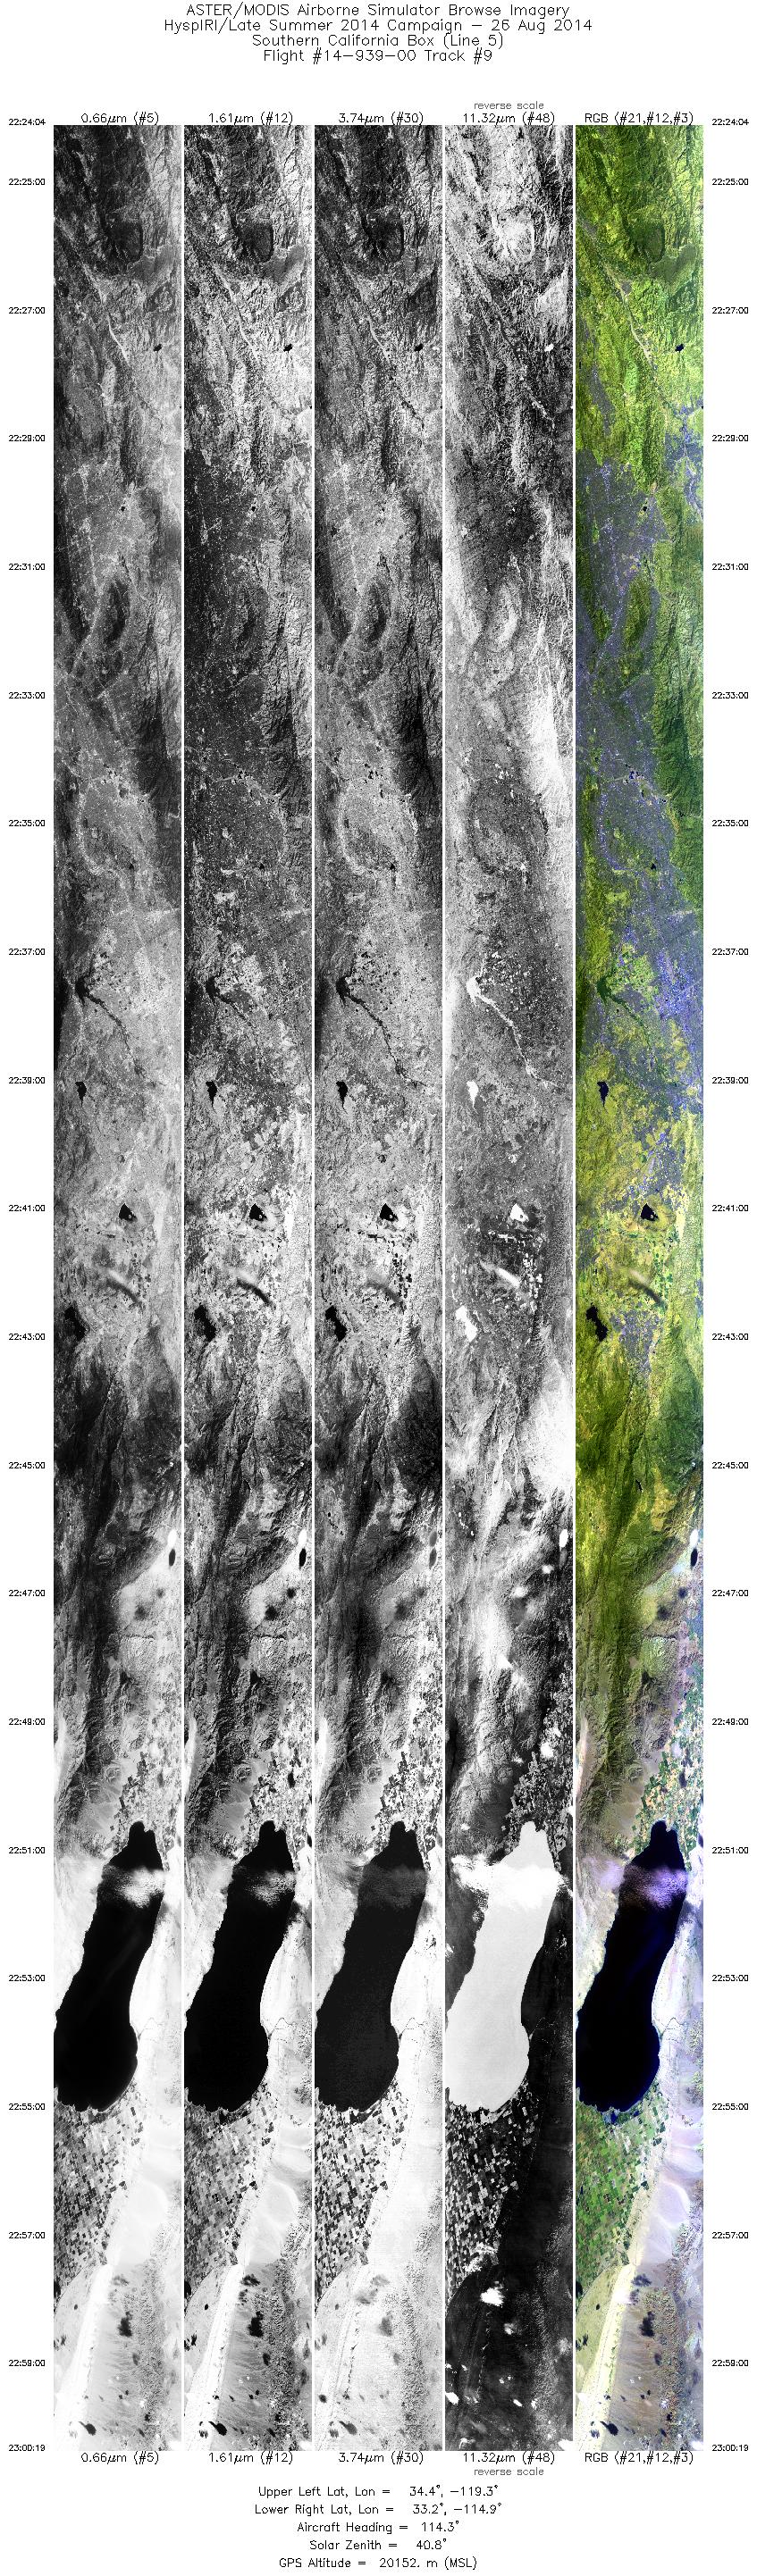
| 9 |
22:24 - 23:00 |
112.3 |
34.531 - 33.043 |
119.215 - 114.985 |
13021 |
20146 |
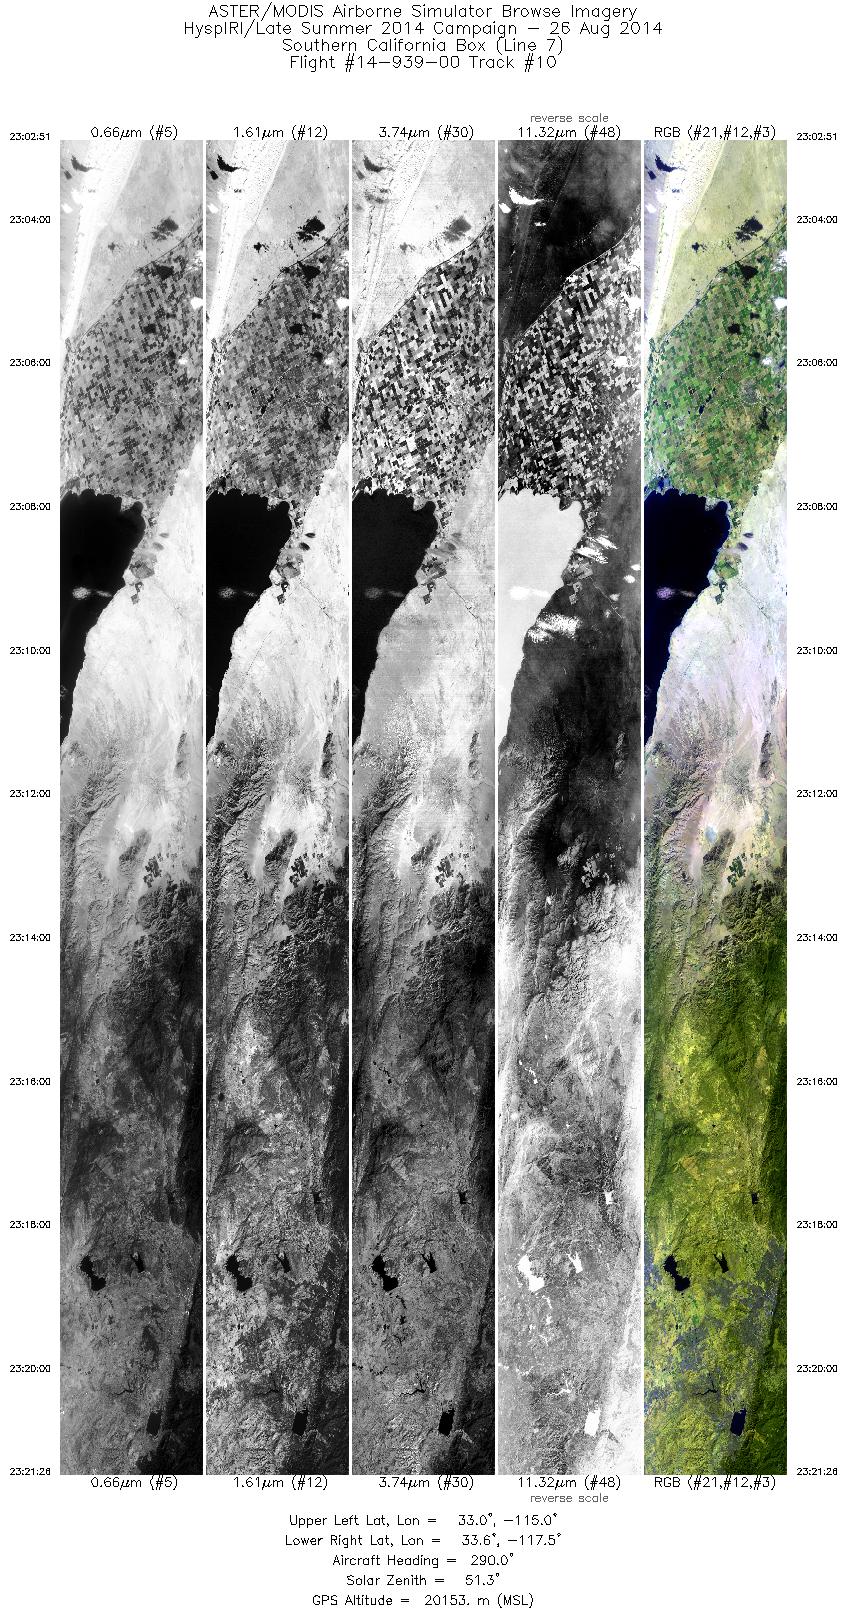
| 10 |
23:02 - 23:21 |
291.3 |
32.881 - 33.733 |
115.063 - 117.427 |
6676 |
20164 |
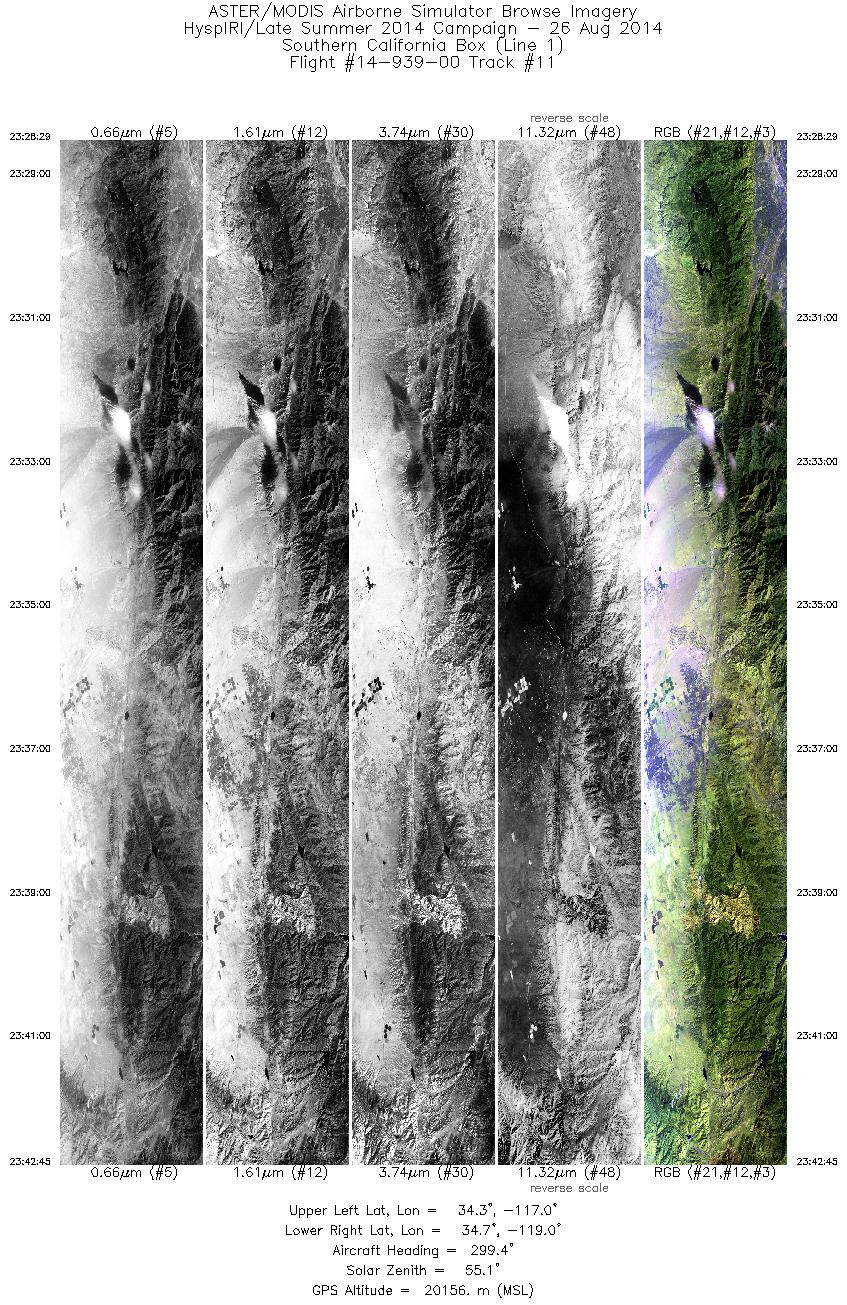
| 11 |
23:28 - 23:42 |
296.2 |
34.191 - 34.807 |
117.108 - 118.918 |
5126 |
20161 |
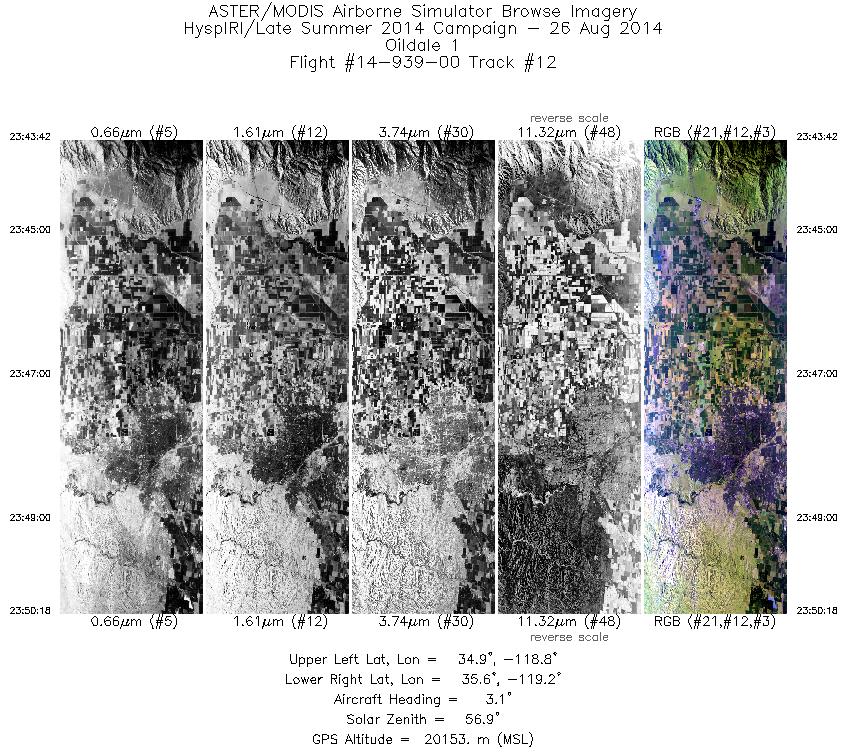
| 12 |
23:43 - 23:50 |
358.5 |
34.887 - 35.609 |
118.987 - 119.022 |
2372 |
20168 |
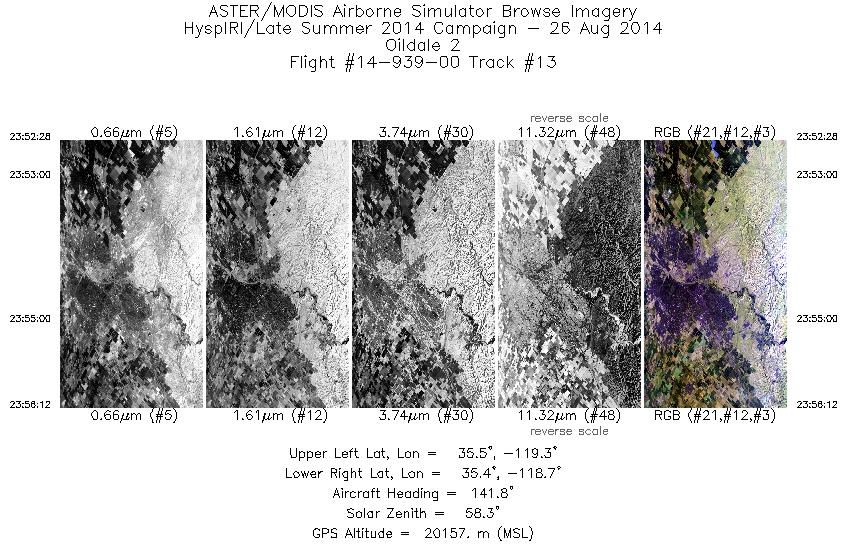
| 13 |
23:52 - 23:56 |
140.0 |
35.583 - 35.272 |
119.168 - 118.841 |
1340 |
20191 |
|


