


FLIGHT SUMMARY INFORMATION
Flight Track Map


|
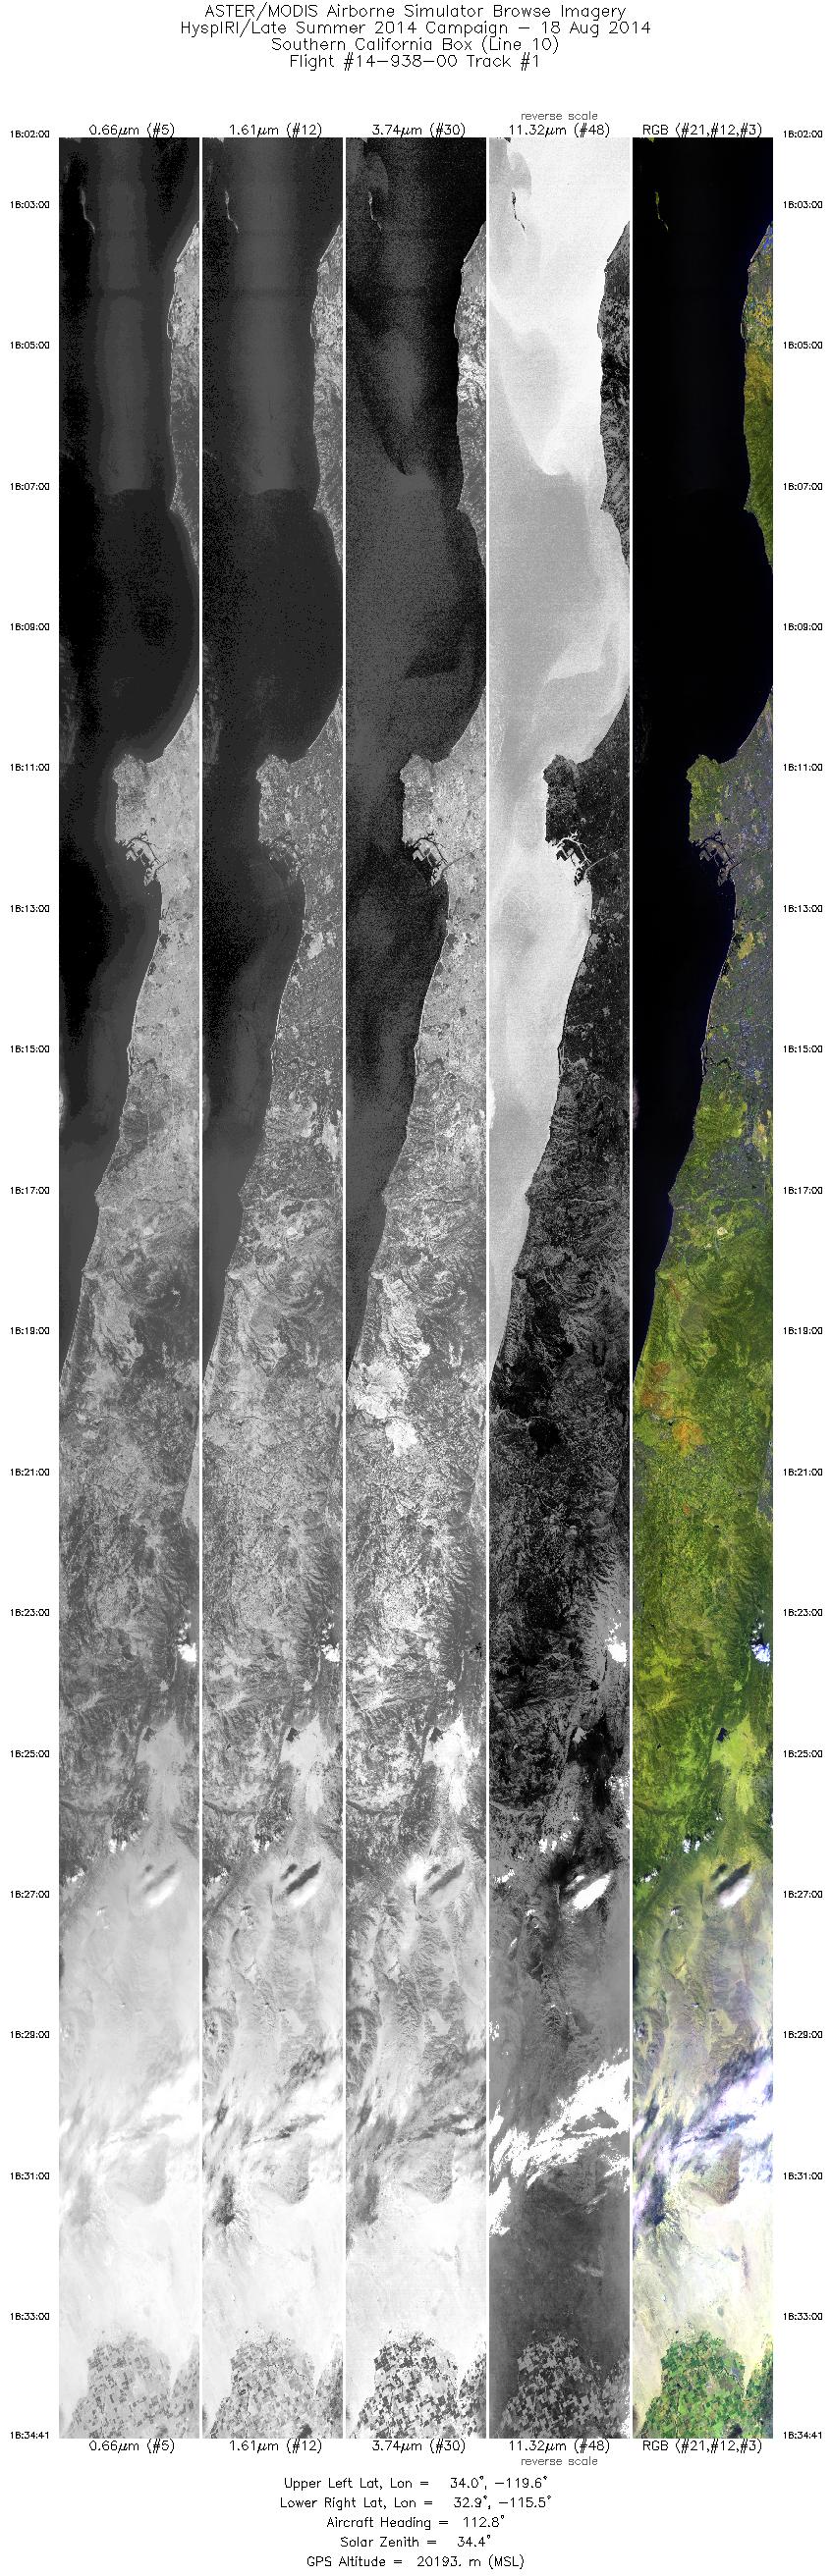
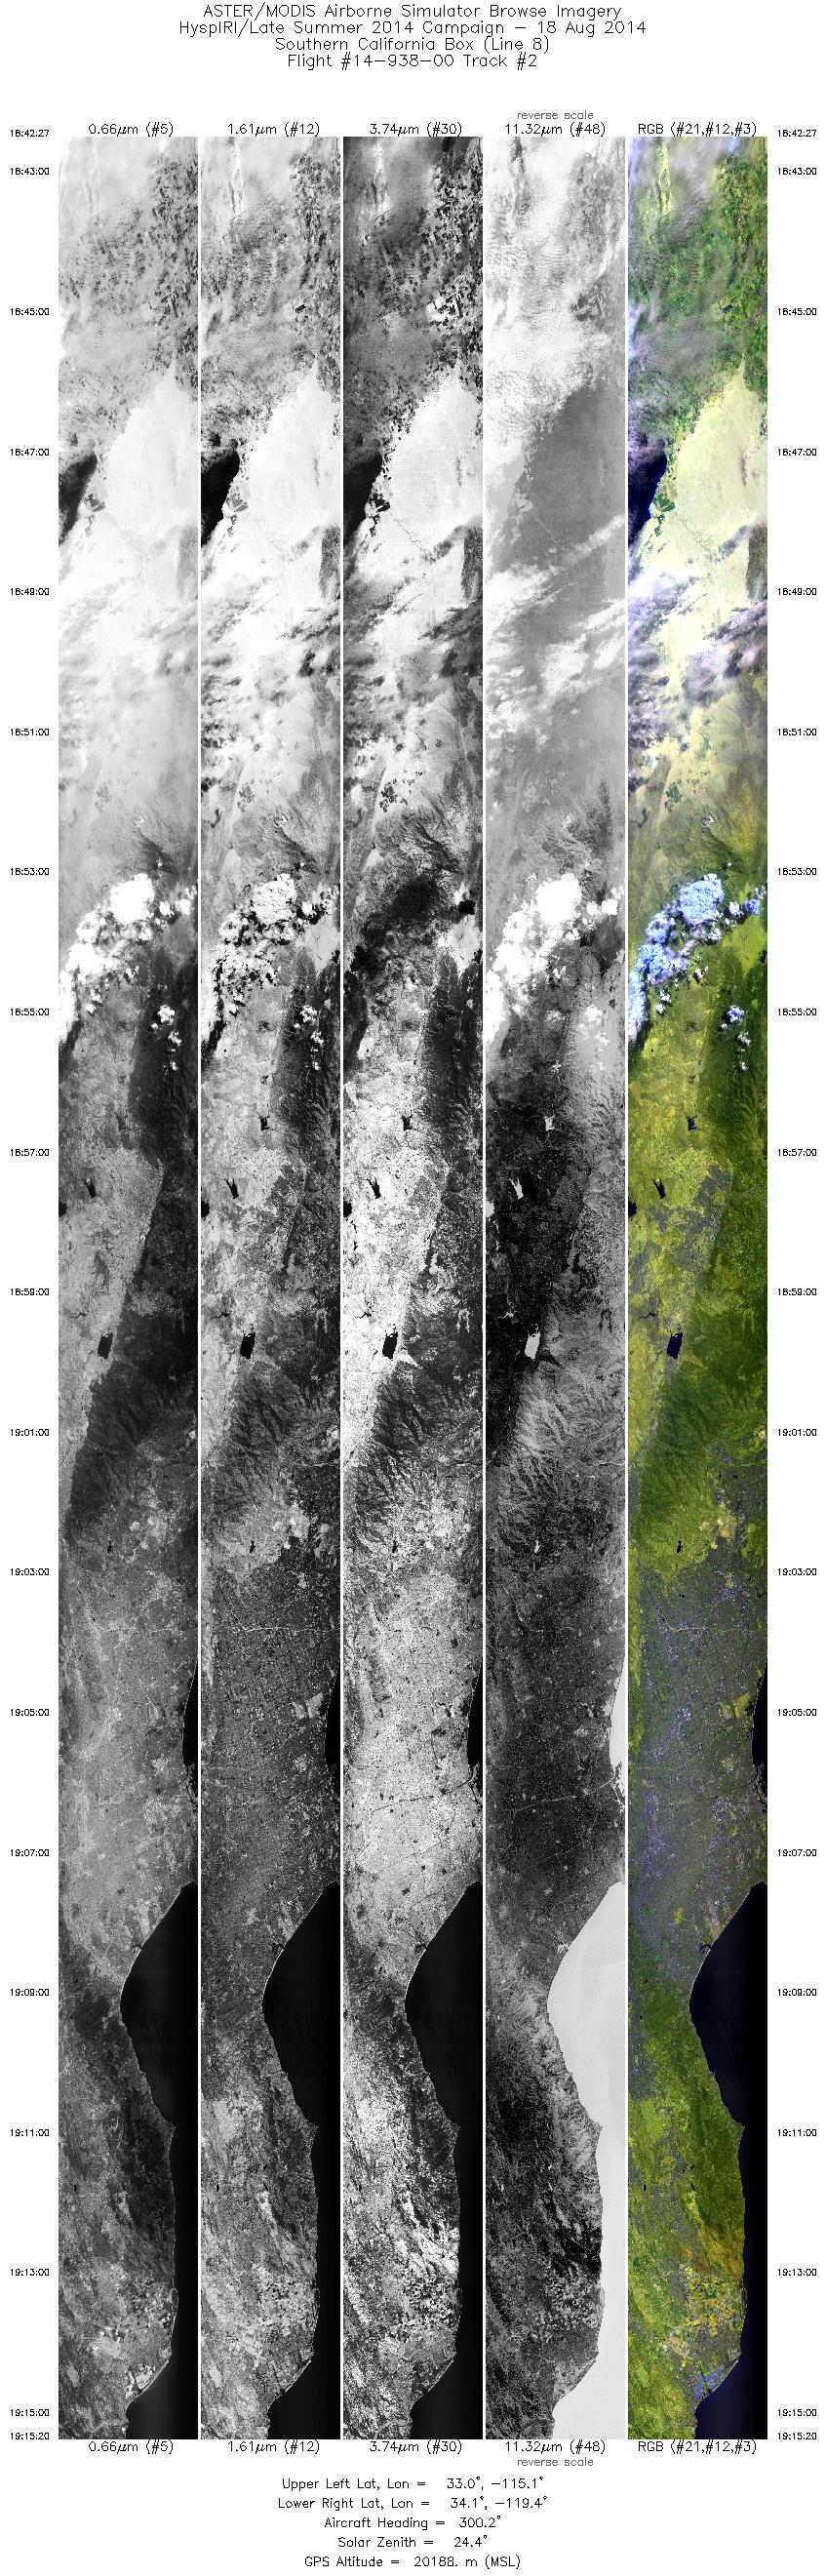
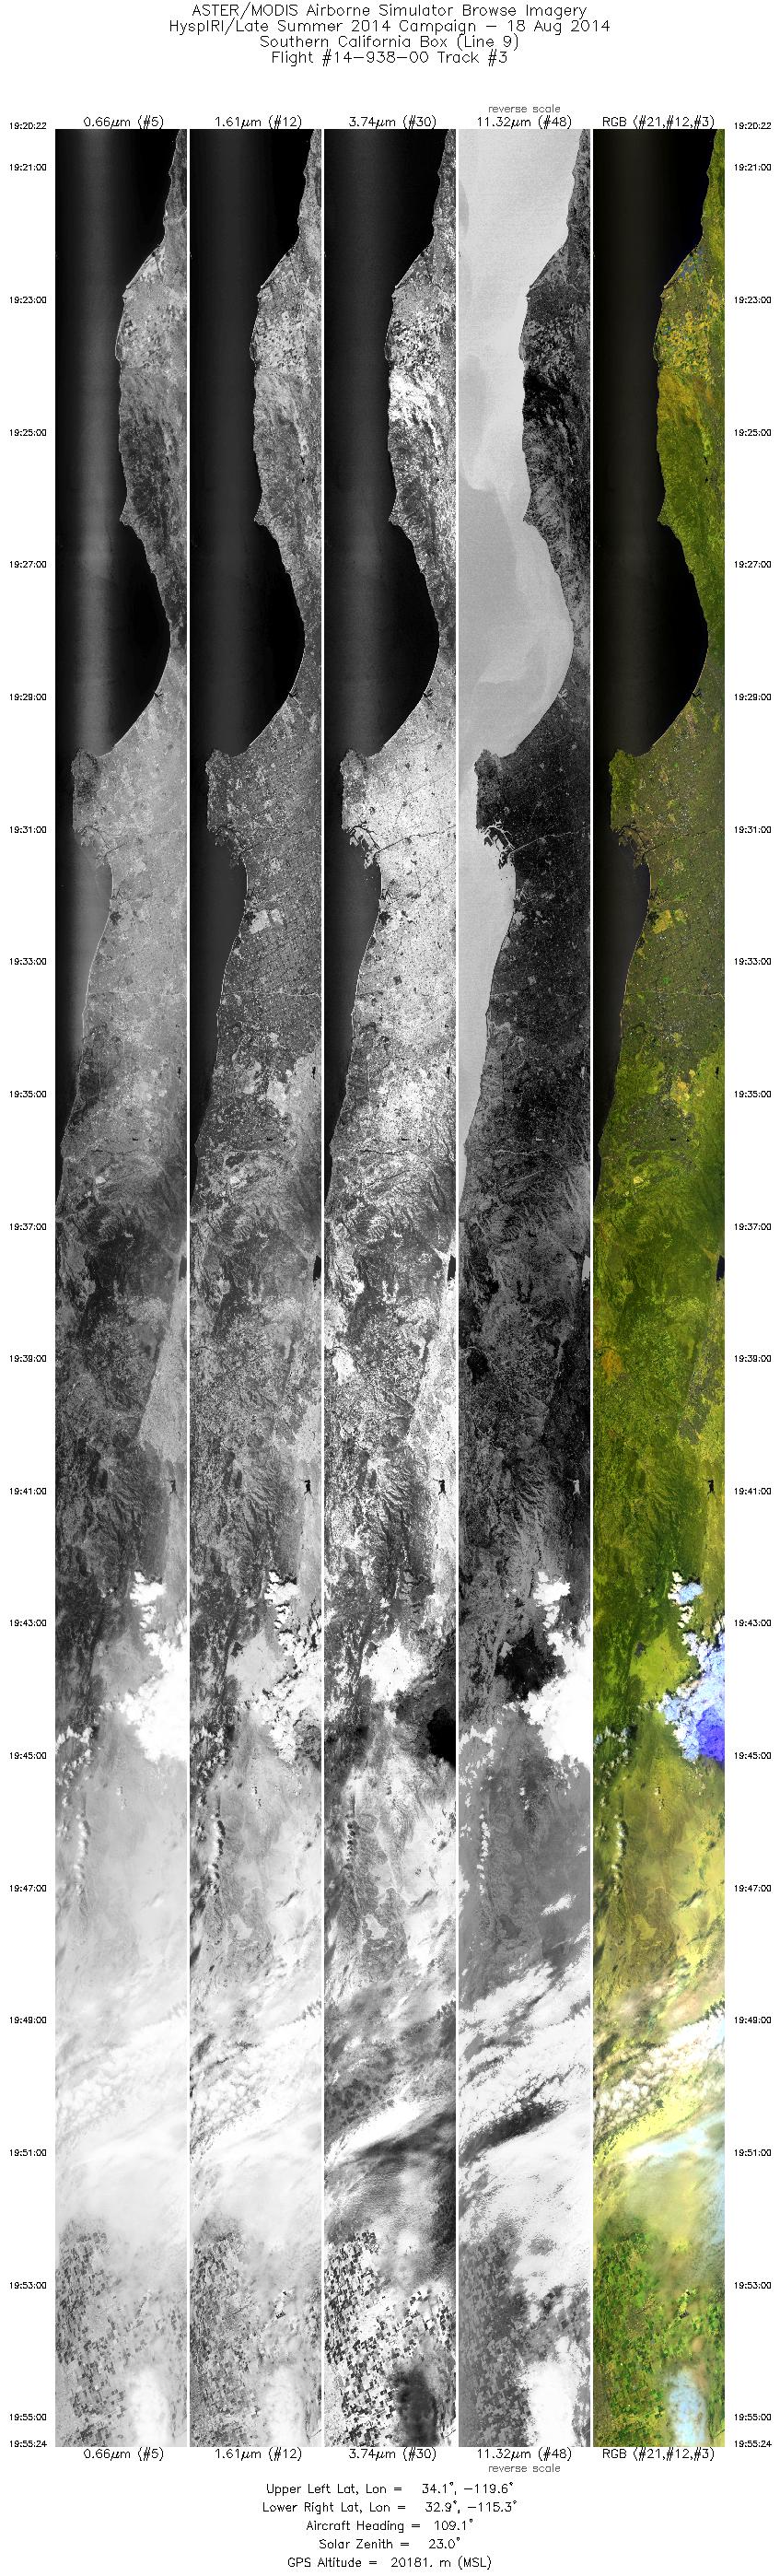
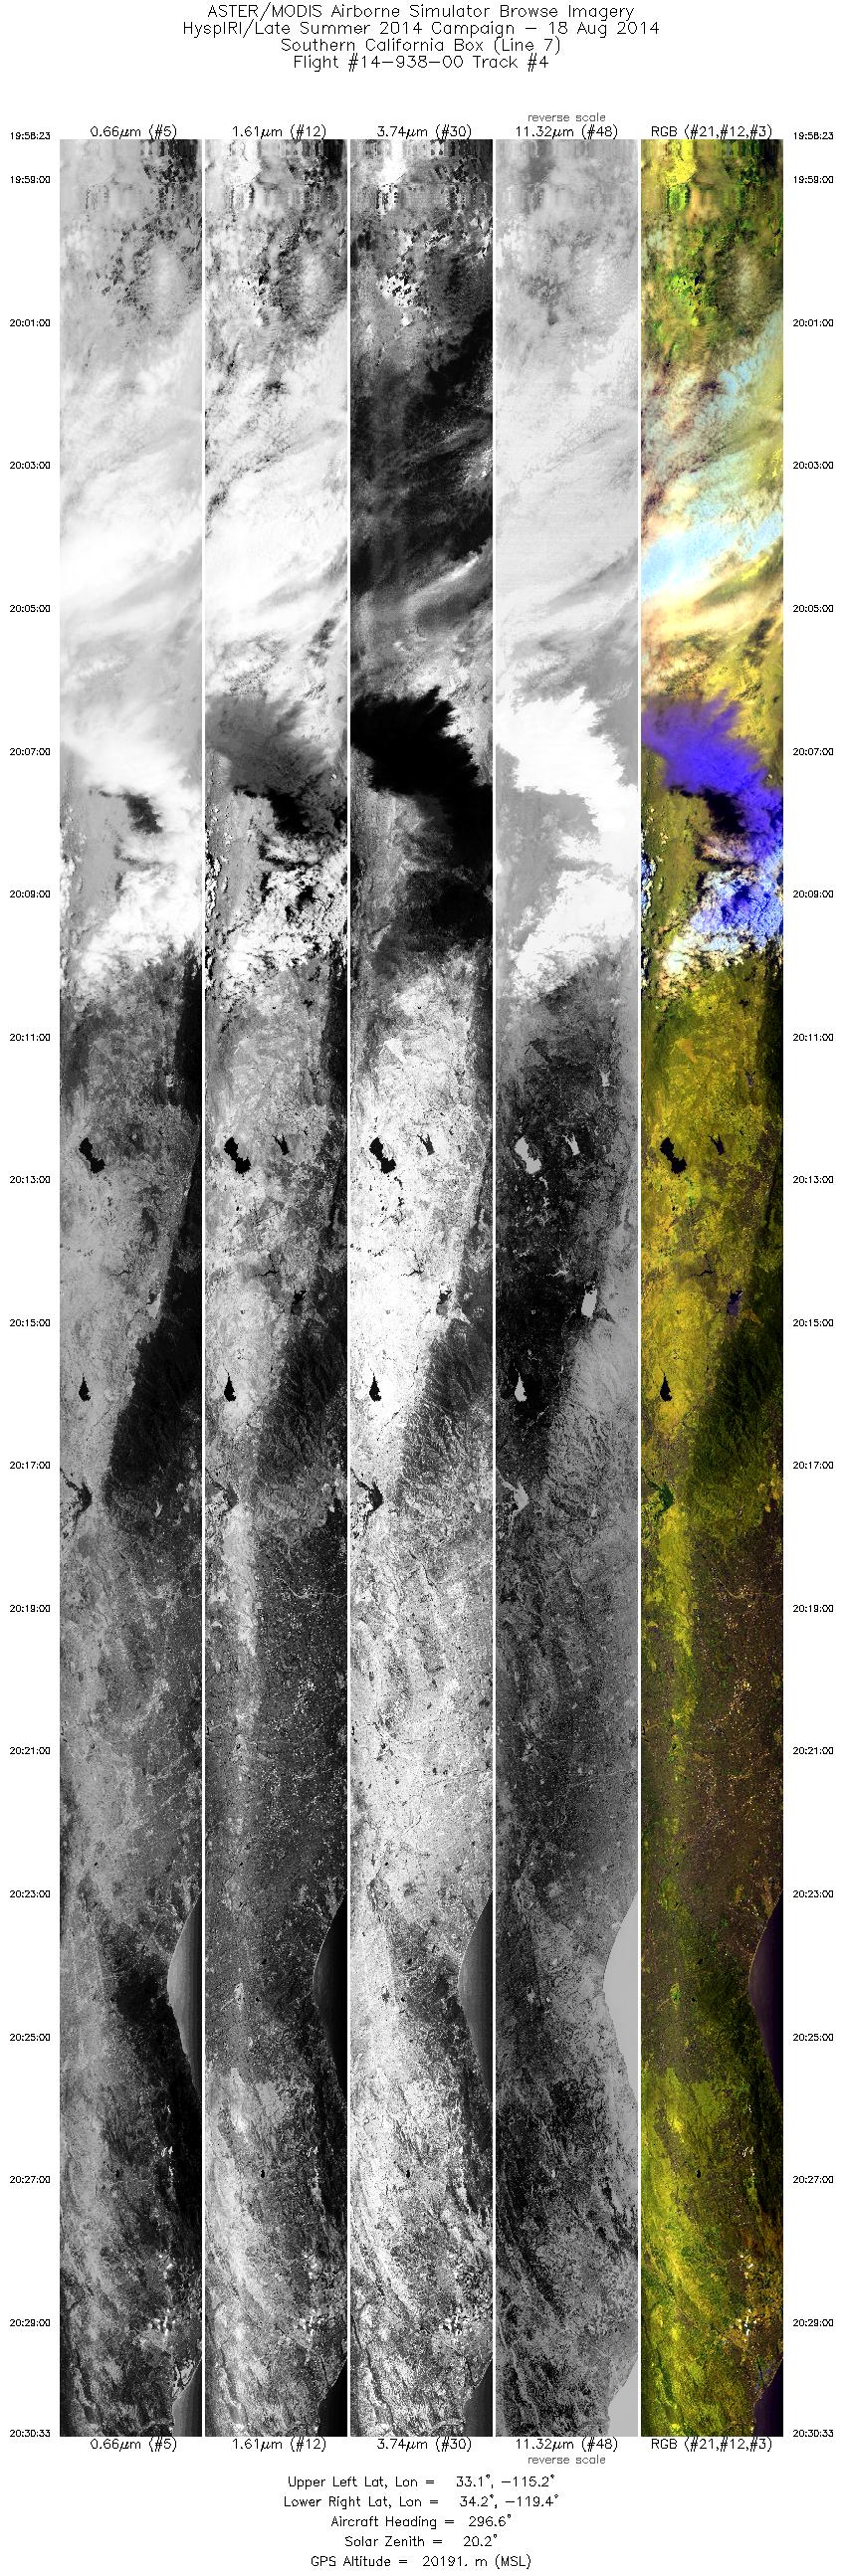
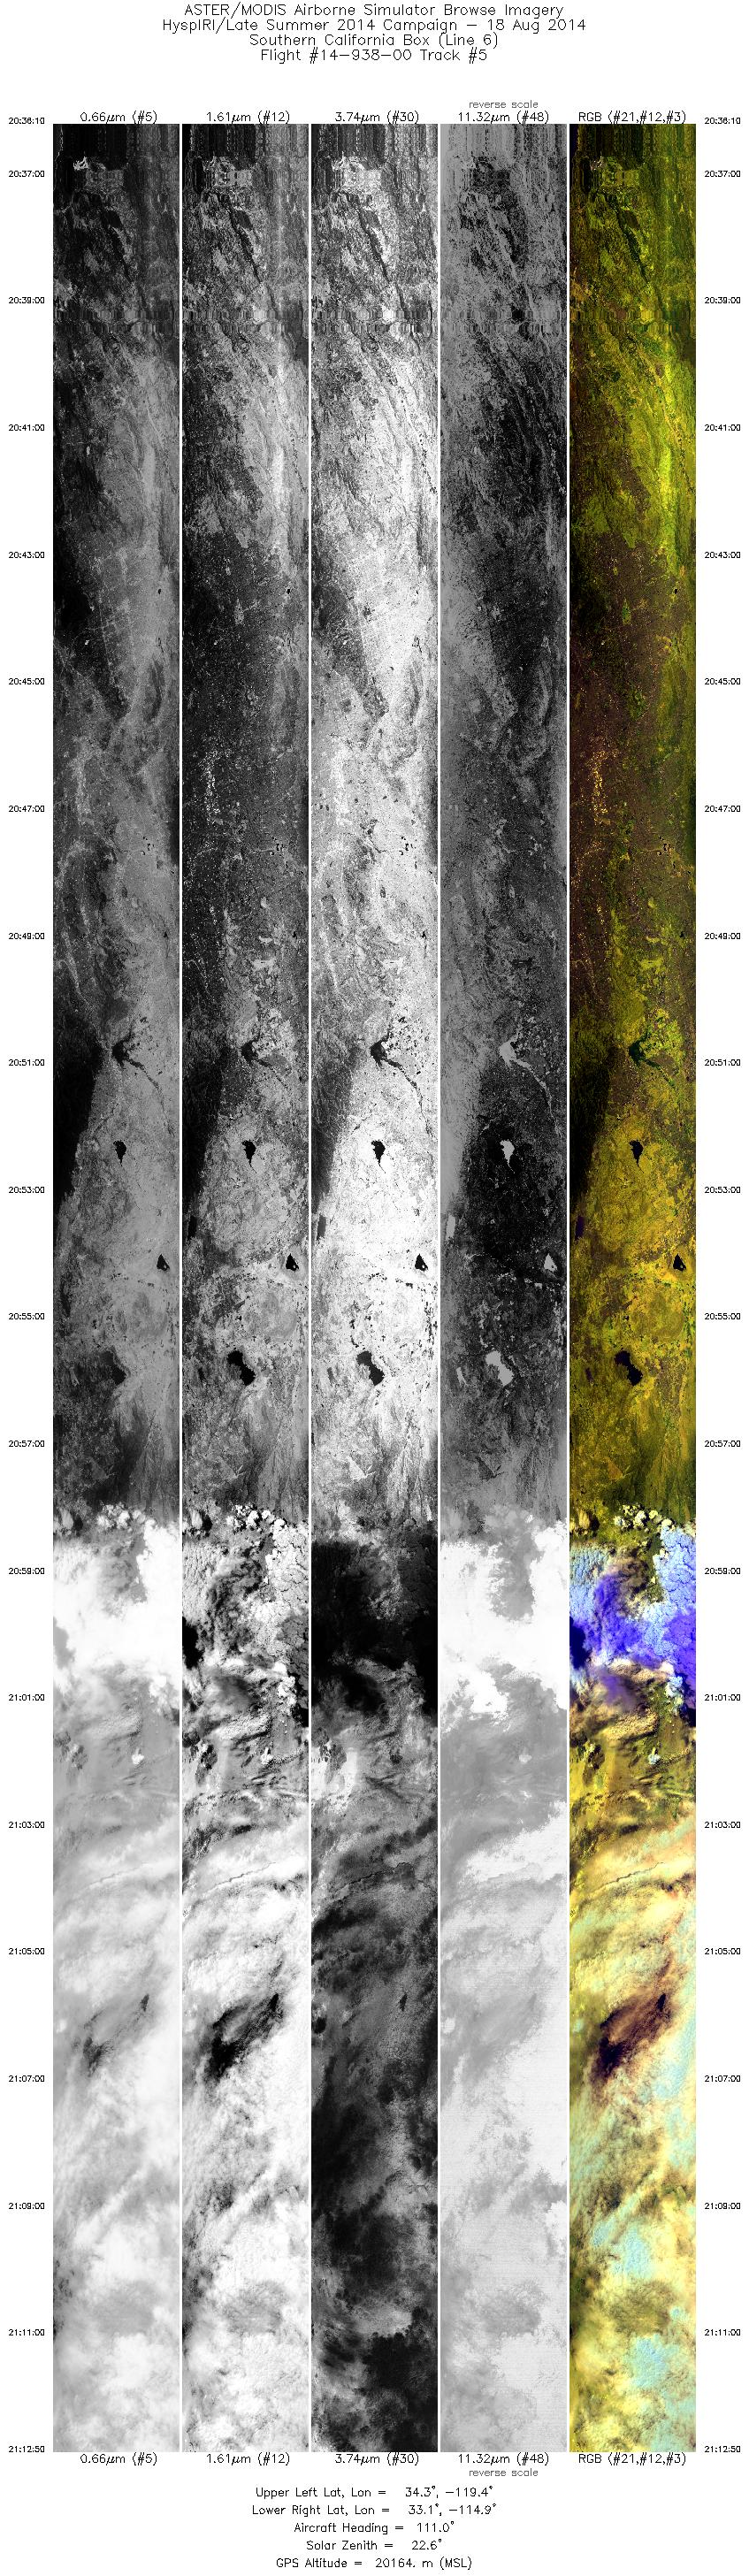
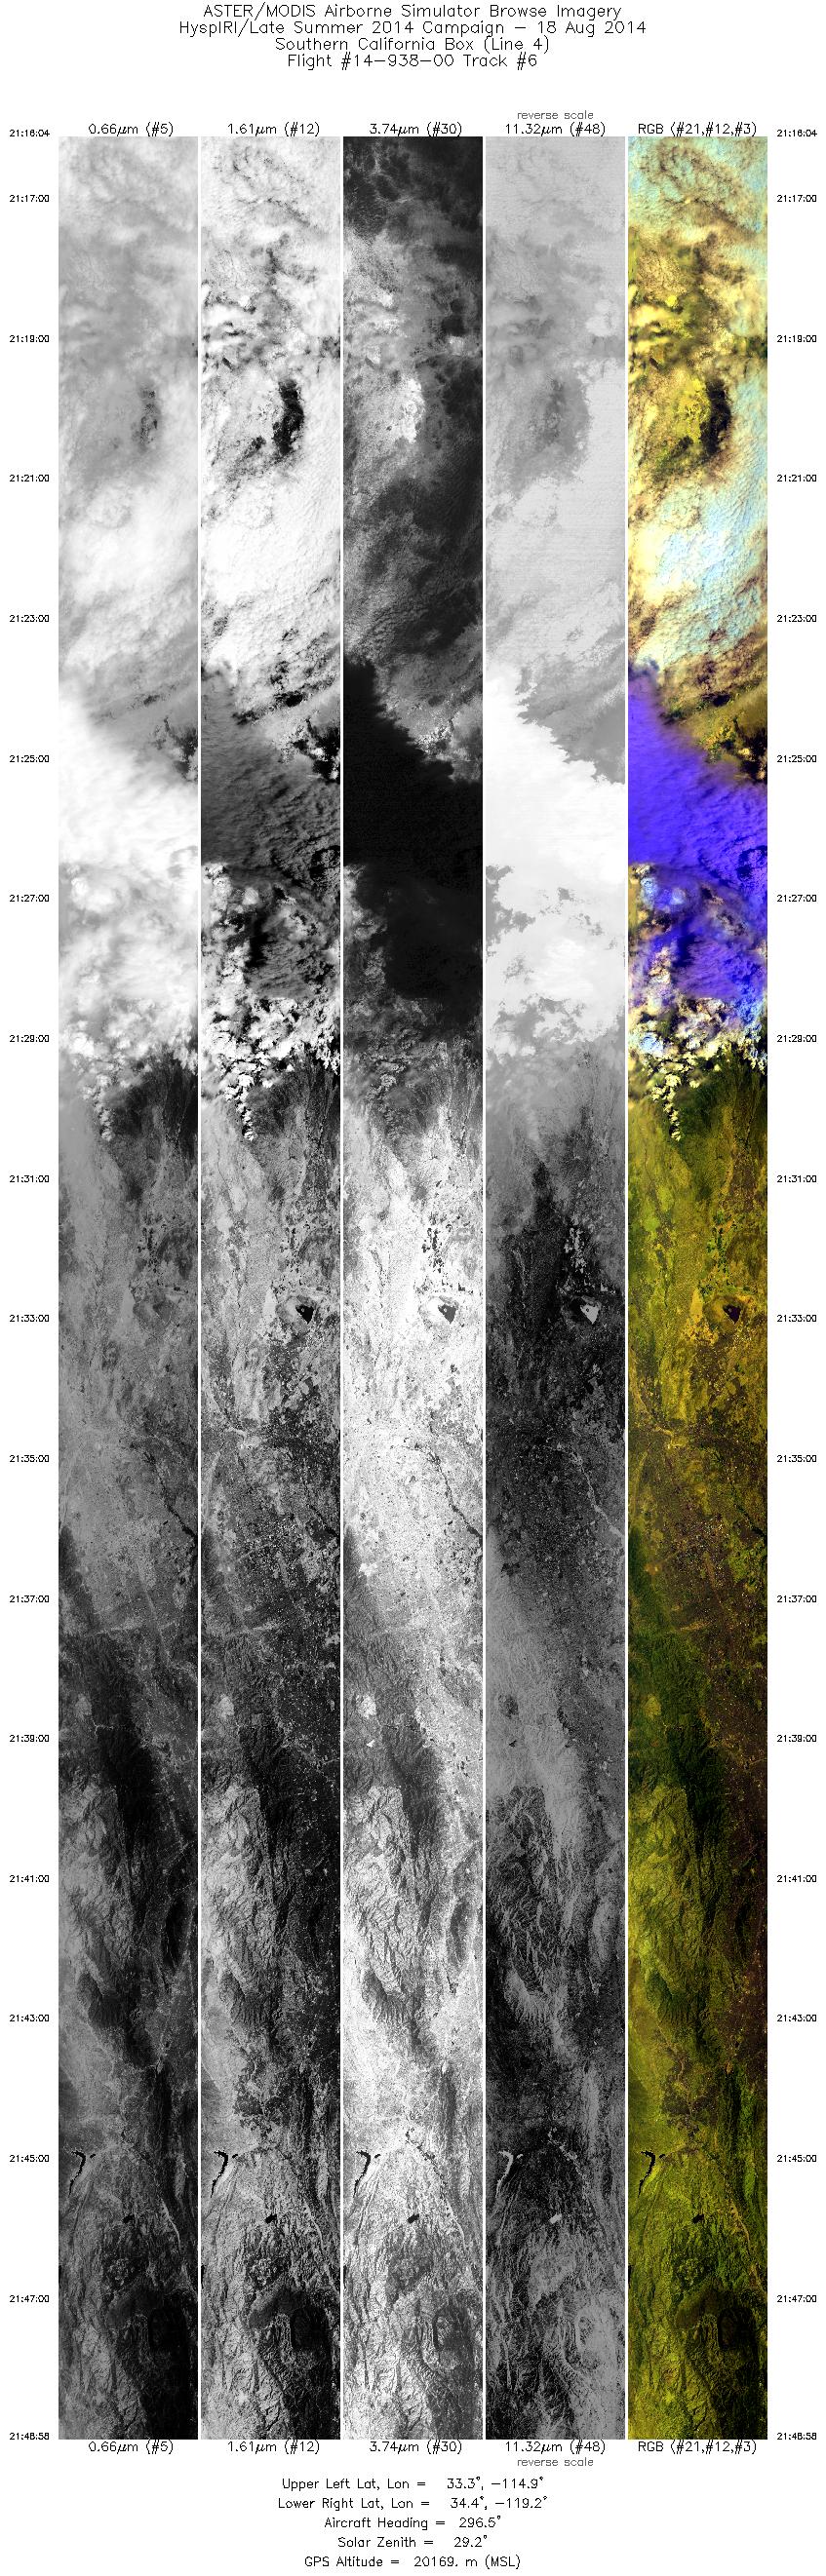
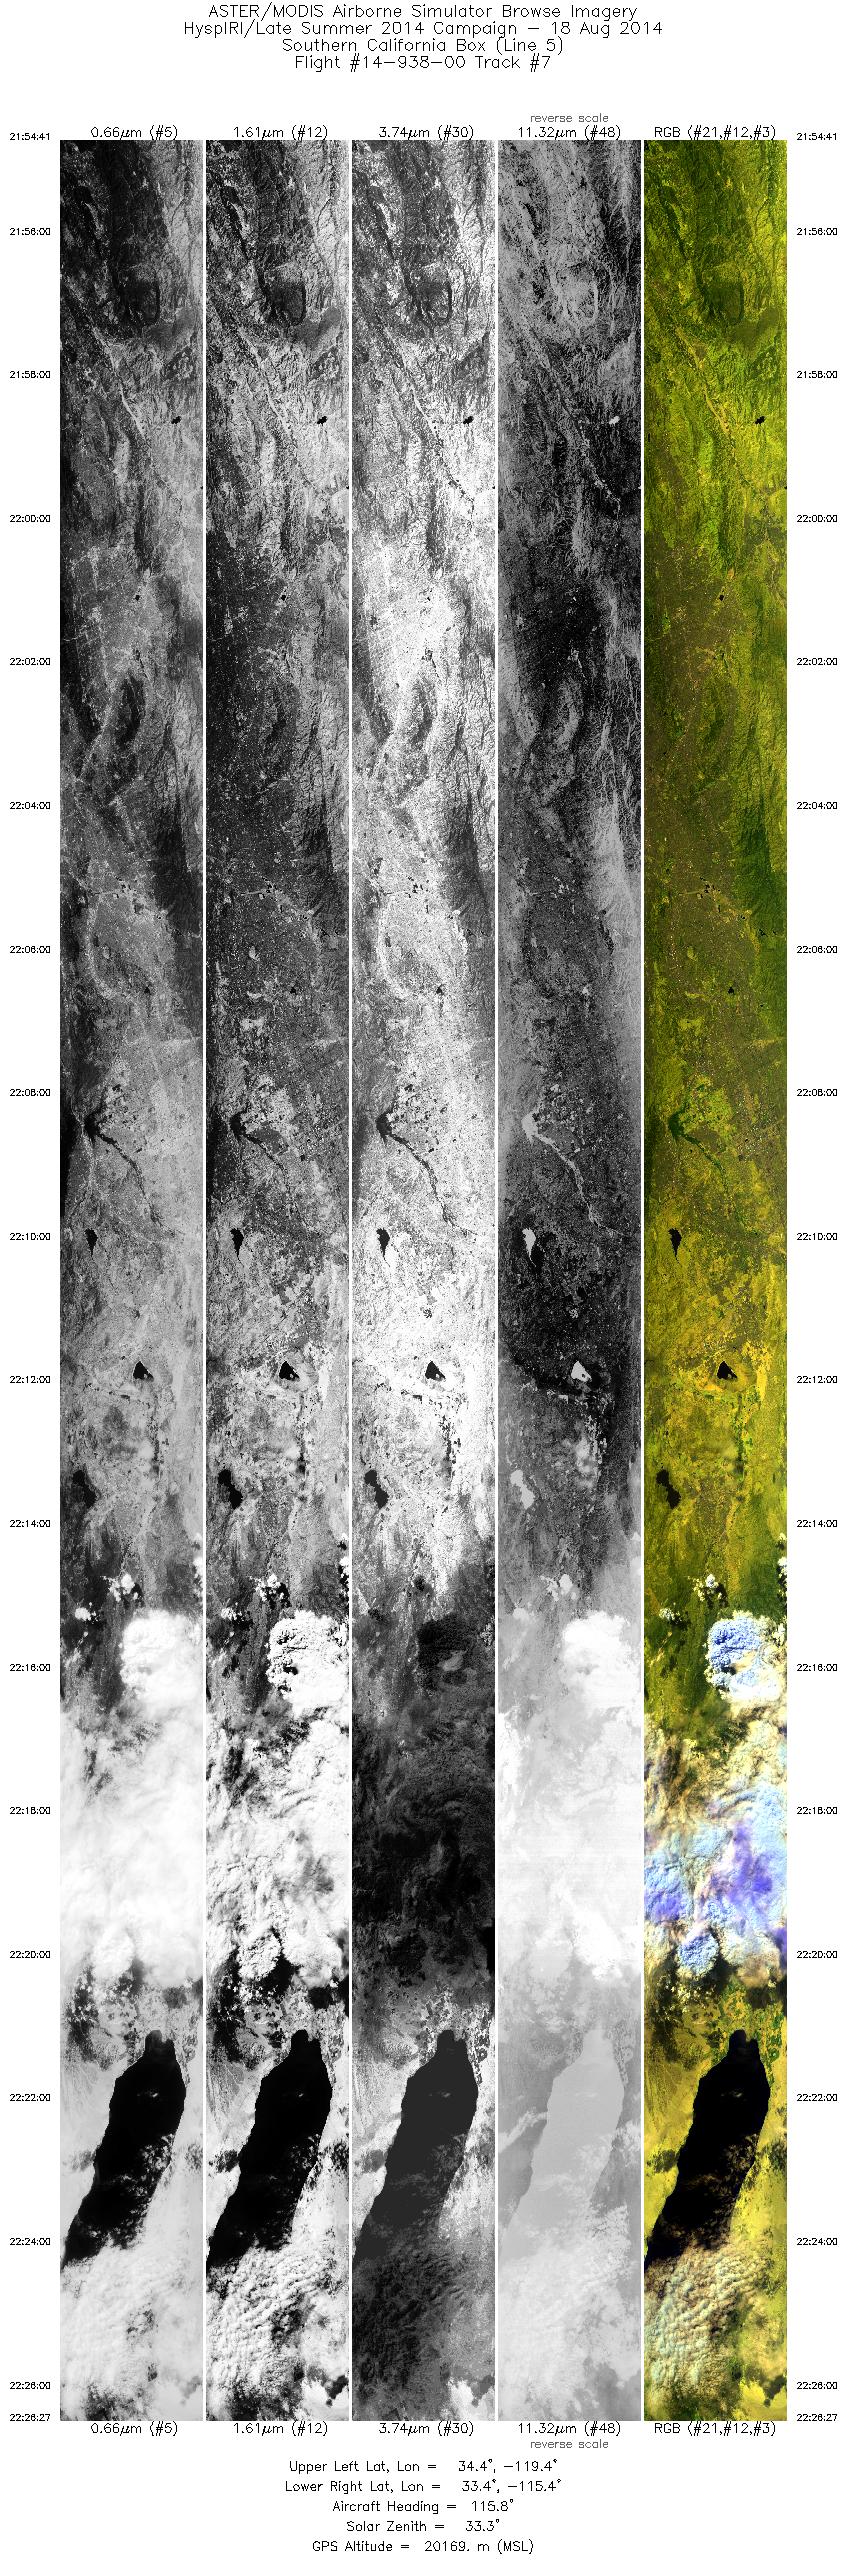
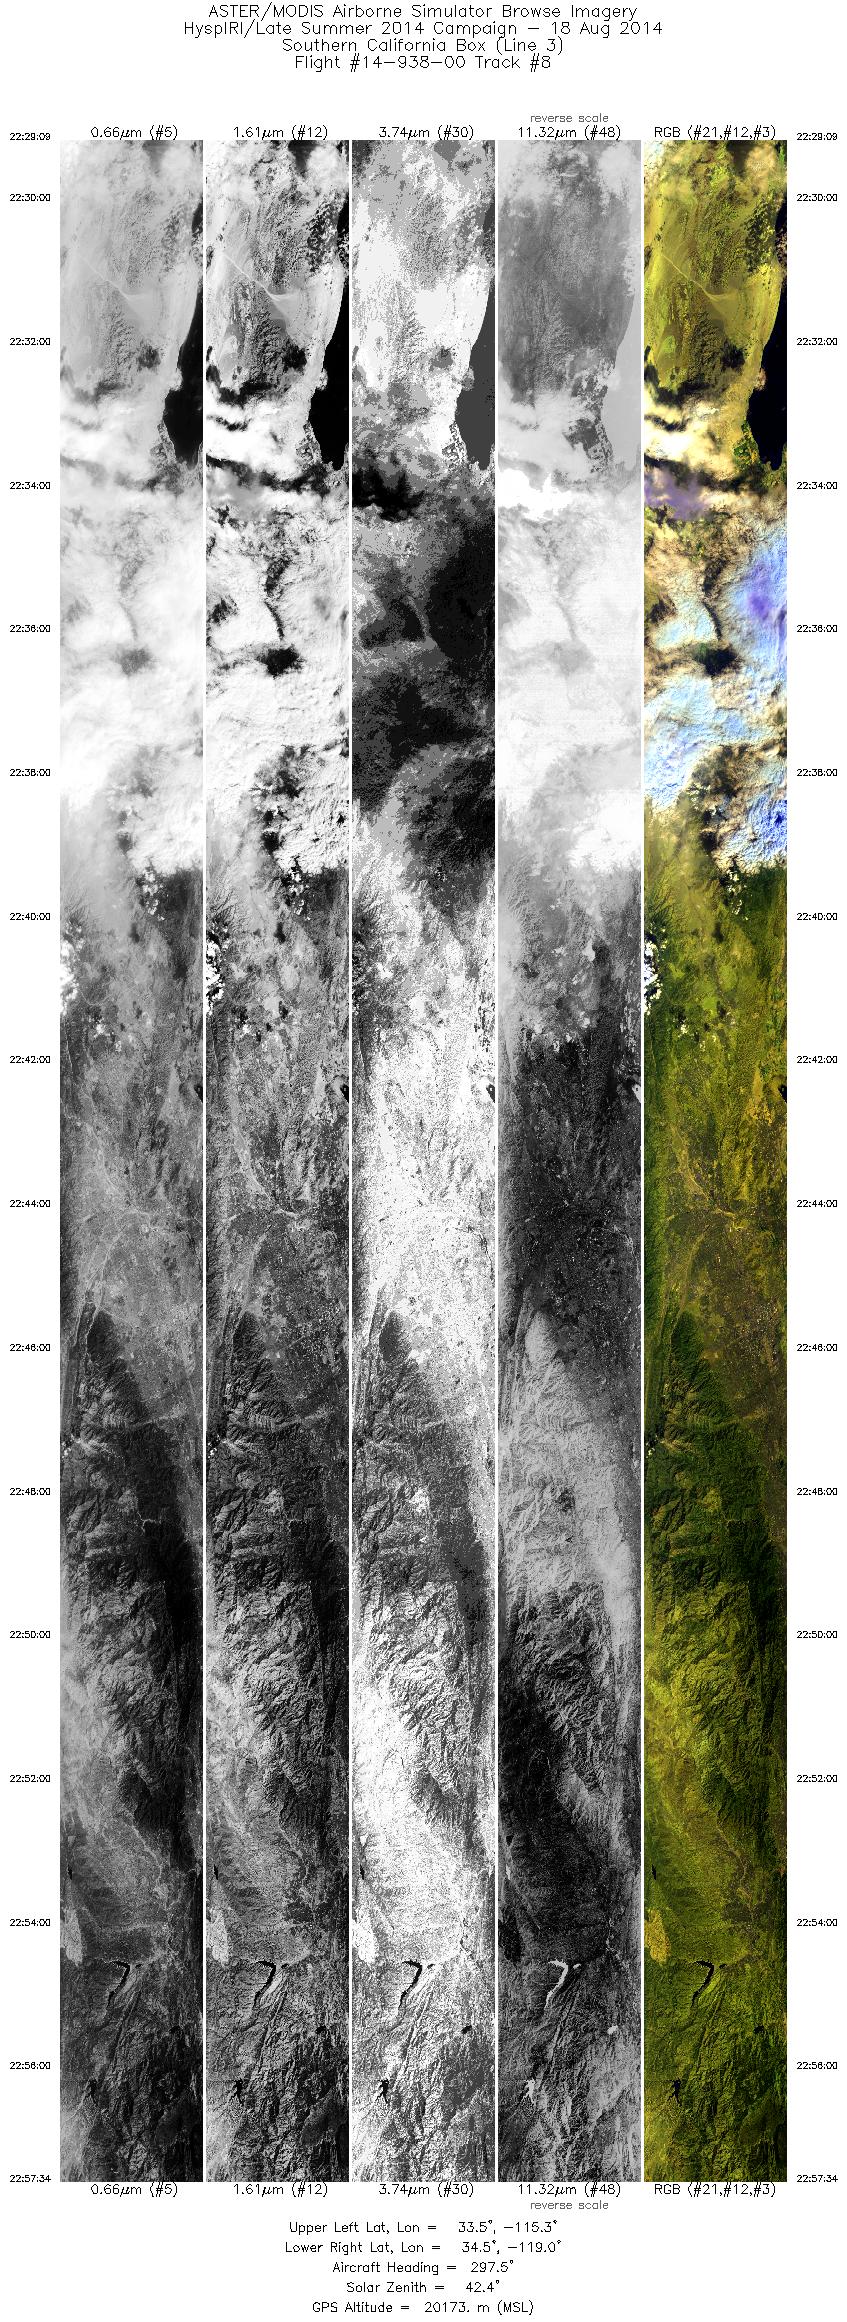
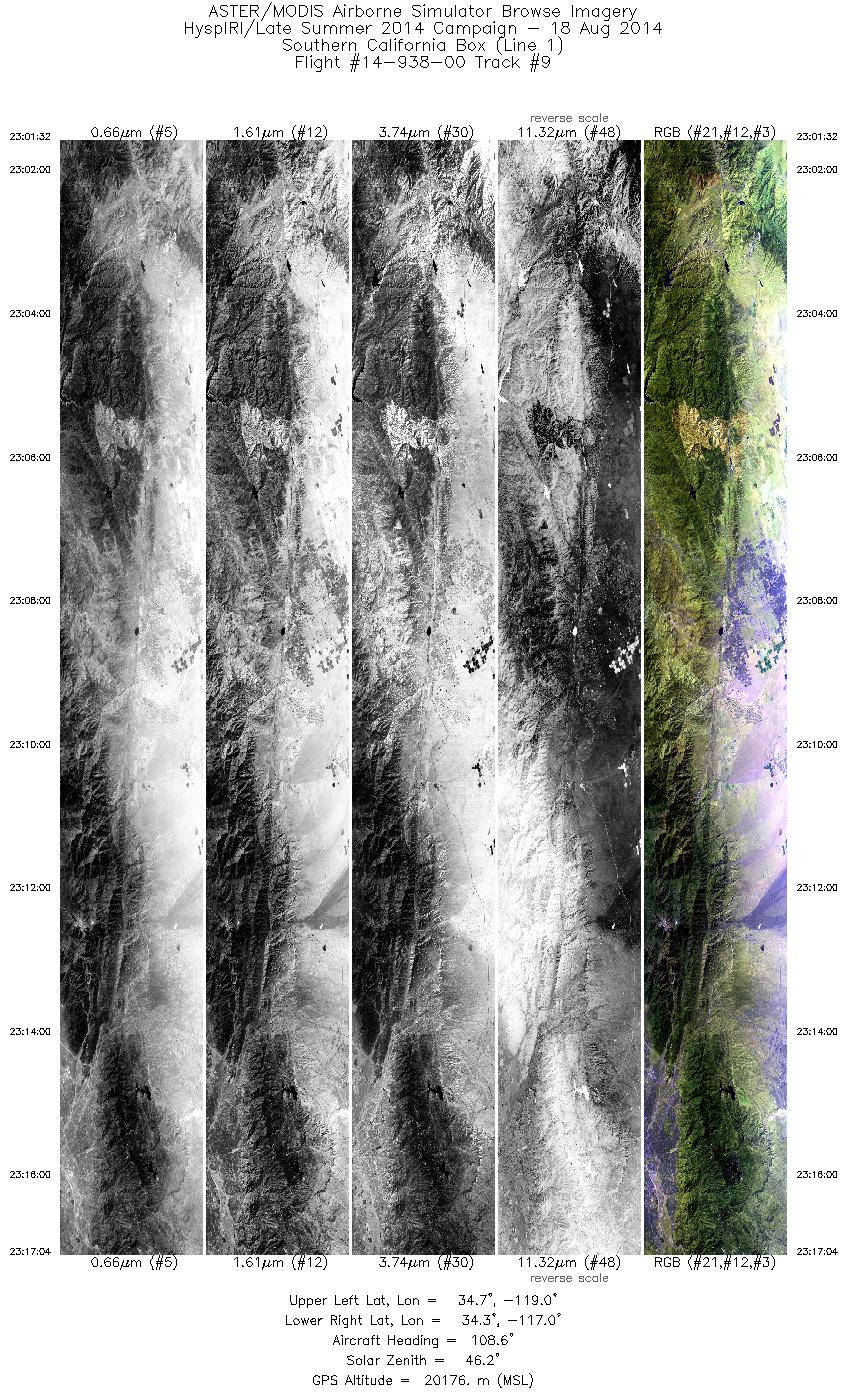
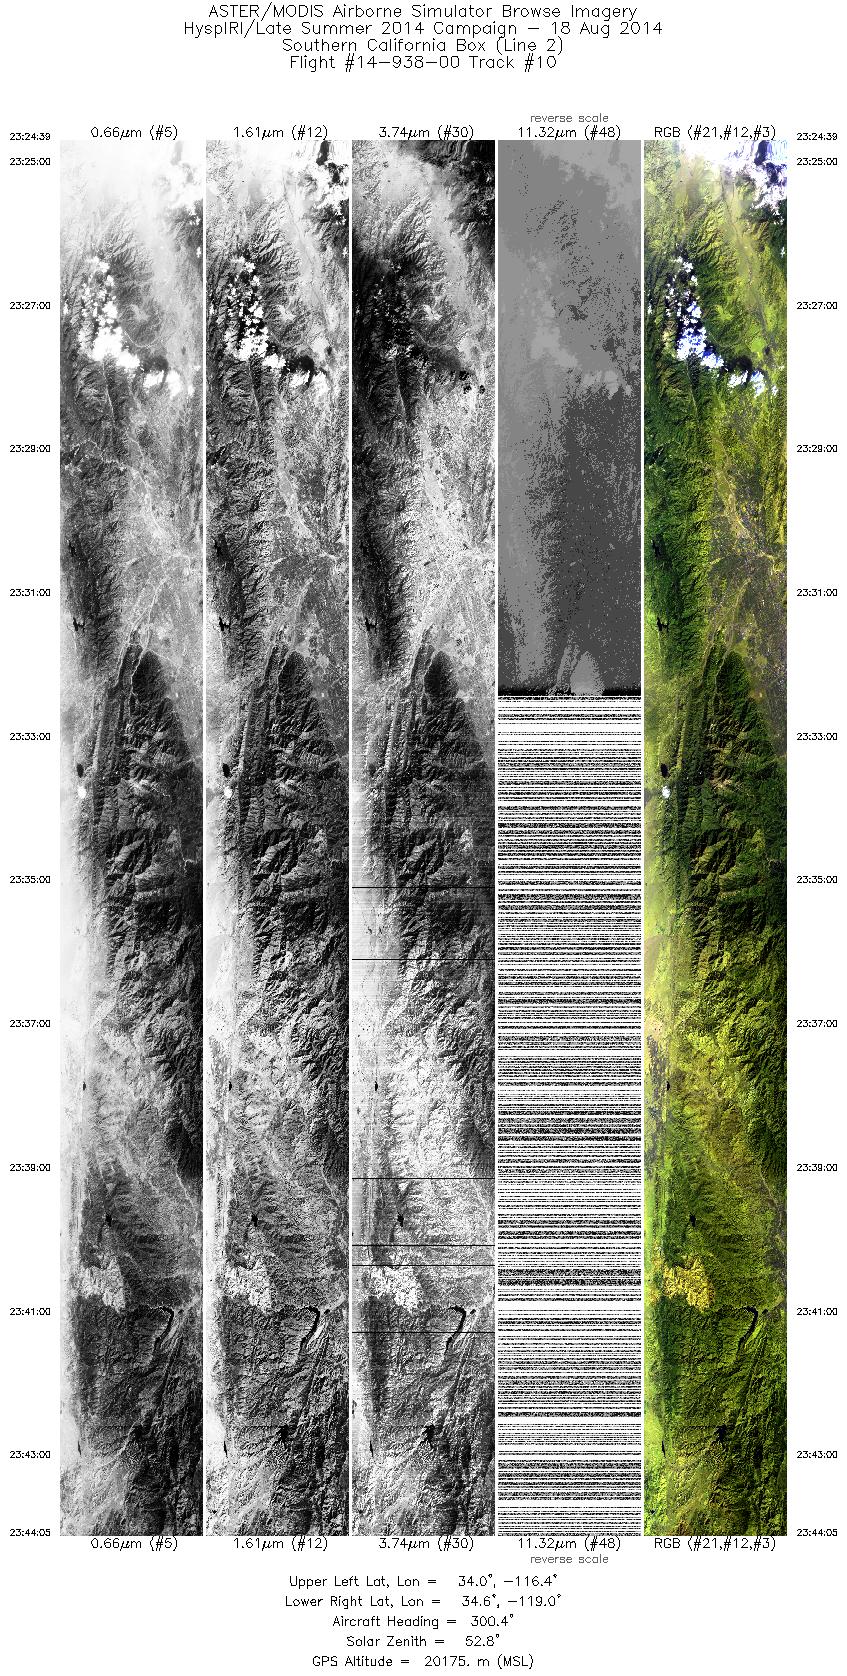
Flight: 14-938-00 Date: August 18, 2014 Aircraft: NASA ER-2, #809 Deployment: HyspIRI Summer 2014 Flight Location: Southern California Principal Investigator: Rob Green / Simon Hook (JPL) Additional Sensors: AVIRIS / RSP |
||||||||||||||||||||||||||||||||||||||||||||||||||||||||||||||||||||||||||||||||||||||||||||||||||
|
Data Evaluation Overall data quality is good All data collected @6.25Hz Loss of LN2 affected Port 4 IR data during last flight line |
||||||||||||||||||||||||||||||||||||||||||||||||||||||||||||||||||||||||||||||||||||||||||||||||||
|
Processing Information Level-1B Data in HDF format is available Flight Line Summary Spectral Band Configuration Spectral Response Function Table Spectral Response Function (text) |
||||||||||||||||||||||||||||||||||||||||||||||||||||||||||||||||||||||||||||||||||||||||||||||||||
|
Browse Imagery Flight Tracks: 10 Scanlines: 106821 |
||||||||||||||||||||||||||||||||||||||||||||||||||||||||||||||||||||||||||||||||||||||||||||||||||
|
||||||||||||||||||||||||||||||||||||||||||||||||||||||||||||||||||||||||||||||||||||||||||||||||||


