


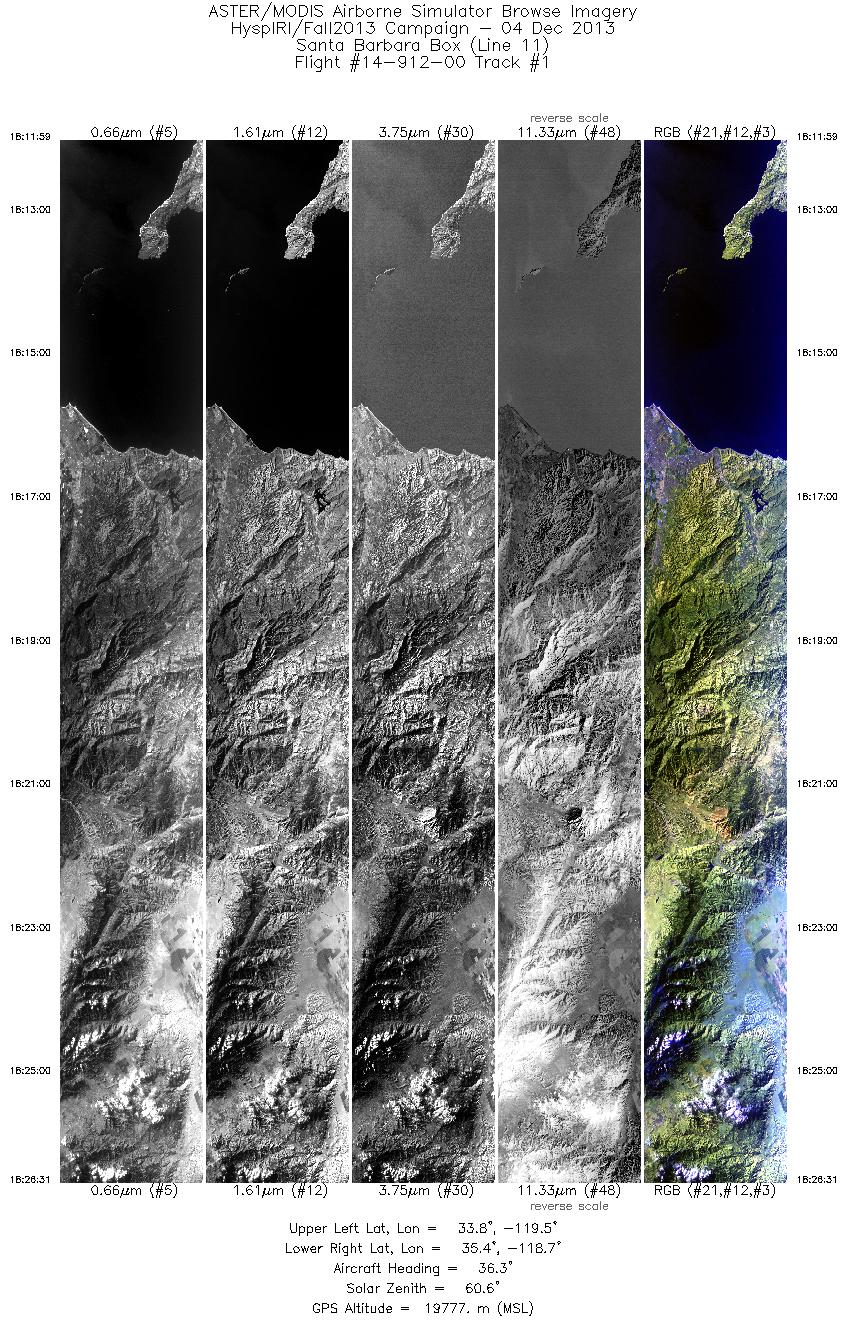
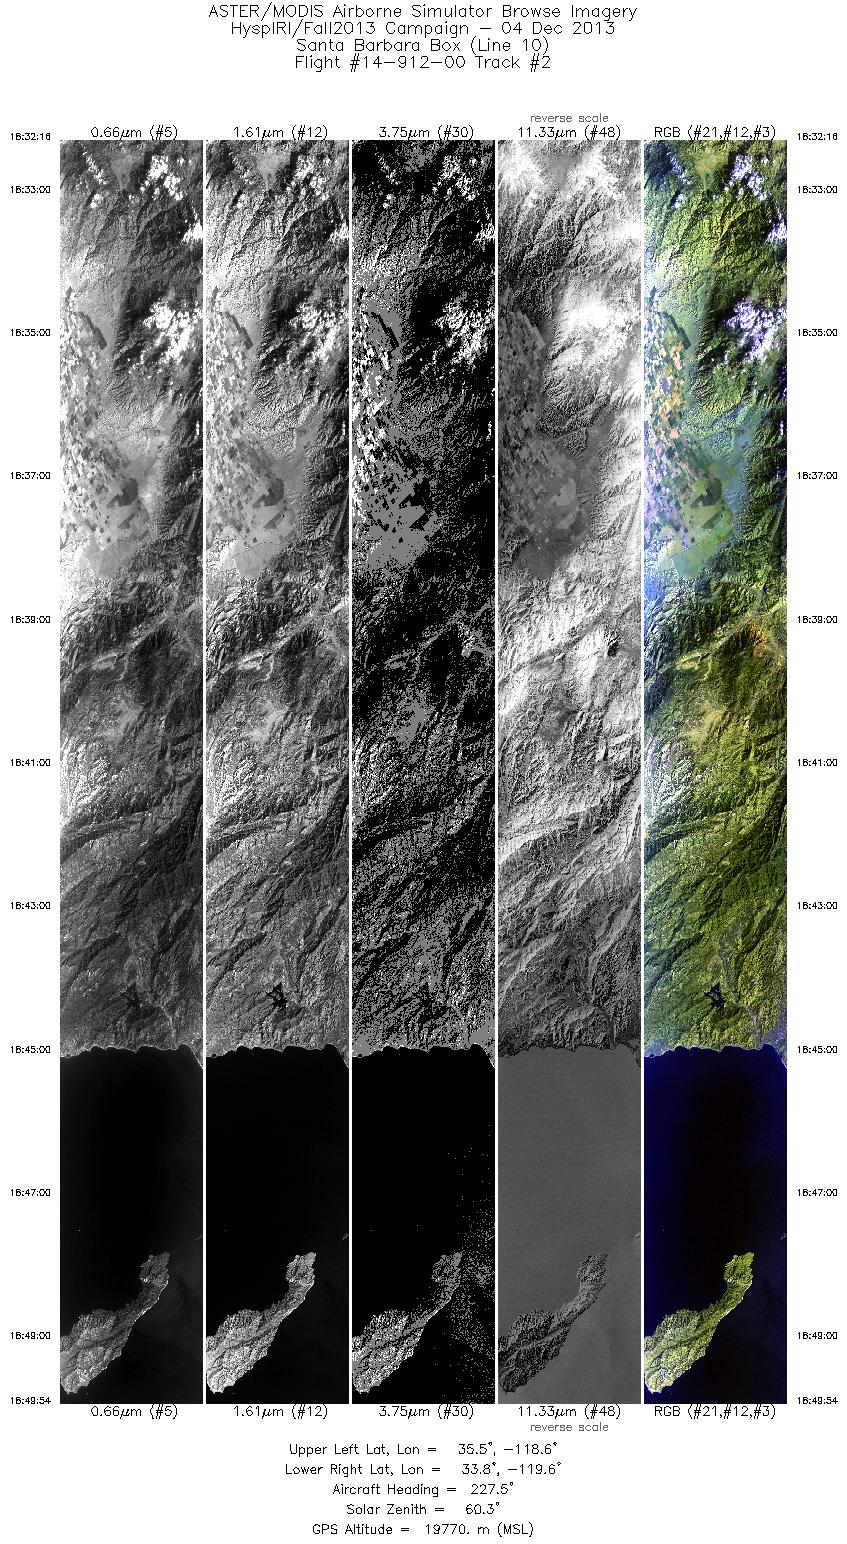
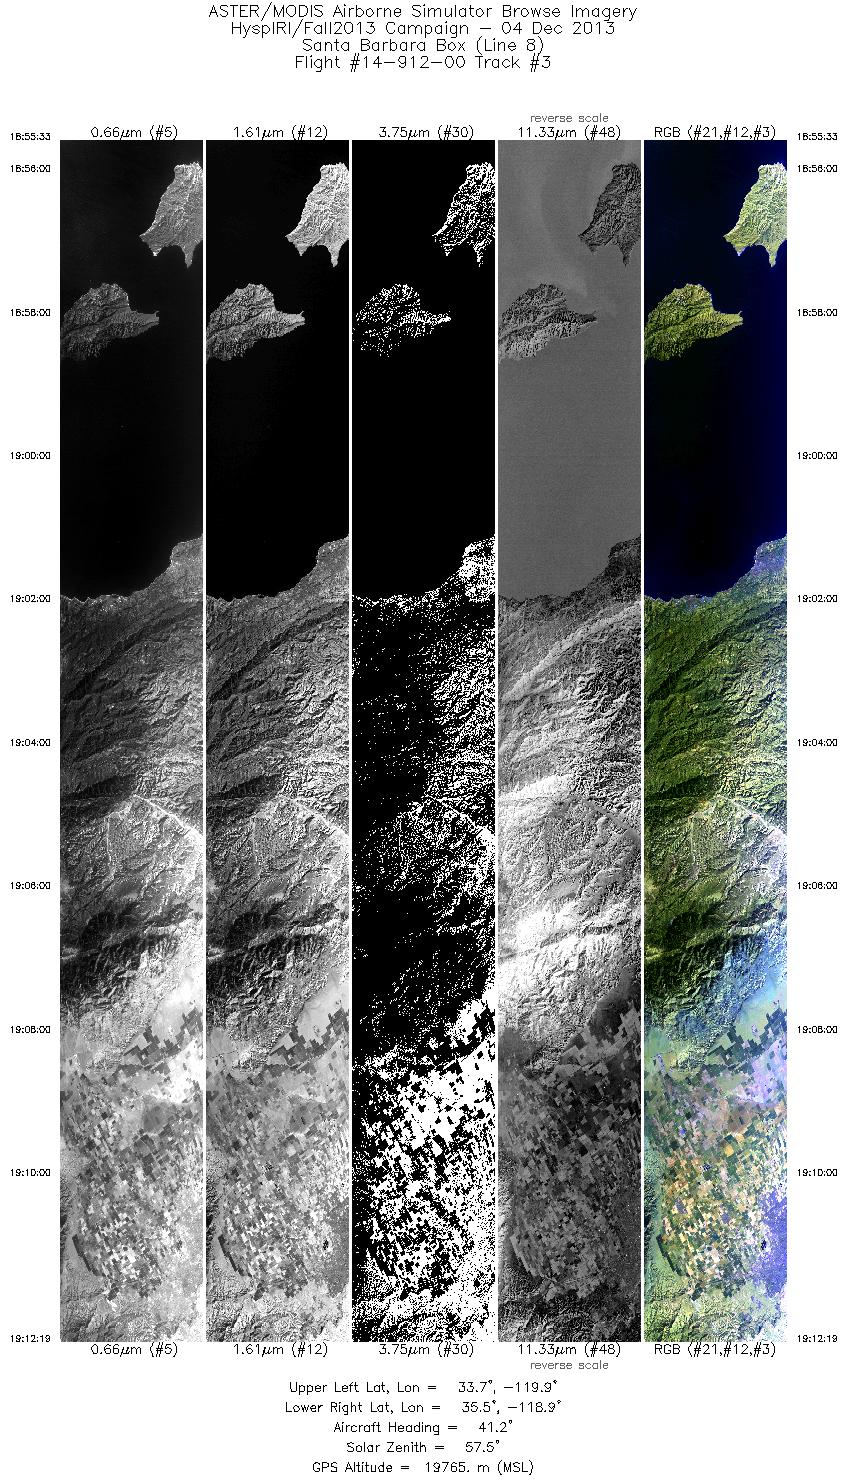
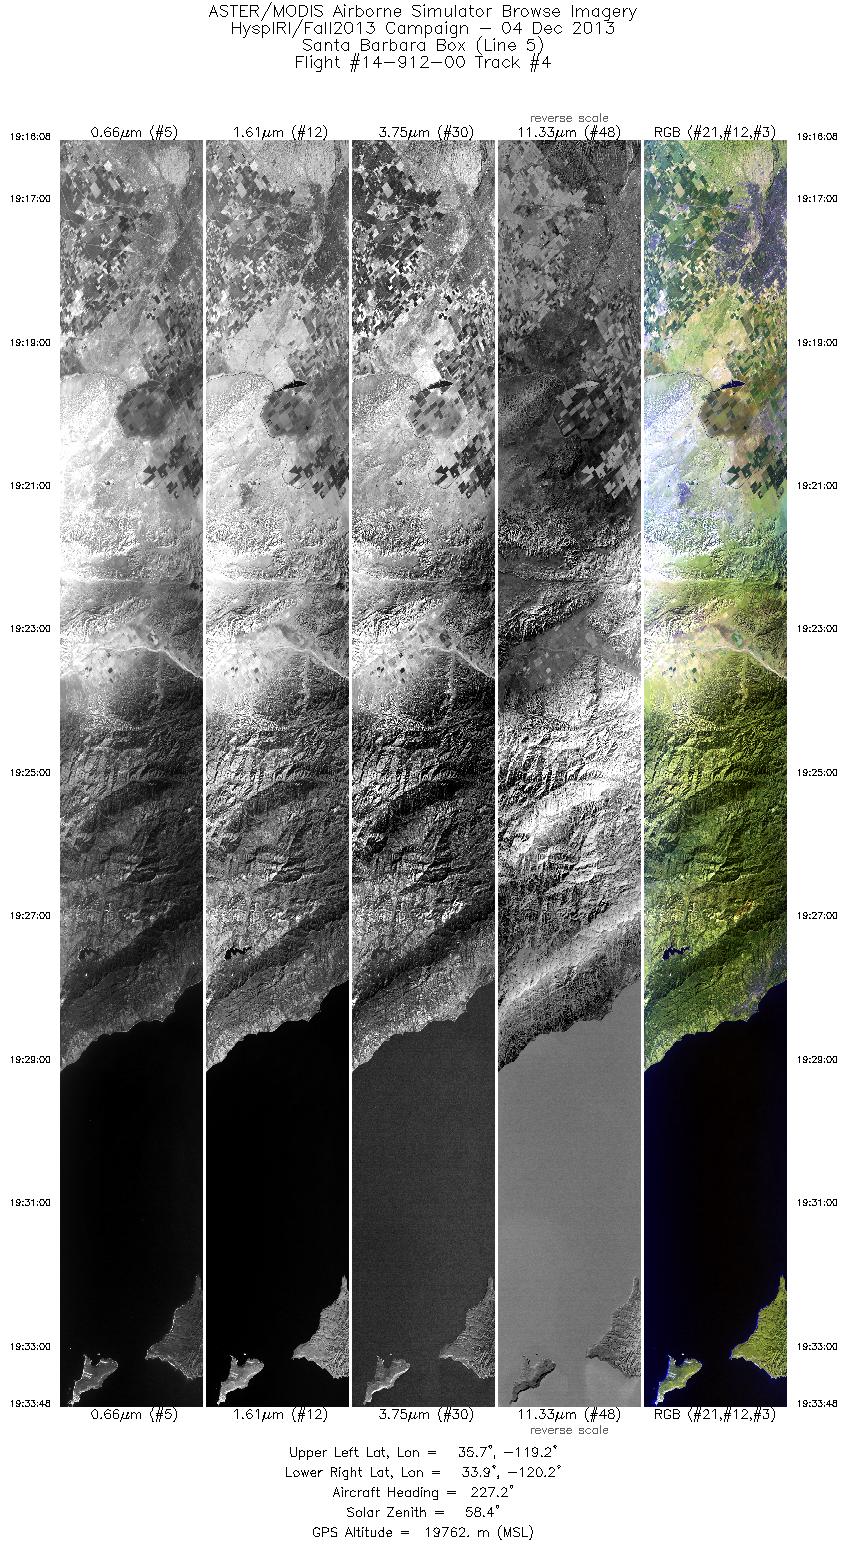
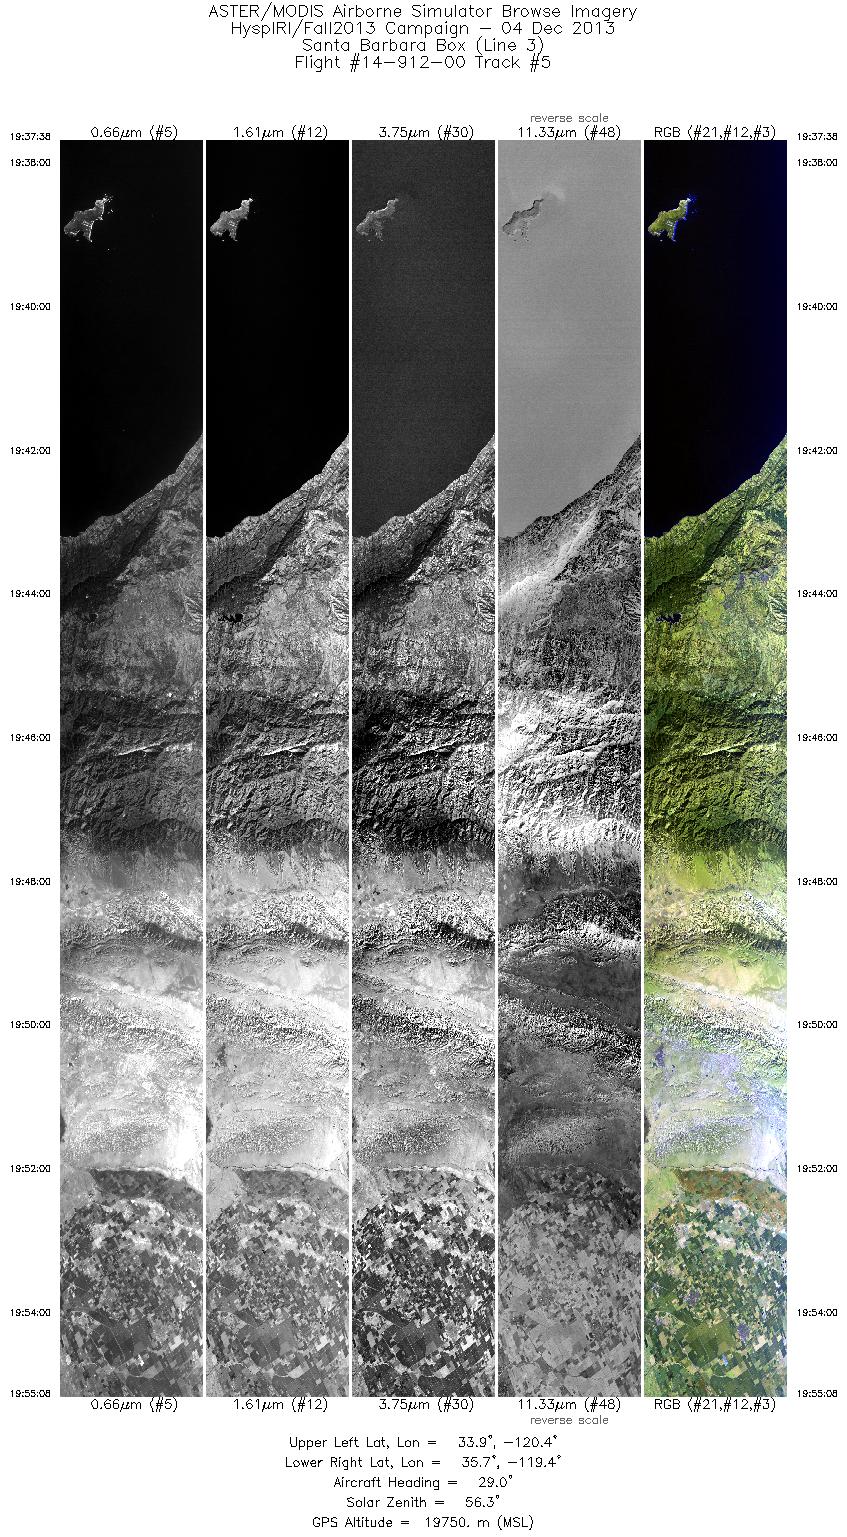
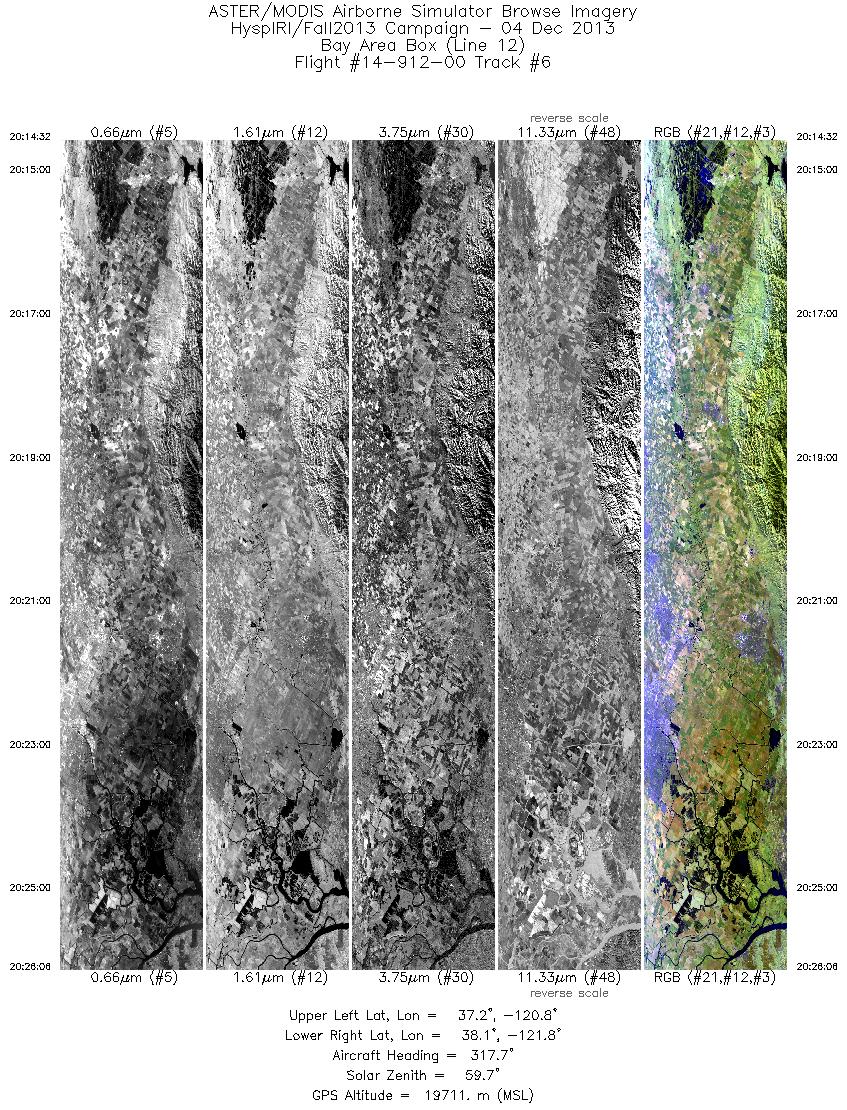
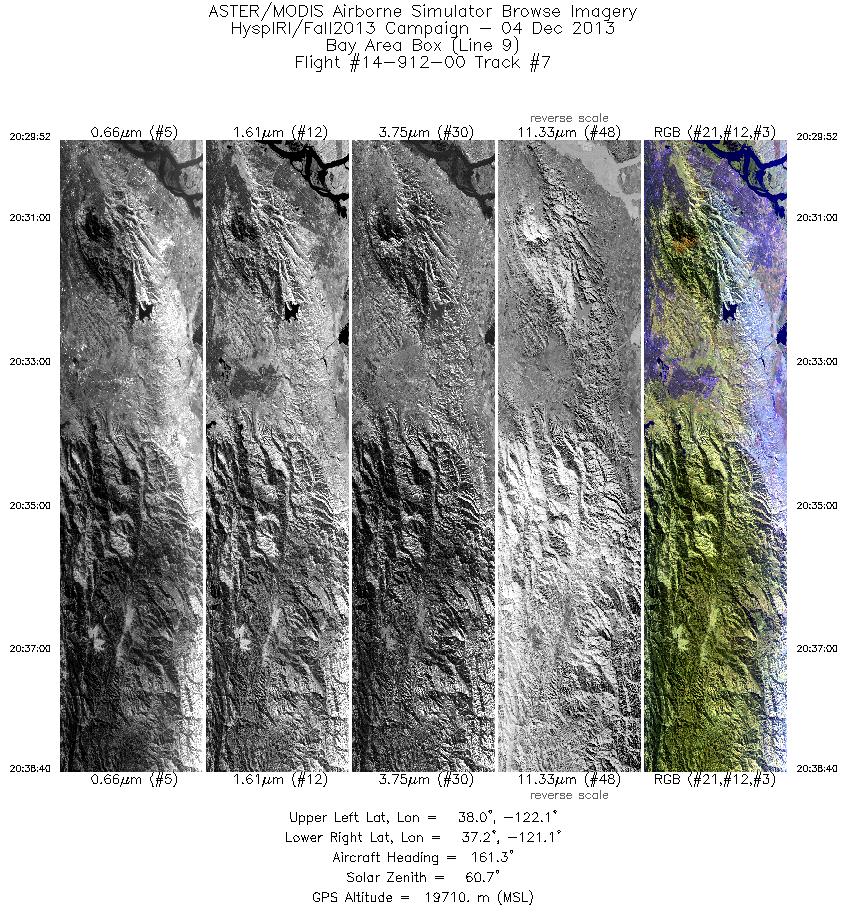
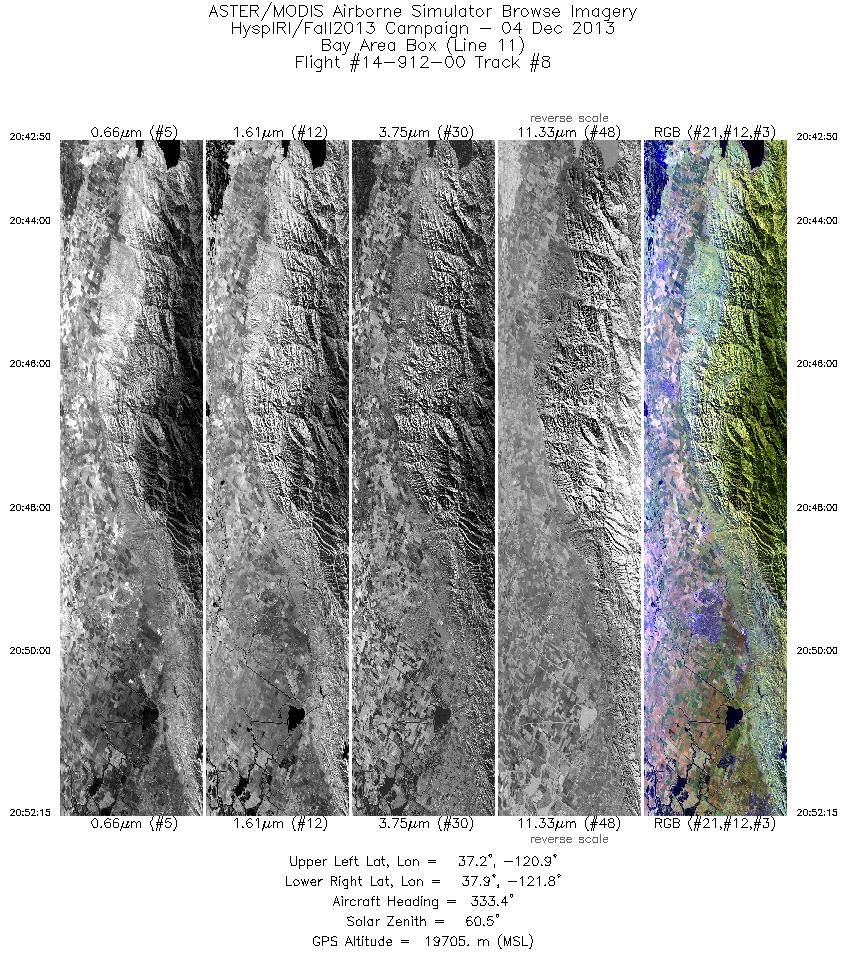
FLIGHT SUMMARY INFORMATION
Flight Track Map


|
Flight: 14-912-00 Date: December 4, 2013 Aircraft: NASA ER-2, #809 Deployment: HyspIRI Fall 2013 Flight Location: Santa Barbara / San Francisco Bay Area, CA Principal Investigator: Green / Hook (JPL) Additional Sensors: AVIRIS |
|||||||||||||||||||||||||||||||||||||||||||||||||||||||||||||||||||||||||||||||||||||||||||||||||||||||||
|
Data Evaluation Overall data quality is good. Channels 41 and 45 are severely limited by noise artifacts All data collected @6.25Hz |
|||||||||||||||||||||||||||||||||||||||||||||||||||||||||||||||||||||||||||||||||||||||||||||||||||||||||
|
Processing Information Level-1B Data in HDF format is available Flight Line Summary Spectral Band Configuration Spectral Response Function Table Spectral Response Function (text) |
|||||||||||||||||||||||||||||||||||||||||||||||||||||||||||||||||||||||||||||||||||||||||||||||||||||||||
|
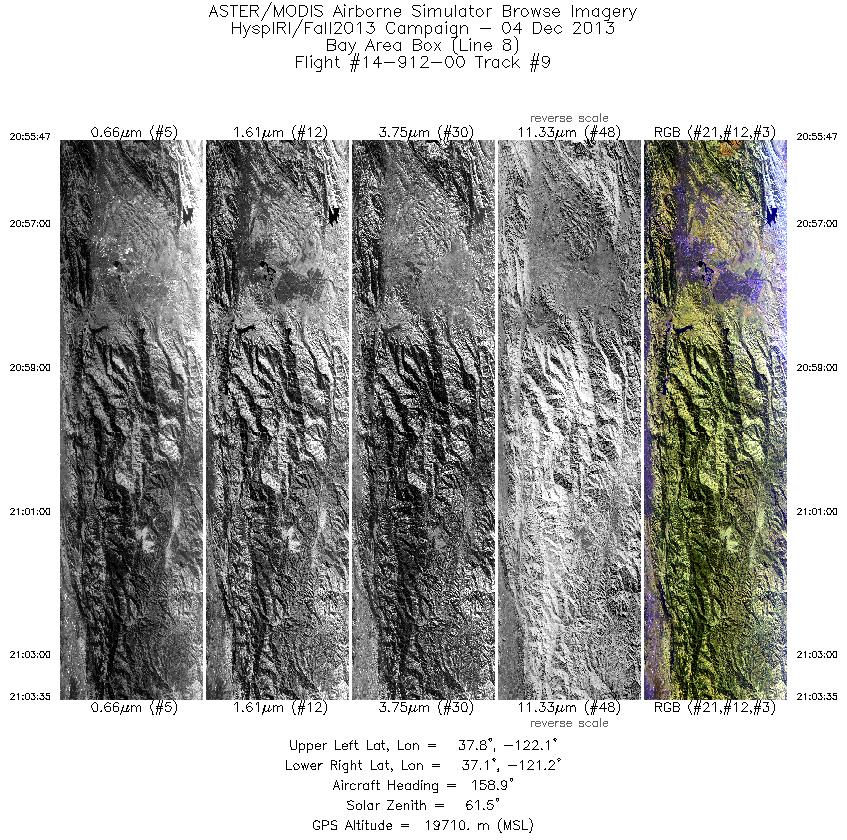
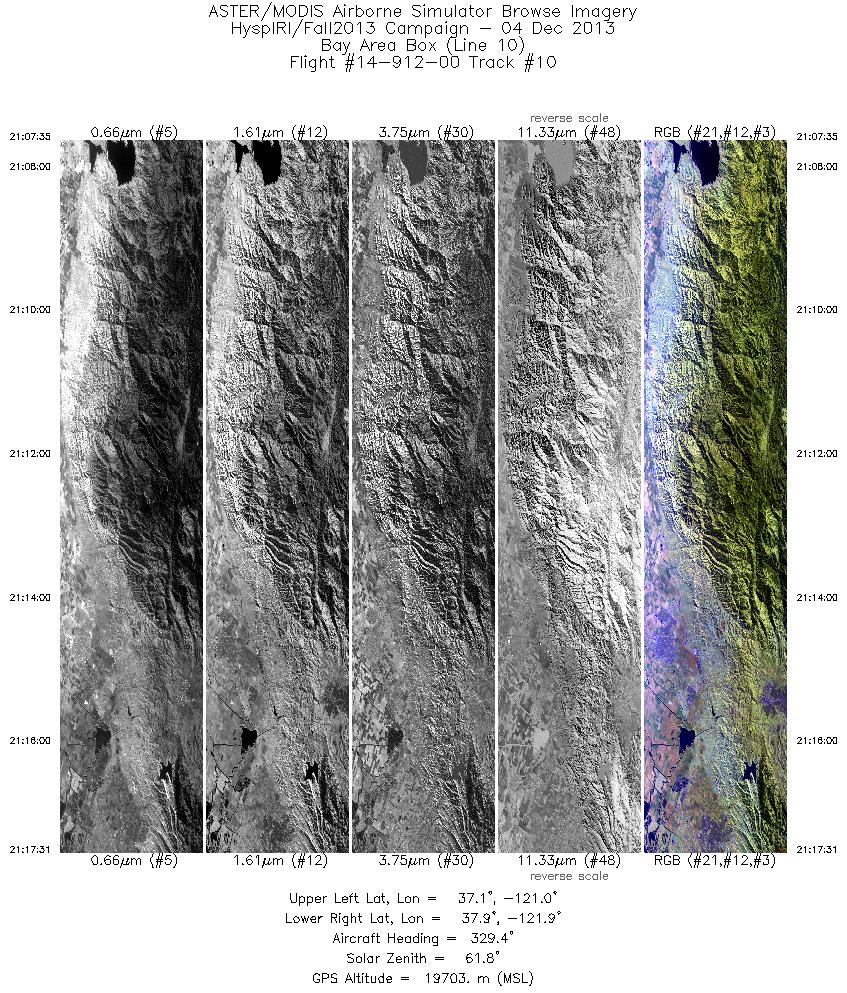
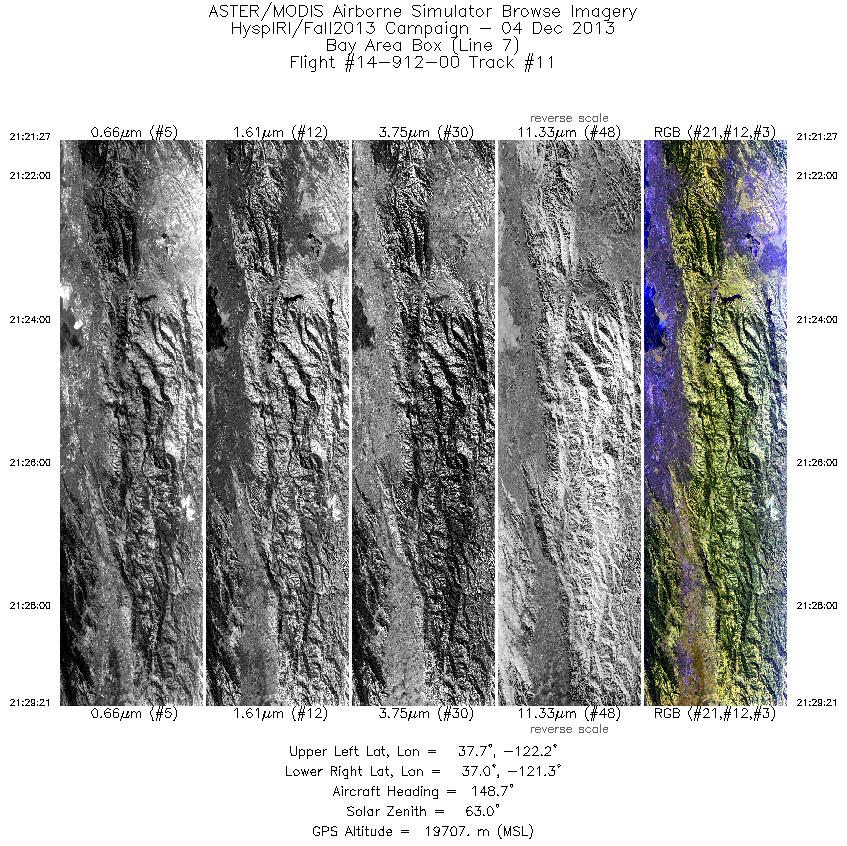
Browse Imagery Flight Tracks: 11 Scanlines: 50064 |
|||||||||||||||||||||||||||||||||||||||||||||||||||||||||||||||||||||||||||||||||||||||||||||||||||||||||
|
|||||||||||||||||||||||||||||||||||||||||||||||||||||||||||||||||||||||||||||||||||||||||||||||||||||||||


