Flight: 13-944-00
Date: May 10, 2013
Aircraft: NASA ER2, #809
Deployment: SNPP Spring 2013
Flight Location: Gulf of California / Baja California
Principal Investigator: Larar (LRC)
Additional Sensors: AVIRIS / SHIS / NAST-I / NAST-M
|
Data Evaluation
Overall data quality is good.
All data collected @6.25Hz
|
Processing Information
Level-1B Data in HDF format is available
Flight Line Summary
Spectral Band Configuration
Spectral Response Function Table
Spectral Response Function (text)
|
Browse Imagery
Flight Tracks: 13
Scanlines: 87879
|
Browse Imagery Table
|
Click a Flight Track number to view a quicklook image
Lat/Lon ranges are for the BEG-END scanline nadir pixels
|
Flight
Track |
Time Span
(UTC) |
Heading
(Deg) |
Lat Range
(Deg N) |
Lon Range
(Deg W) |
Length
(Scanlines) |
Altitude
(Meters) |
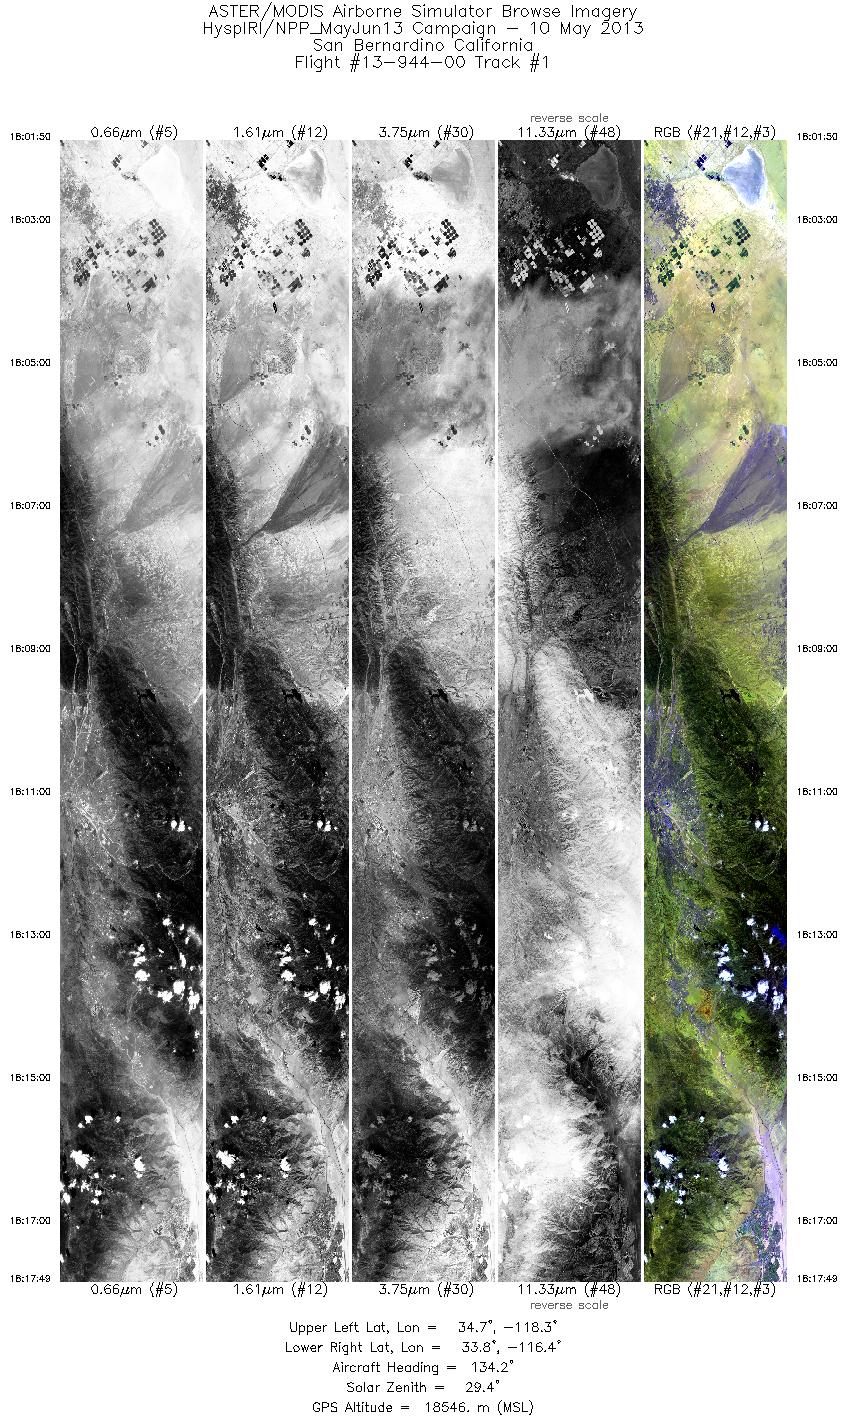
| 1 |
18:01 - 18:17 |
131.6 |
34.827 - 33.696 |
118.166 - 116.498 |
5714 |
18336 |
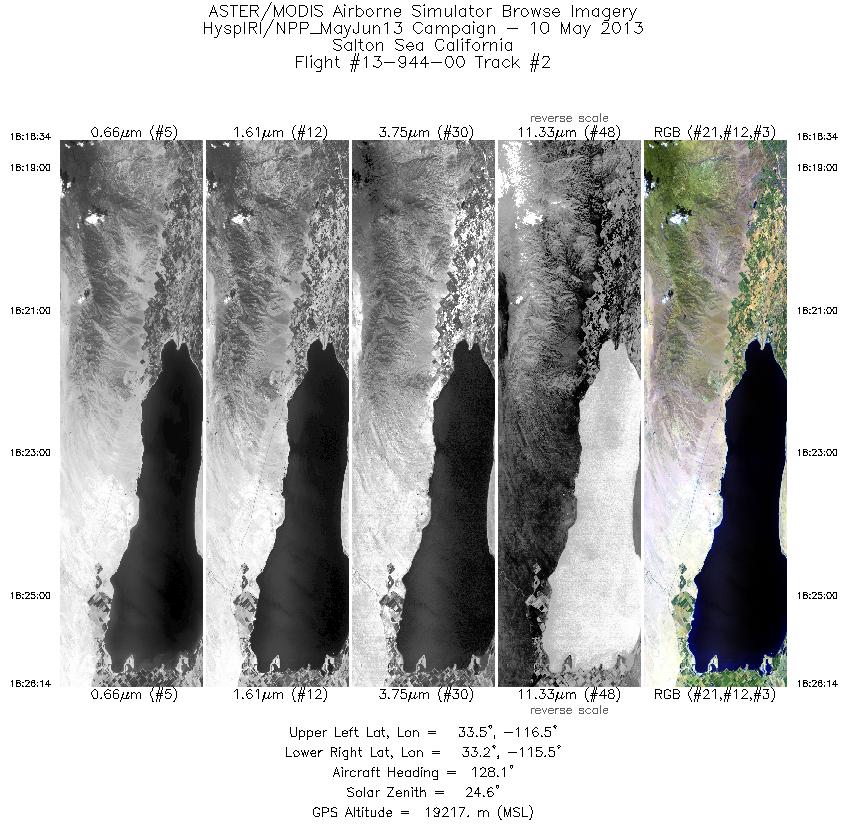
| 2 |
18:18 - 18:26 |
129.1 |
33.638 - 33.105 |
116.424 - 115.654 |
2739 |
19120 |
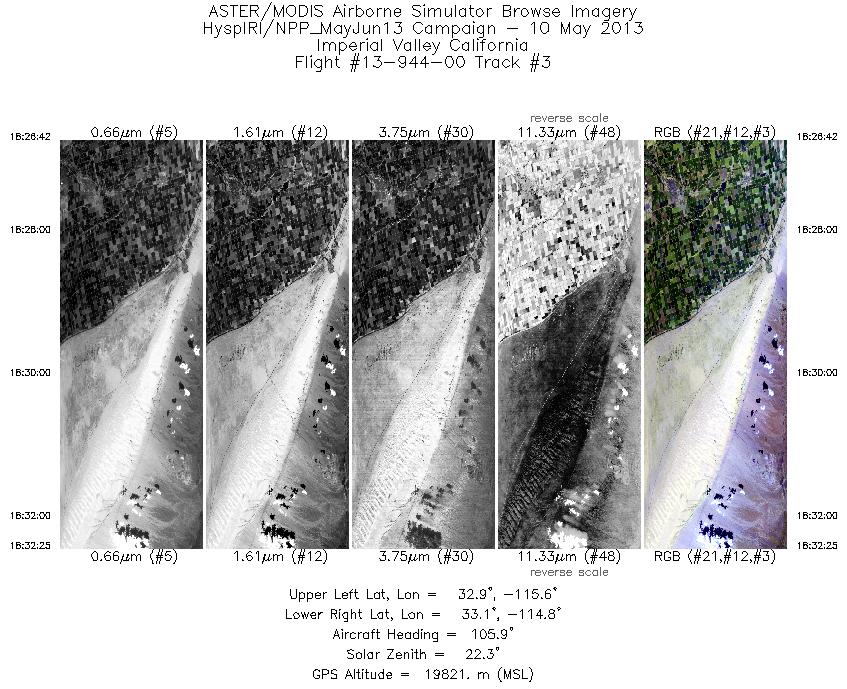
| 3 |
18:26 - 18:32 |
105.4 |
33.082 - 32.913 |
115.600 - 114.879 |
2046 |
19853 |
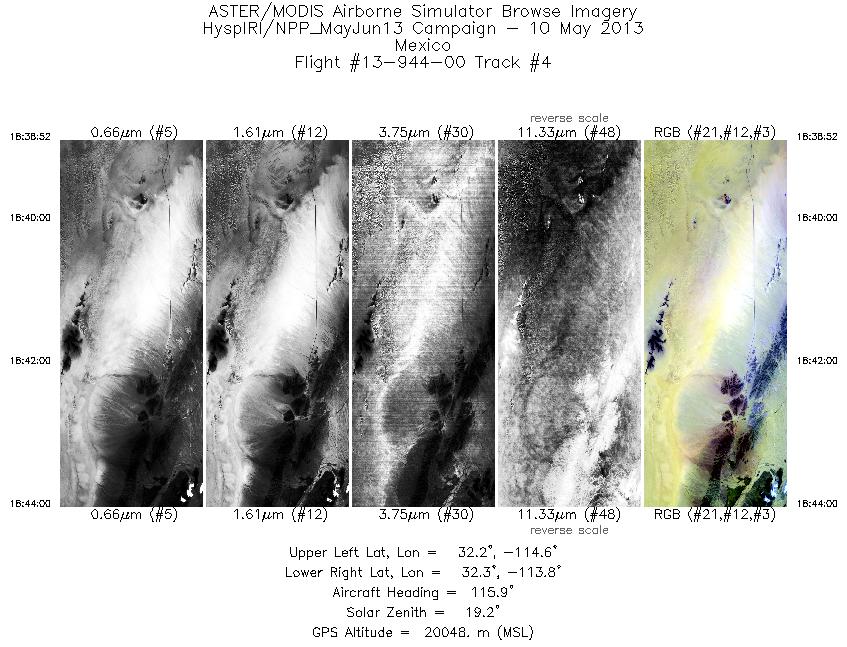
| 4 |
18:38 - 18:44 |
112.9 |
32.321 - 32.120 |
114.488 - 113.878 |
1836 |
20079 |
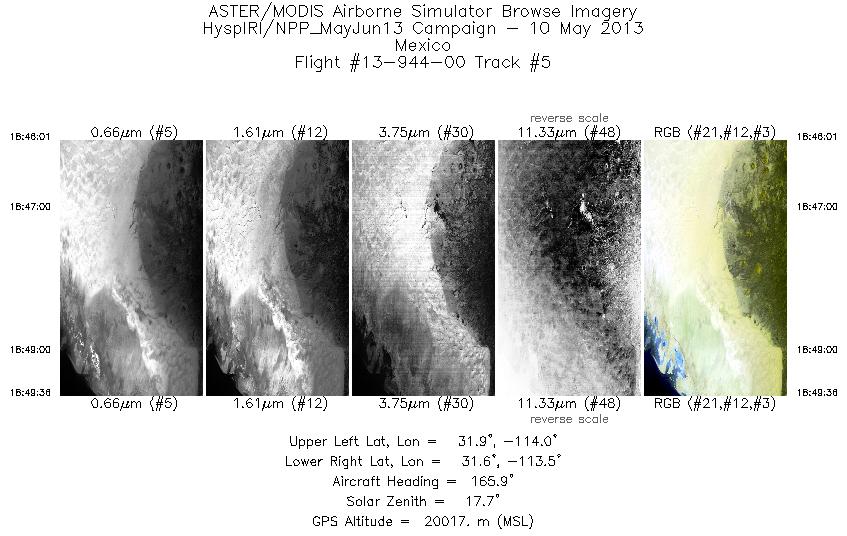
| 5 |
18:46 - 18:49 |
165.9 |
31.939 - 31.559 |
113.767 - 113.665 |
1282 |
20024 |
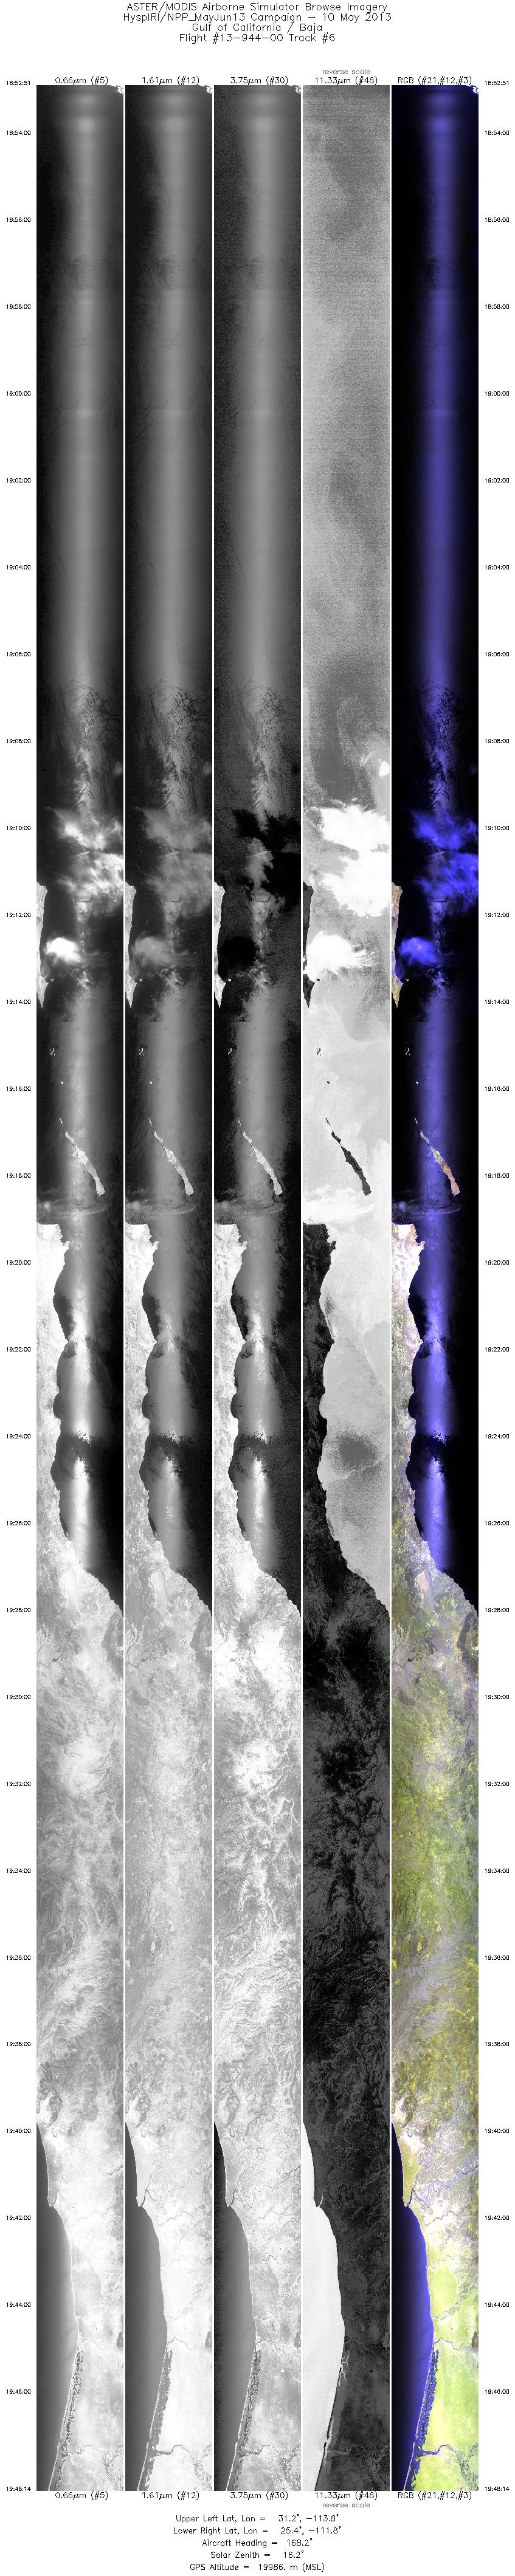
| 6 |
18:52 - 19:48 |
167.1 |
31.252 - 25.384 |
113.580 - 111.997 |
19799 |
19879 |
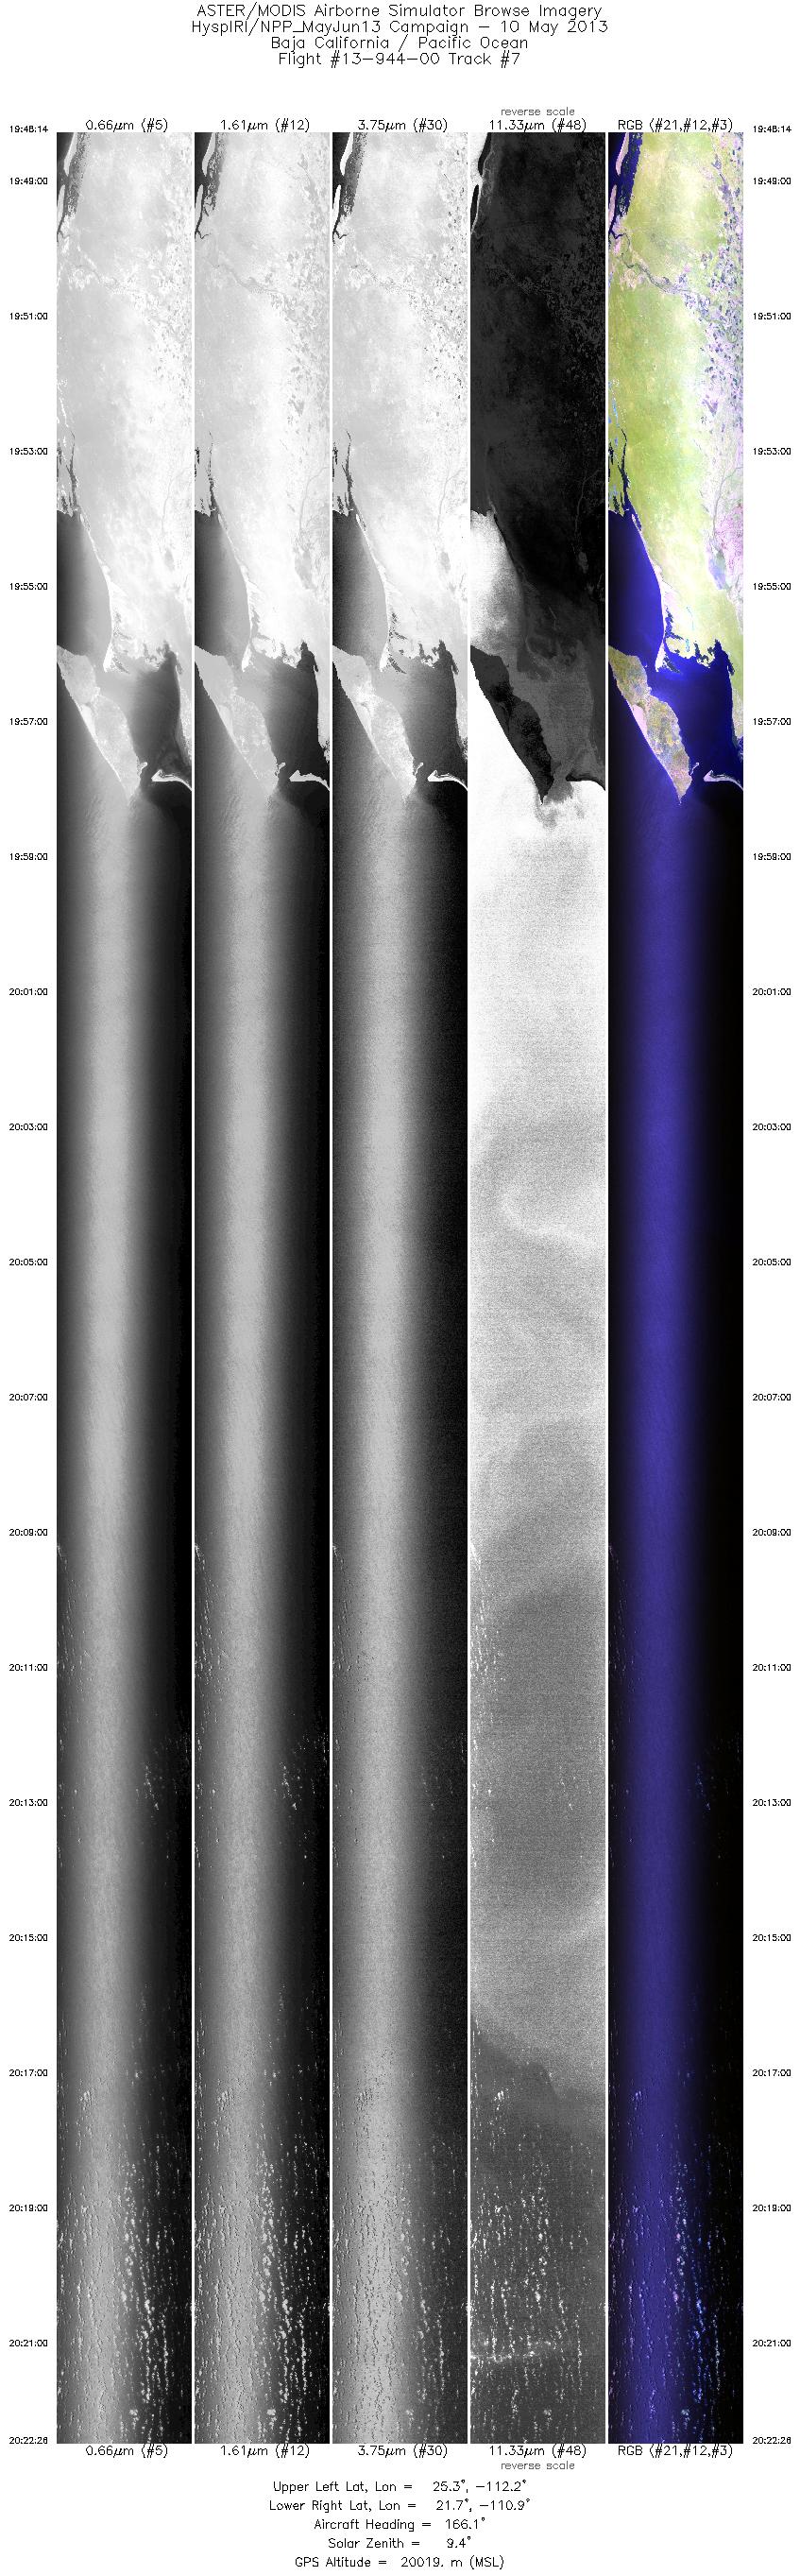
| 7 |
19:48 - 20:22 |
166.4 |
25.383 - 21.667 |
111.997 - 111.058 |
12231 |
20015 |
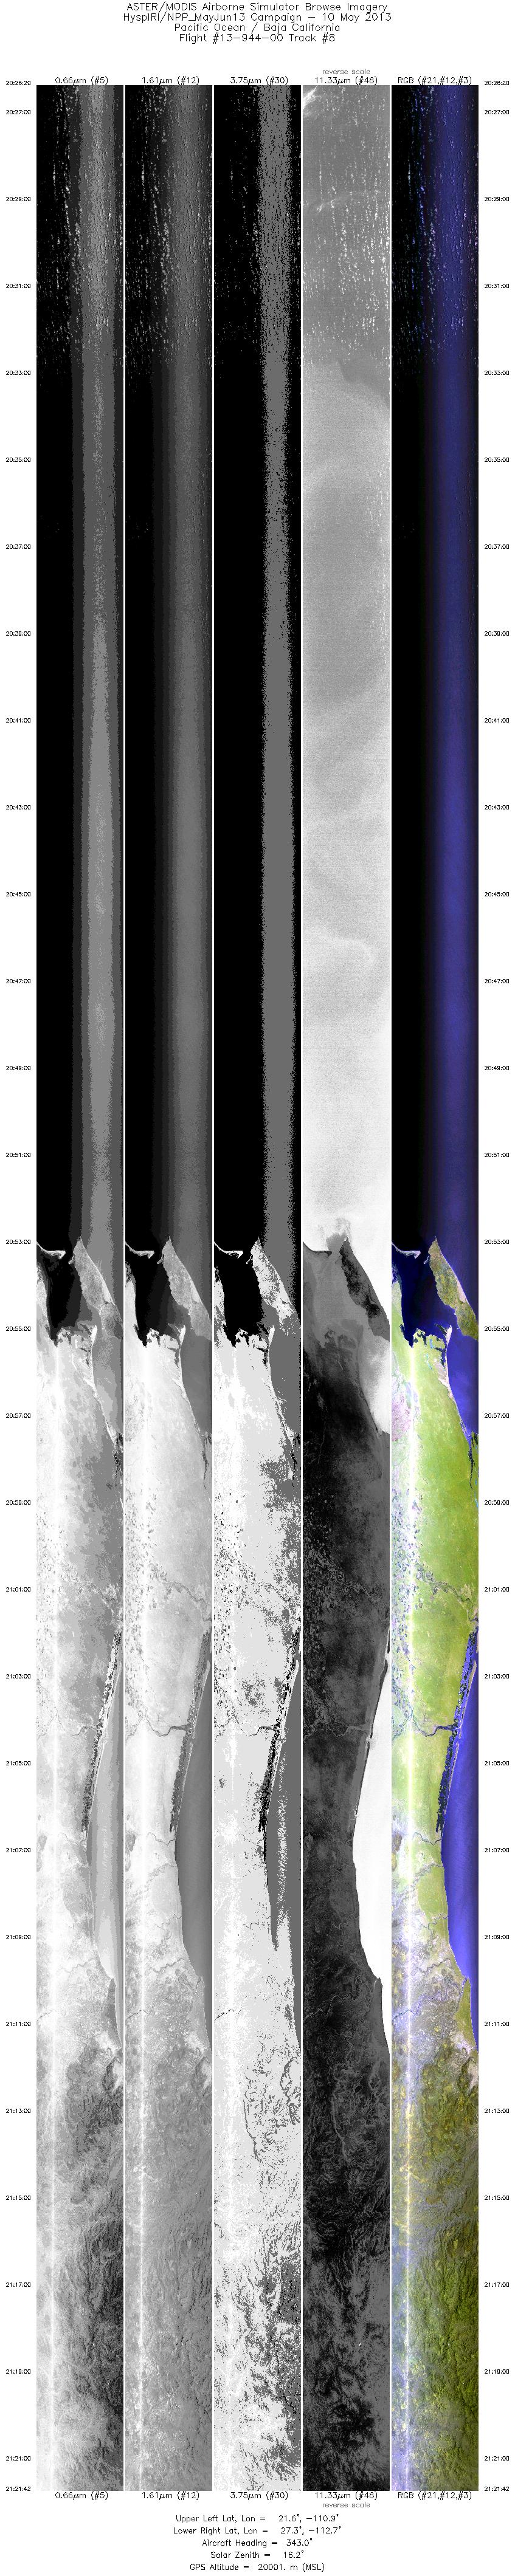
| 8 |
20:26 - 21:21 |
344.8 |
21.551 - 27.323 |
111.021 - 112.493 |
19799 |
19921 |
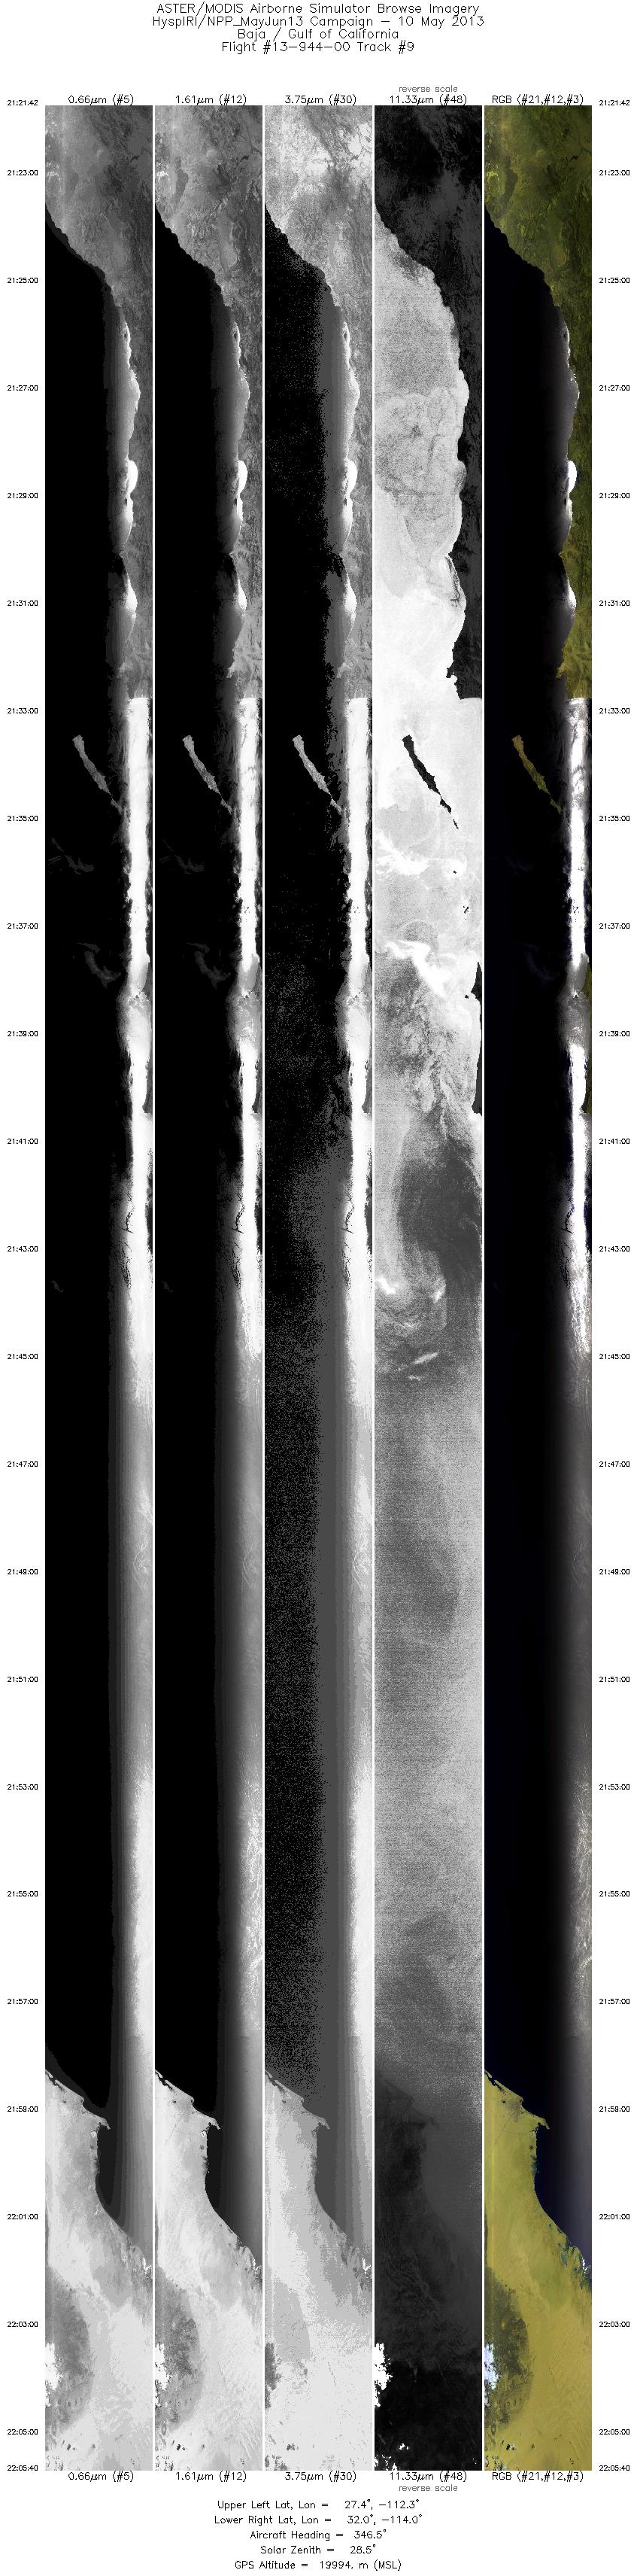
| 9 |
21:21 - 22:05 |
347.8 |
27.323 - 32.037 |
112.493 - 113.797 |
15716 |
19992 |
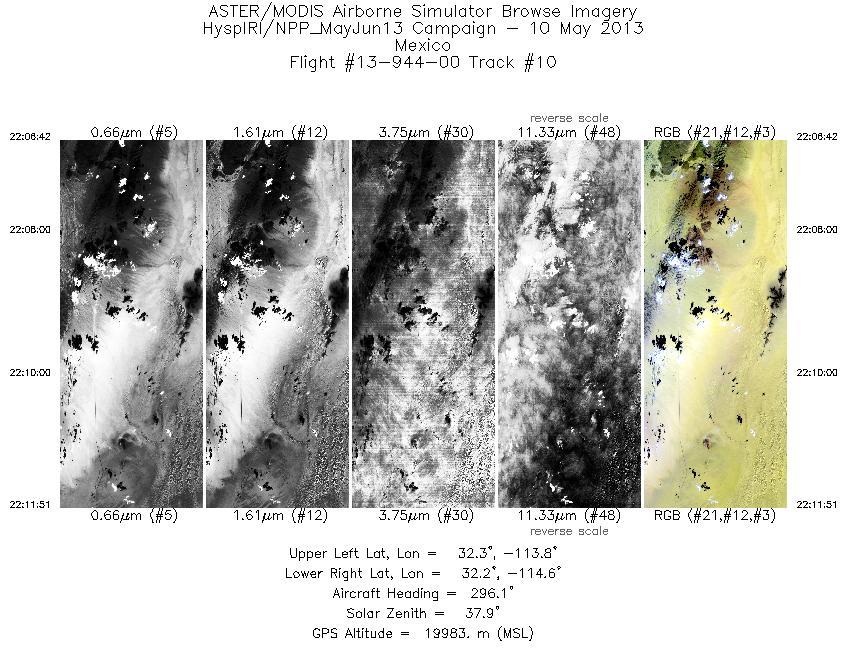
| 10 |
22:06 - 22:11 |
293.7 |
32.122 - 32.324 |
113.879 - 114.496 |
1843 |
19996 |
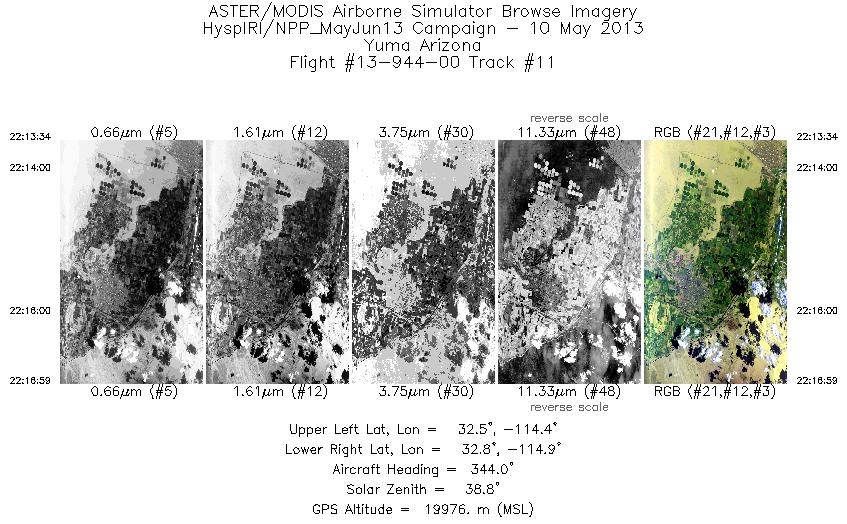
| 11 |
22:13 - 22:16 |
345.3 |
32.466 - 32.825 |
114.633 - 114.731 |
1221 |
19989 |
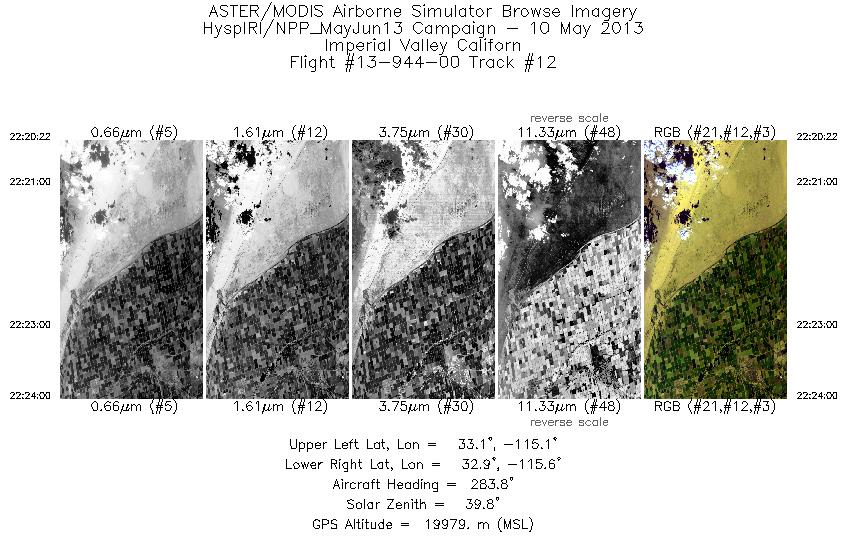
| 12 |
22:20 - 22:23 |
284.0 |
32.960 - 33.058 |
115.108 - 115.560 |
1296 |
19982 |
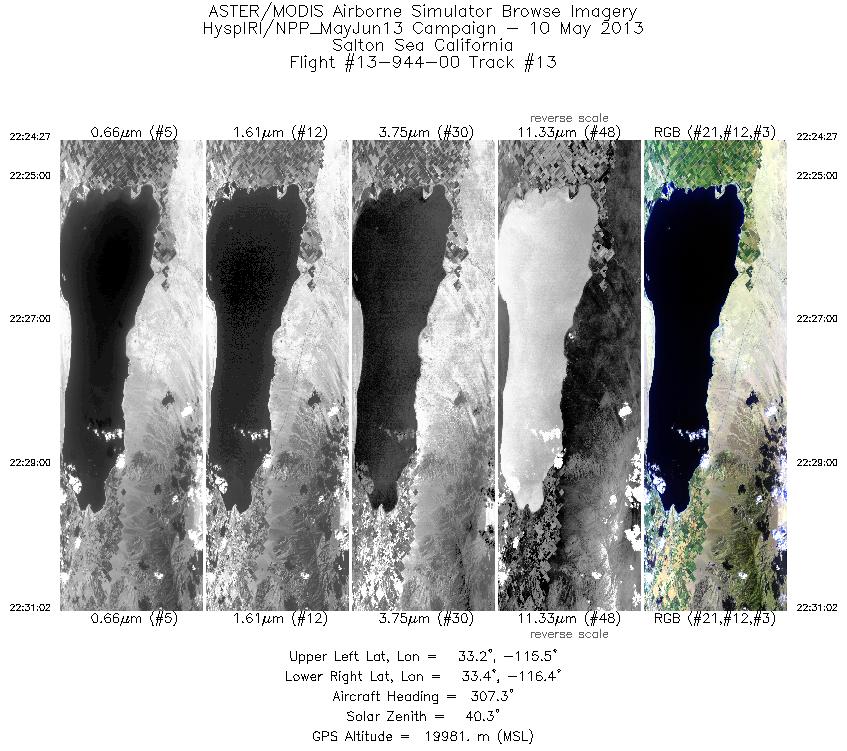
| 13 |
22:24 - 22:31 |
308.7 |
33.079 - 33.537 |
115.613 - 116.264 |
2357 |
19973 |
|


