Flight: 13-938-00
Date: April 11, 2013
Aircraft: NASA ER2, #809
Deployment: HyspIRI Early Spring 2013
Flight Location: Santa Barbara, CA
Principal Investigator: Green / Hook (JPL)
Additional Sensors: AVIRIS / DCS
|
Data Evaluation
Overall data quality is good.
All data collected @6.25Hz
|
Processing Information
Level-1B Data in HDF format is available
Flight Line Summary
Spectral Band Configuration
Spectral Response Function Table
Spectral Response Function (text)
|
Browse Imagery
Flight Tracks: 13
Scanlines: 79247
|
Browse Imagery Table
|
Click a Flight Track number to view a quicklook image
Lat/Lon ranges are for the BEG-END scanline nadir pixels
|
Flight
Track |
Time Span
(UTC) |
Heading
(Deg) |
Lat Range
(Deg N) |
Lon Range
(Deg W) |
Length
(Scanlines) |
Altitude
(Meters) |
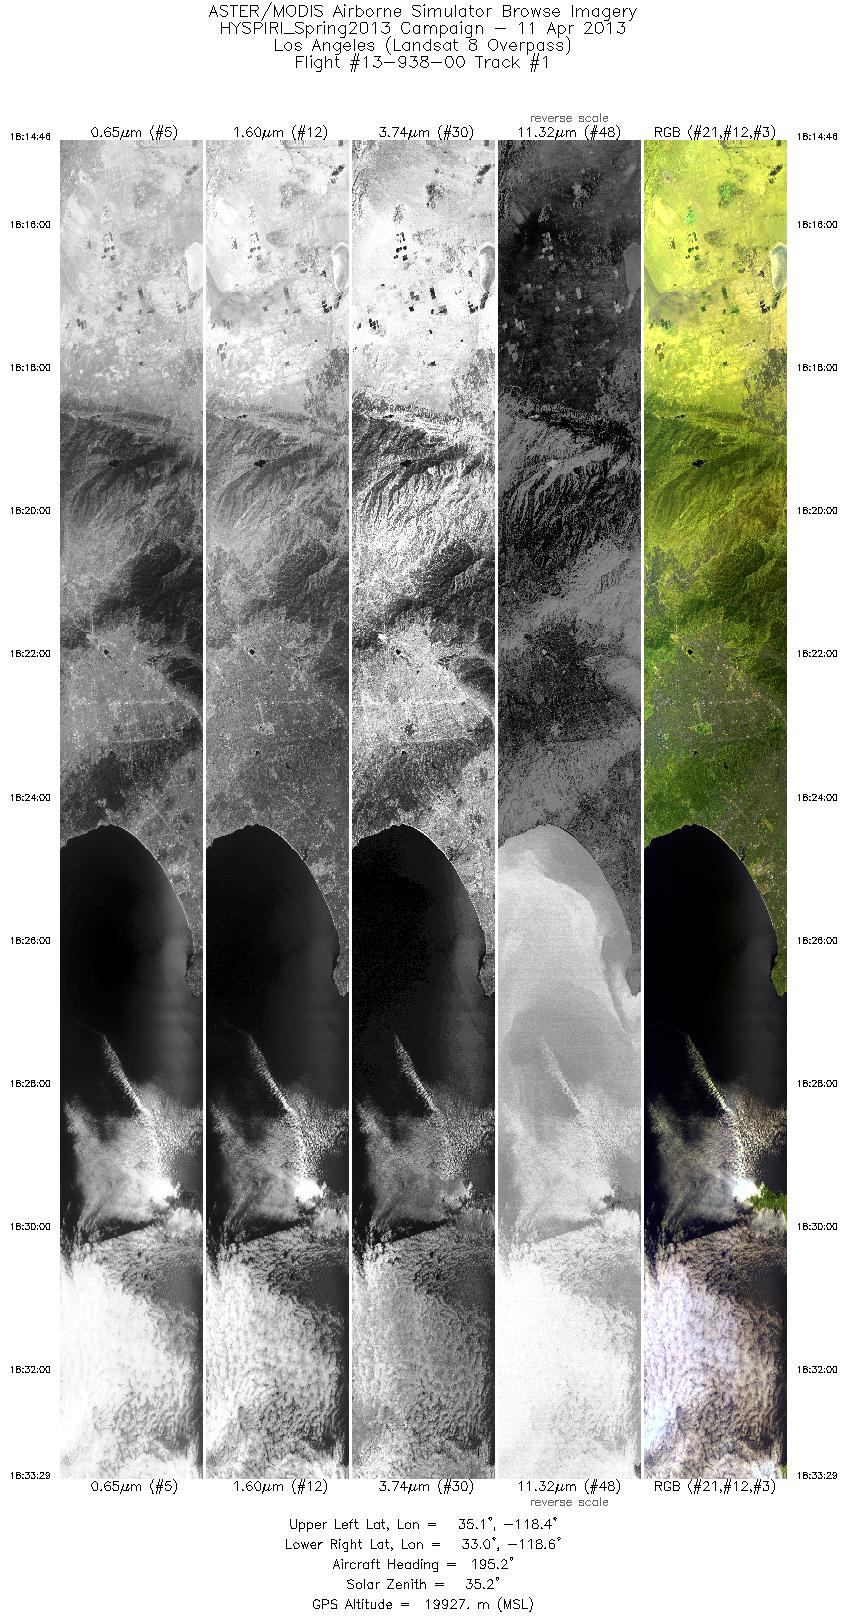
| 1 |
18:14 - 18:33 |
194.9 |
35.060 - 33.045 |
118.186 - 118.770 |
6698 |
19922 |
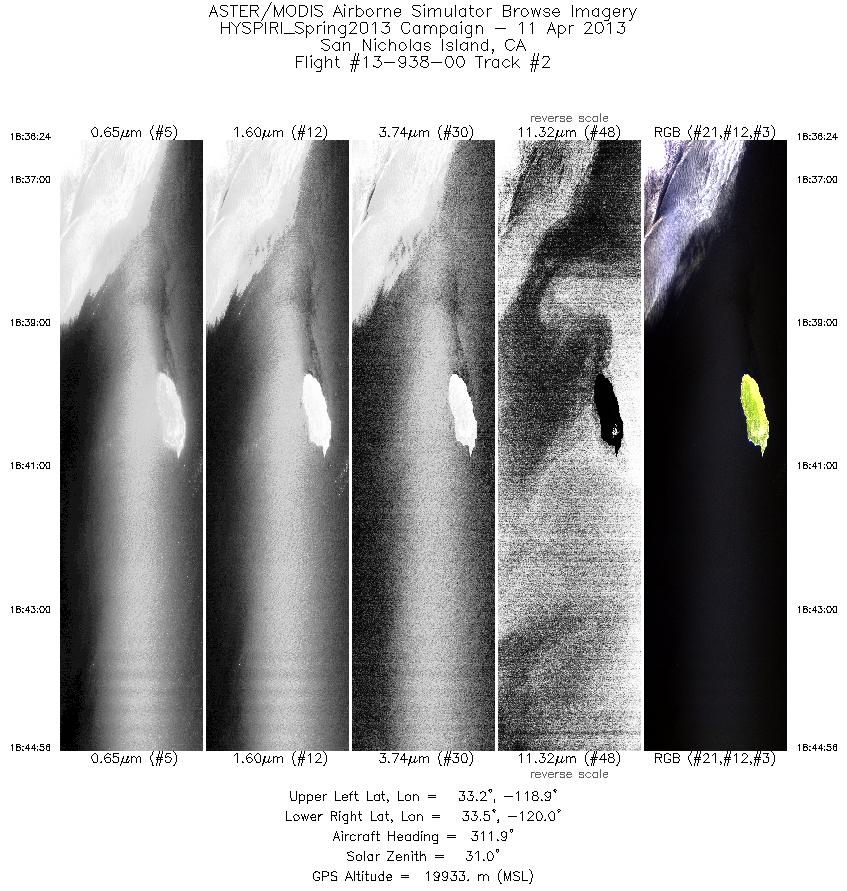
| 2 |
18:36 - 18:44 |
312.8 |
33.034 - 33.631 |
119.074 - 119.895 |
3055 |
19933 |
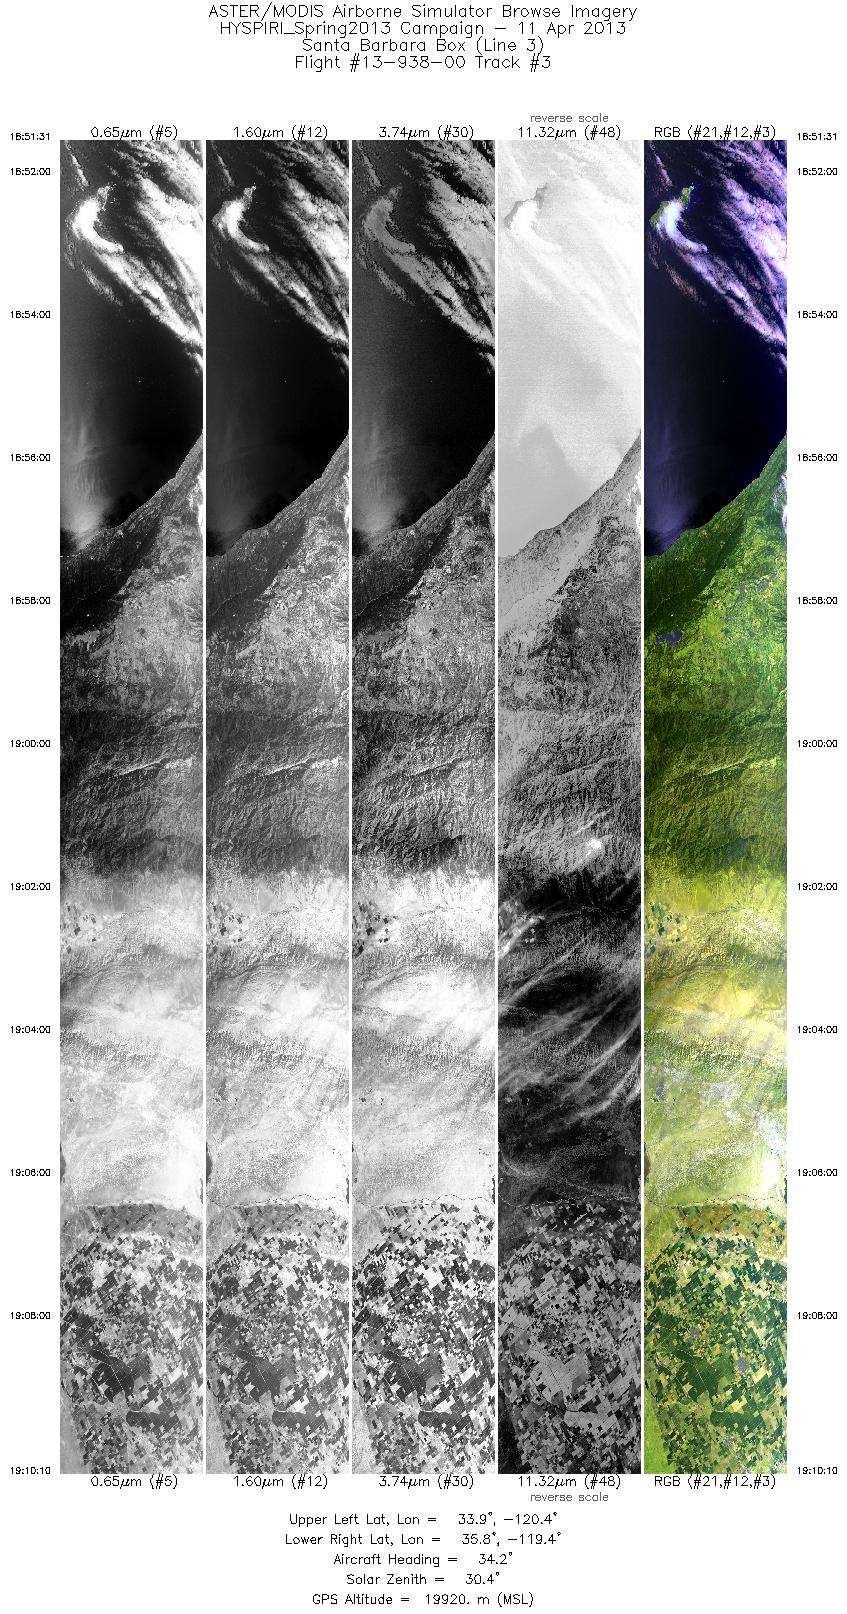
| 3 |
18:51 - 19:10 |
33.4 |
33.997 - 35.710 |
120.538 - 119.170 |
6674 |
19936 |
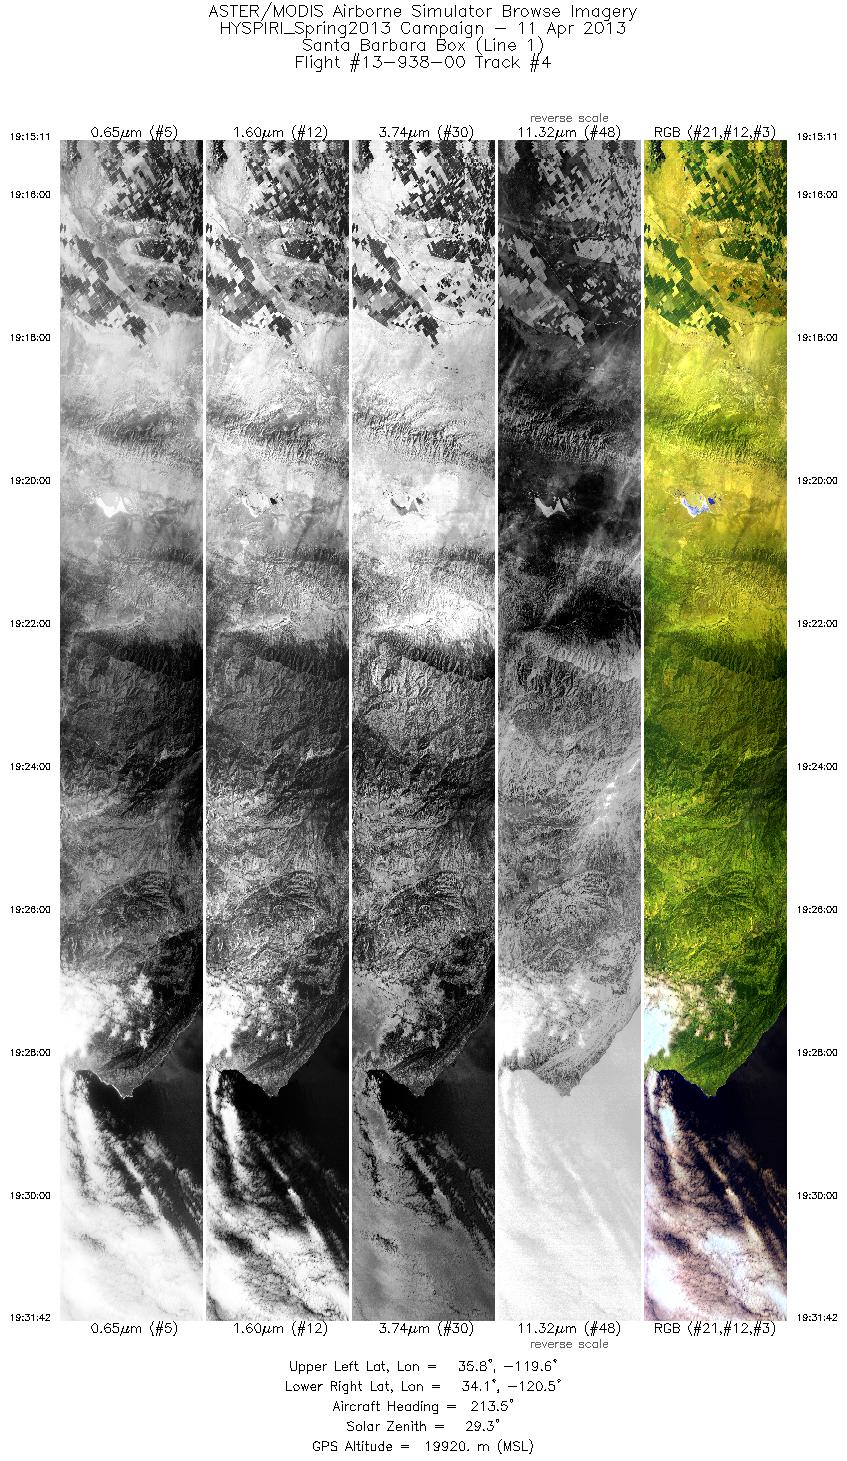
| 4 |
19:15 - 19:31 |
213.1 |
35.681 - 34.147 |
119.459 - 120.686 |
5909 |
19886 |
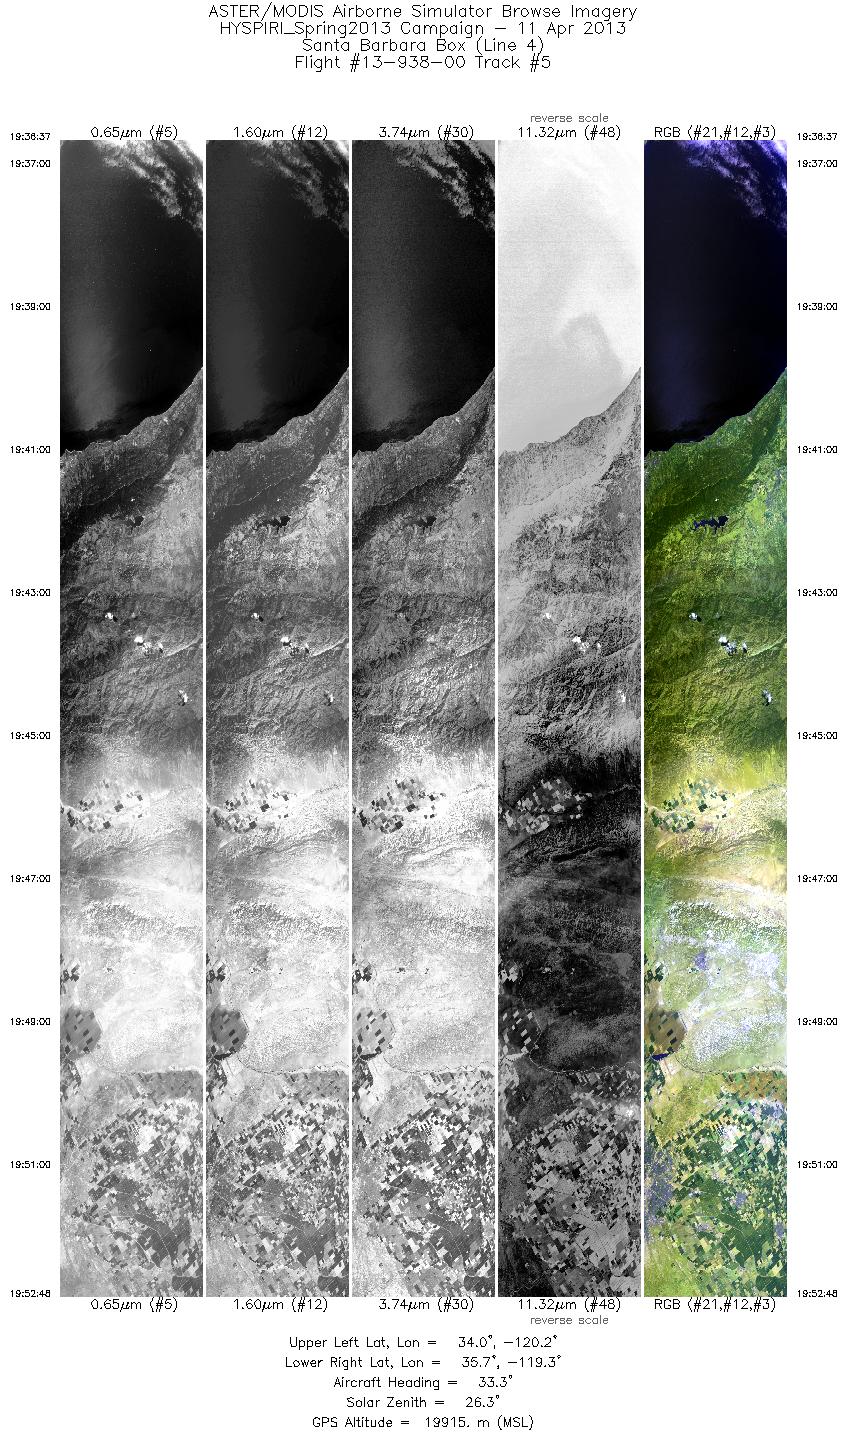
| 5 |
19:36 - 19:52 |
33.3 |
34.090 - 35.607 |
120.351 - 119.122 |
5787 |
19919 |
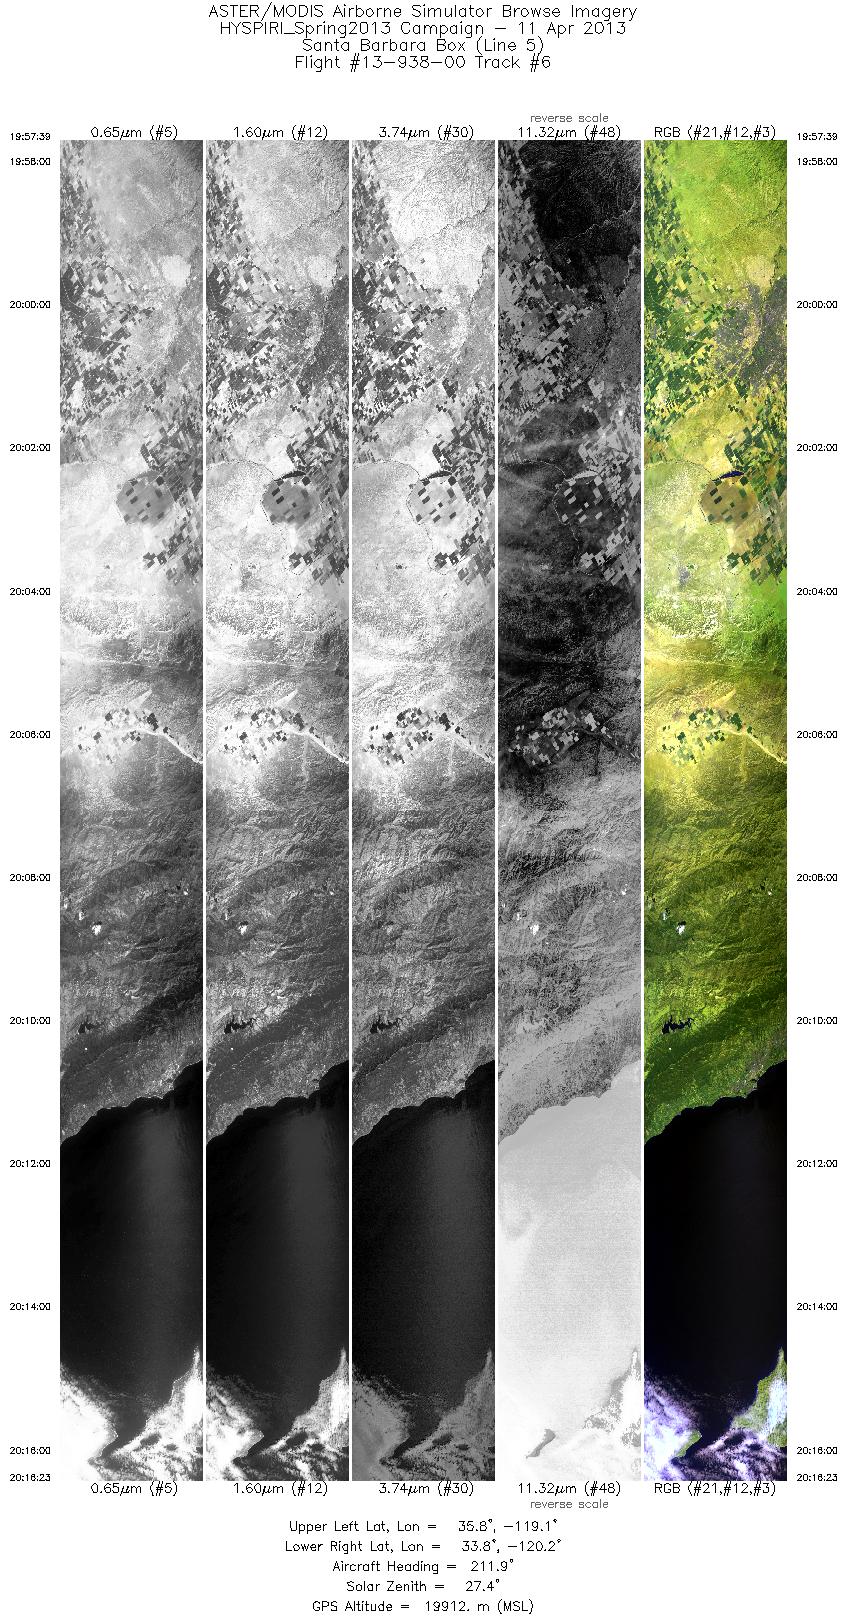
| 6 |
19:57 - 20:16 |
214.0 |
35.675 - 33.945 |
118.942 - 120.328 |
6707 |
19902 |
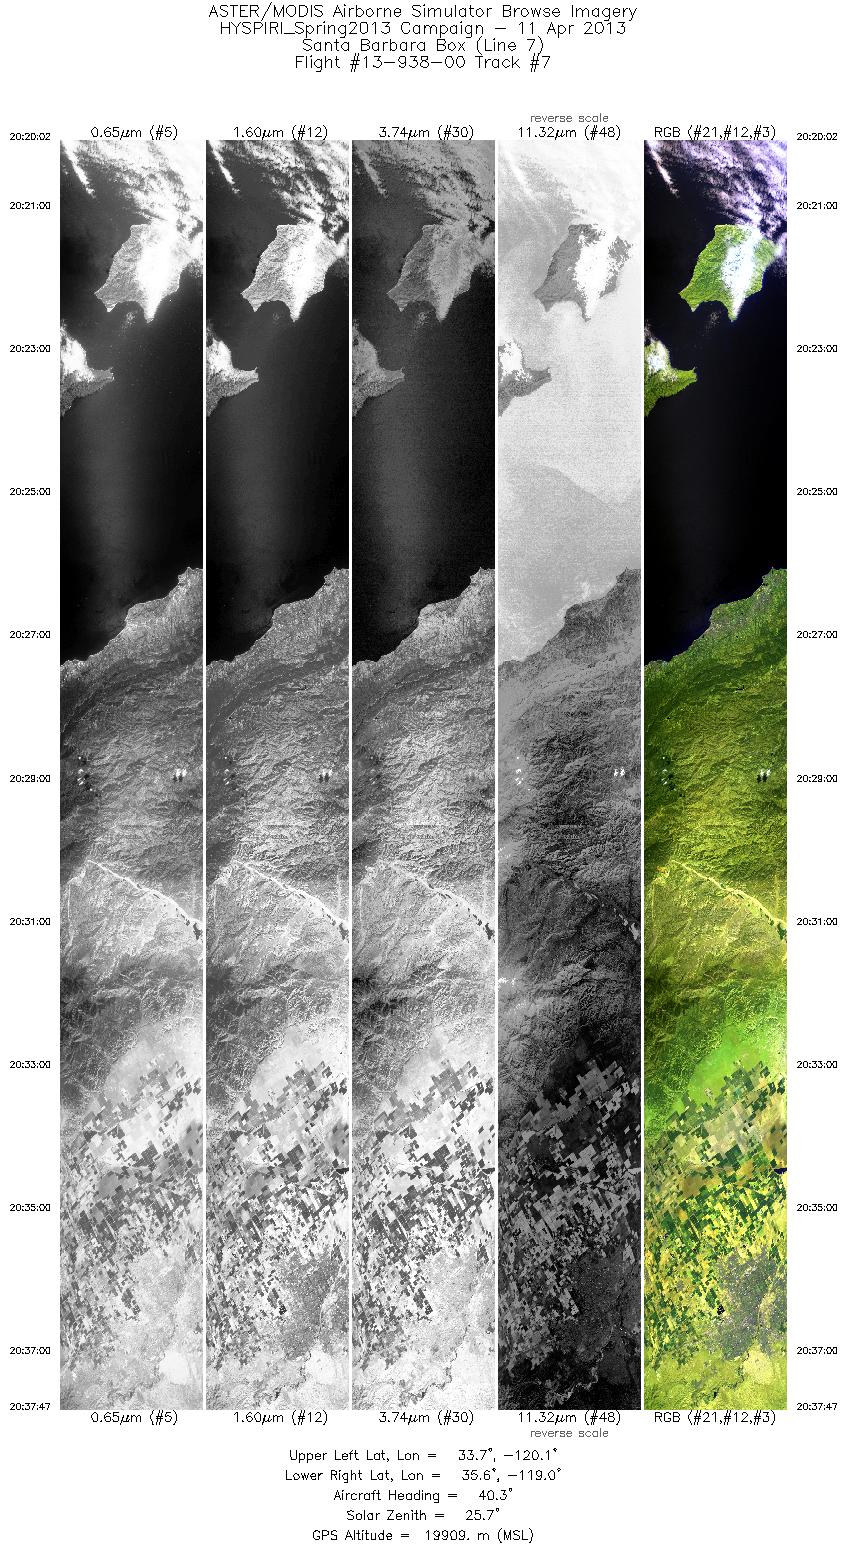
| 7 |
20:20 - 20:37 |
36.3 |
33.789 - 35.462 |
120.212 - 118.850 |
6351 |
19916 |
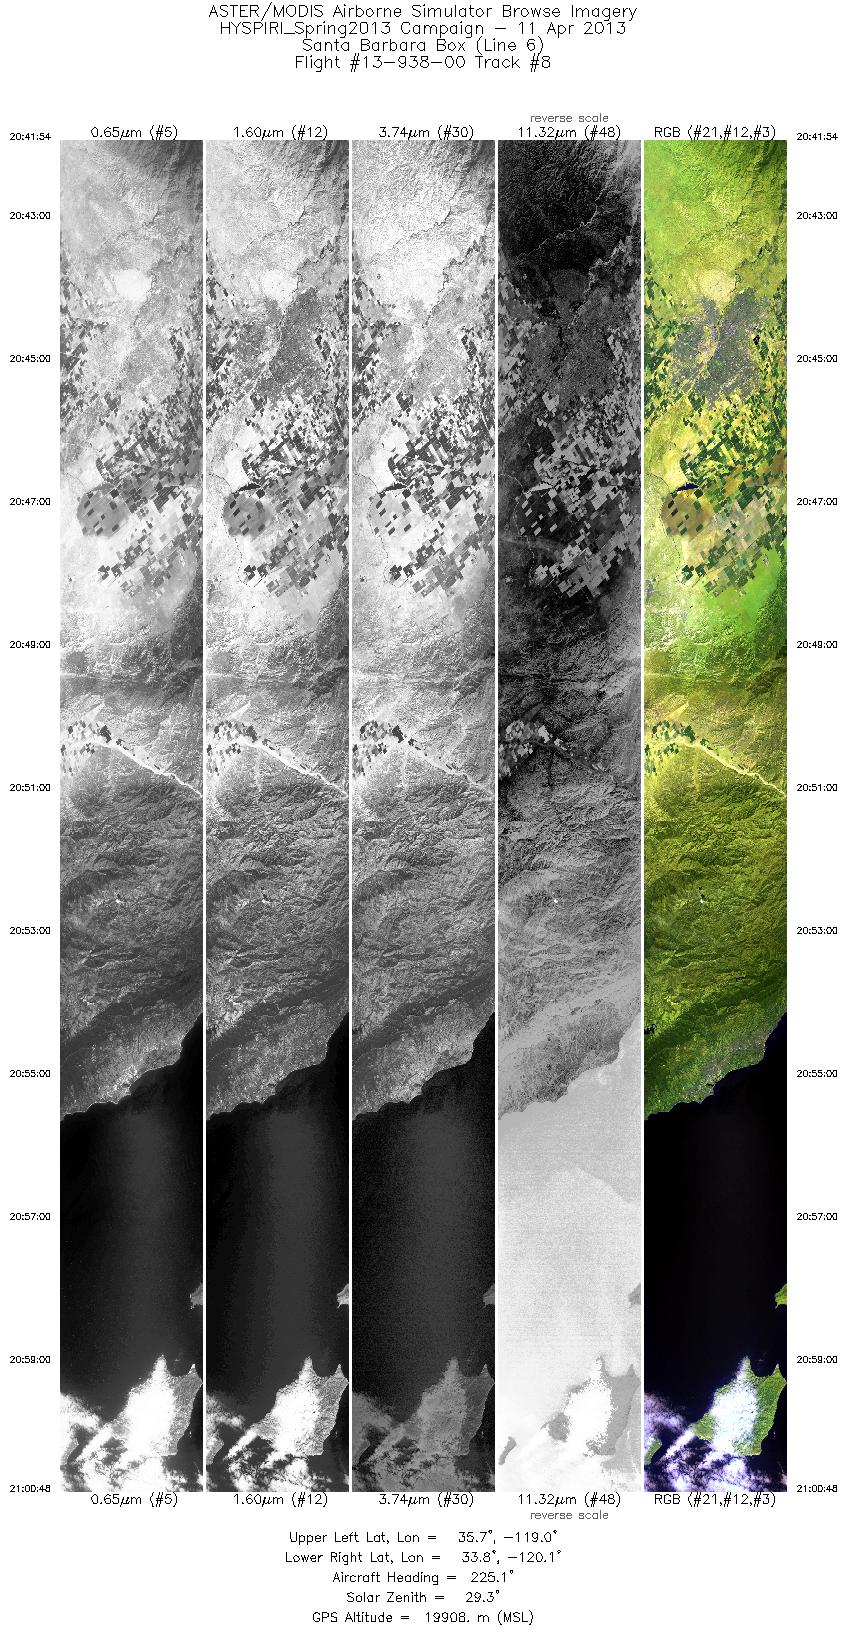
| 8 |
20:41 - 21:00 |
220.3 |
35.627 - 33.892 |
118.823 - 120.245 |
6763 |
19916 |
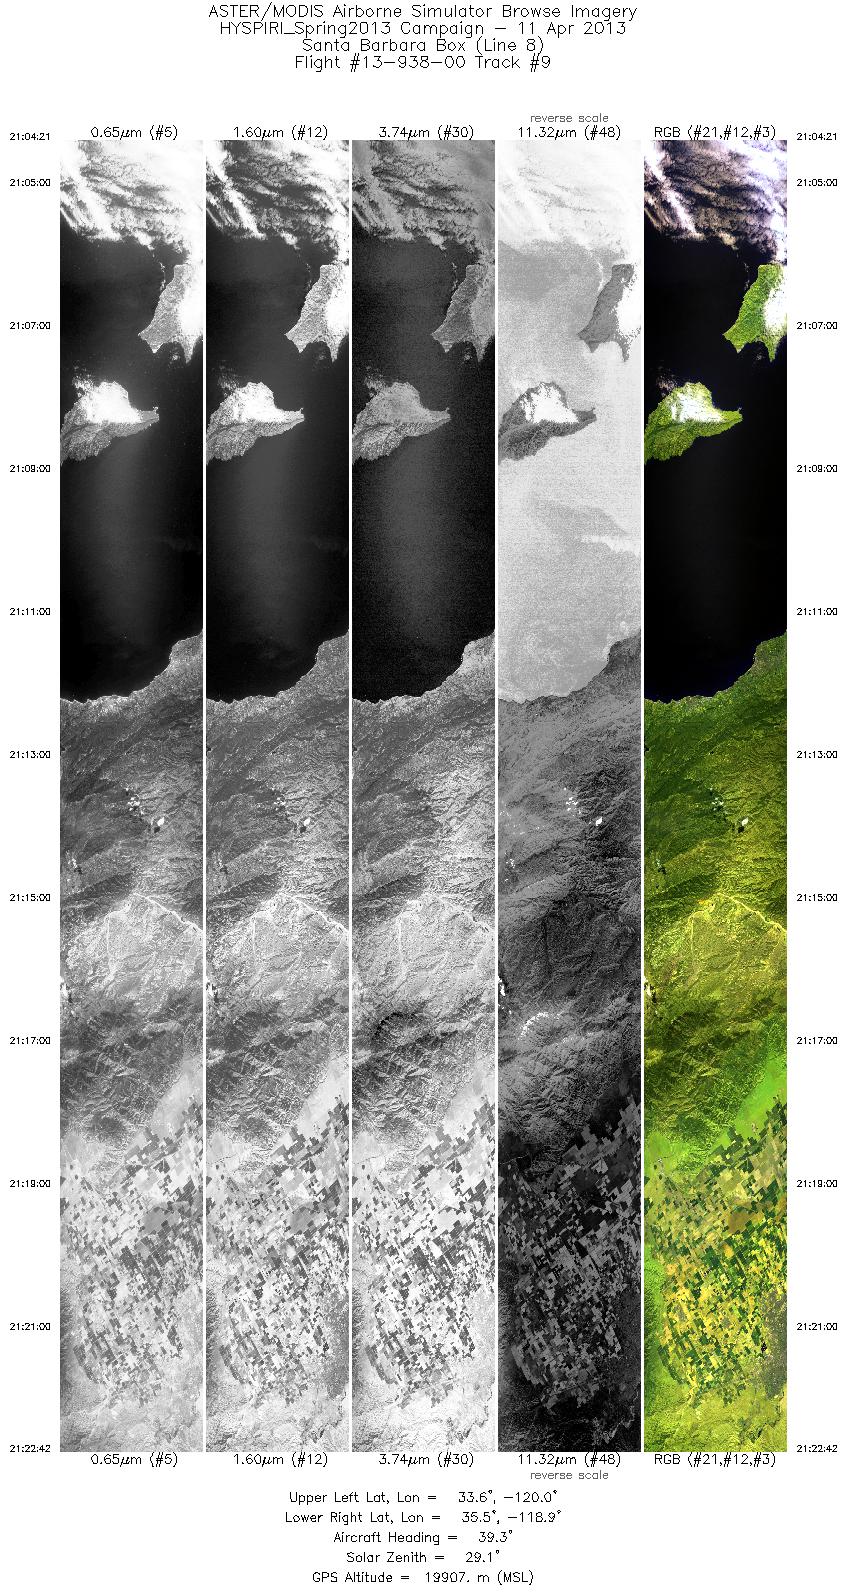
| 9 |
21:04 - 21:22 |
36.4 |
33.691 - 35.418 |
120.174 - 118.755 |
6561 |
19913 |
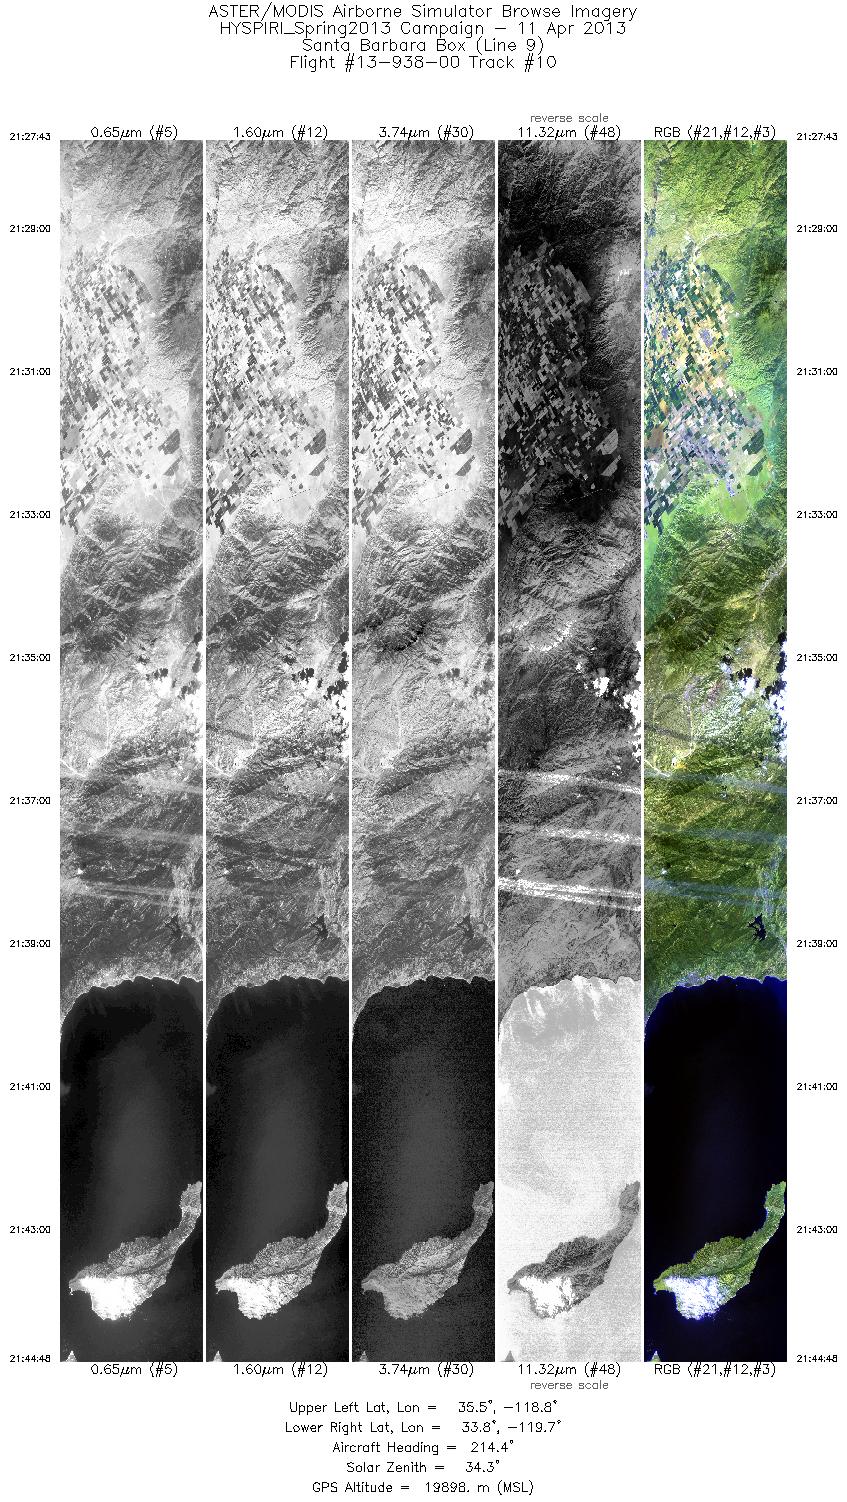
| 10 |
21:27 - 21:44 |
215.1 |
35.439 - 33.894 |
118.609 - 119.865 |
6110 |
19898 |
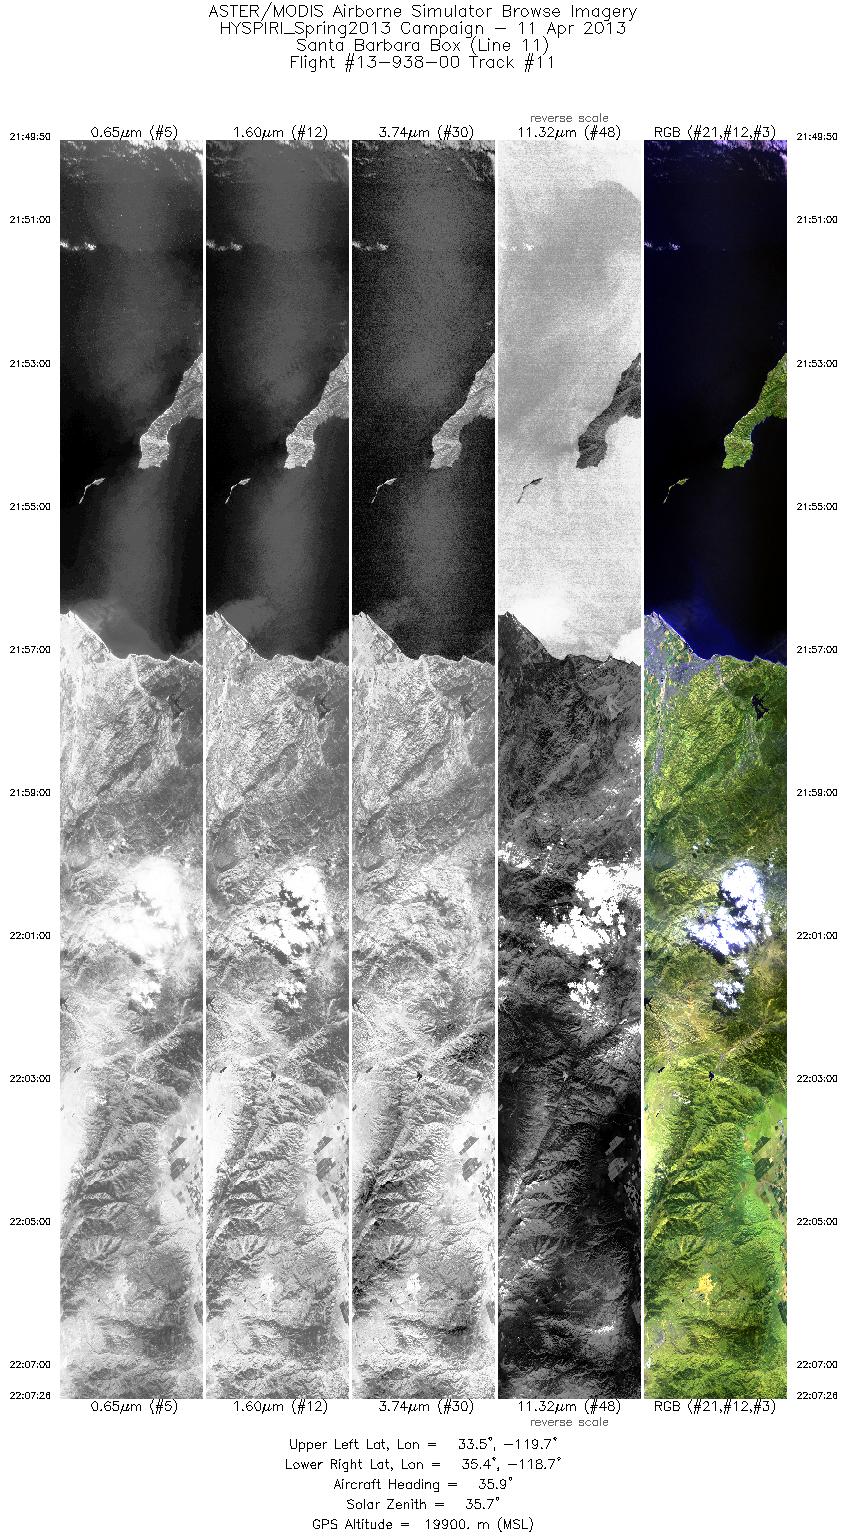
| 11 |
21:49 - 22:07 |
34.3 |
33.602 - 35.273 |
119.853 - 118.495 |
6297 |
19903 |
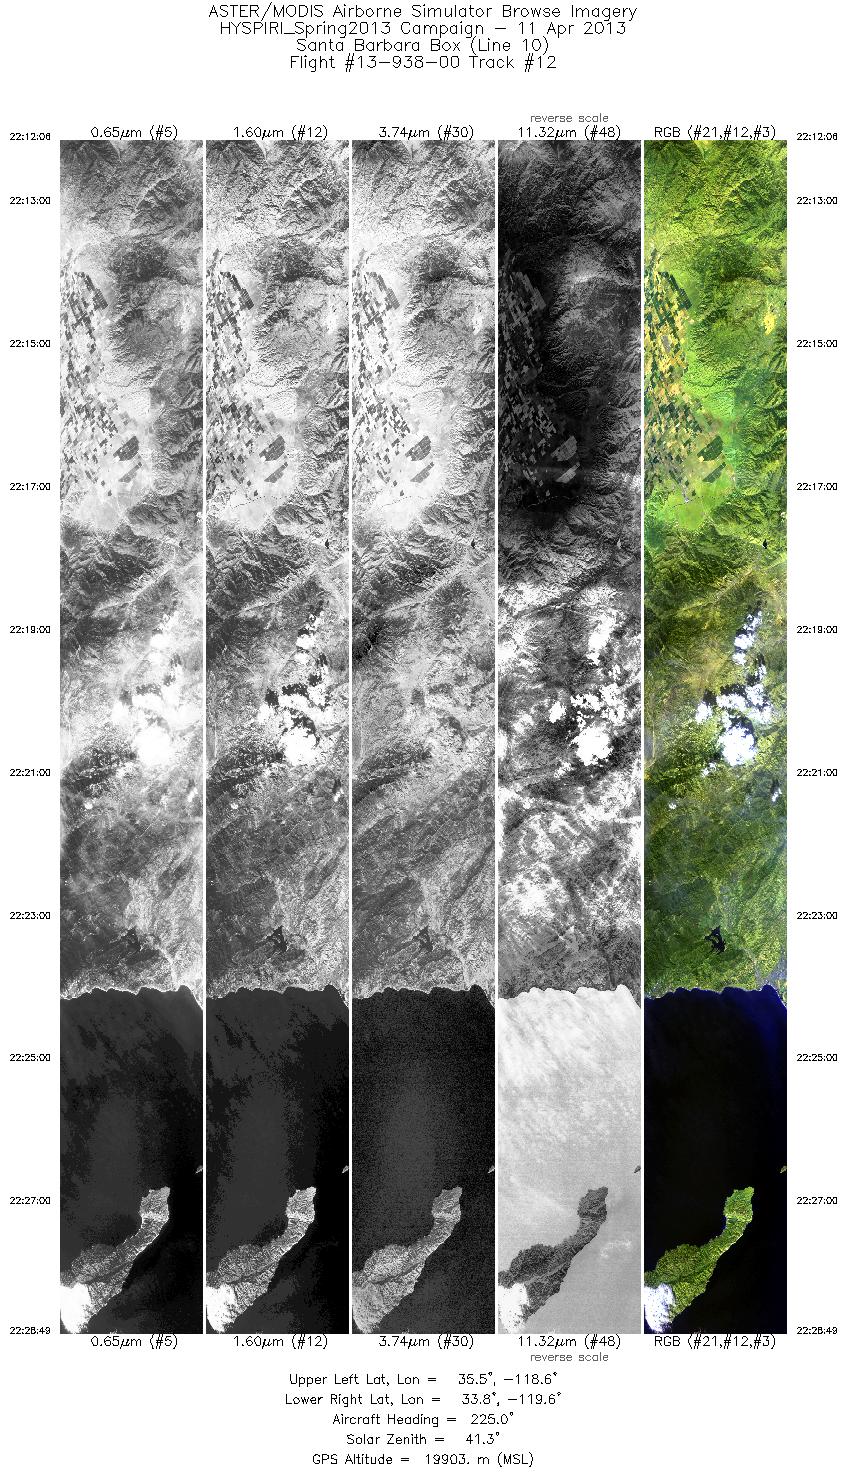
| 12 |
22:12 - 22:28 |
220.6 |
35.393 - 33.893 |
118.511 - 119.742 |
5974 |
19904 |
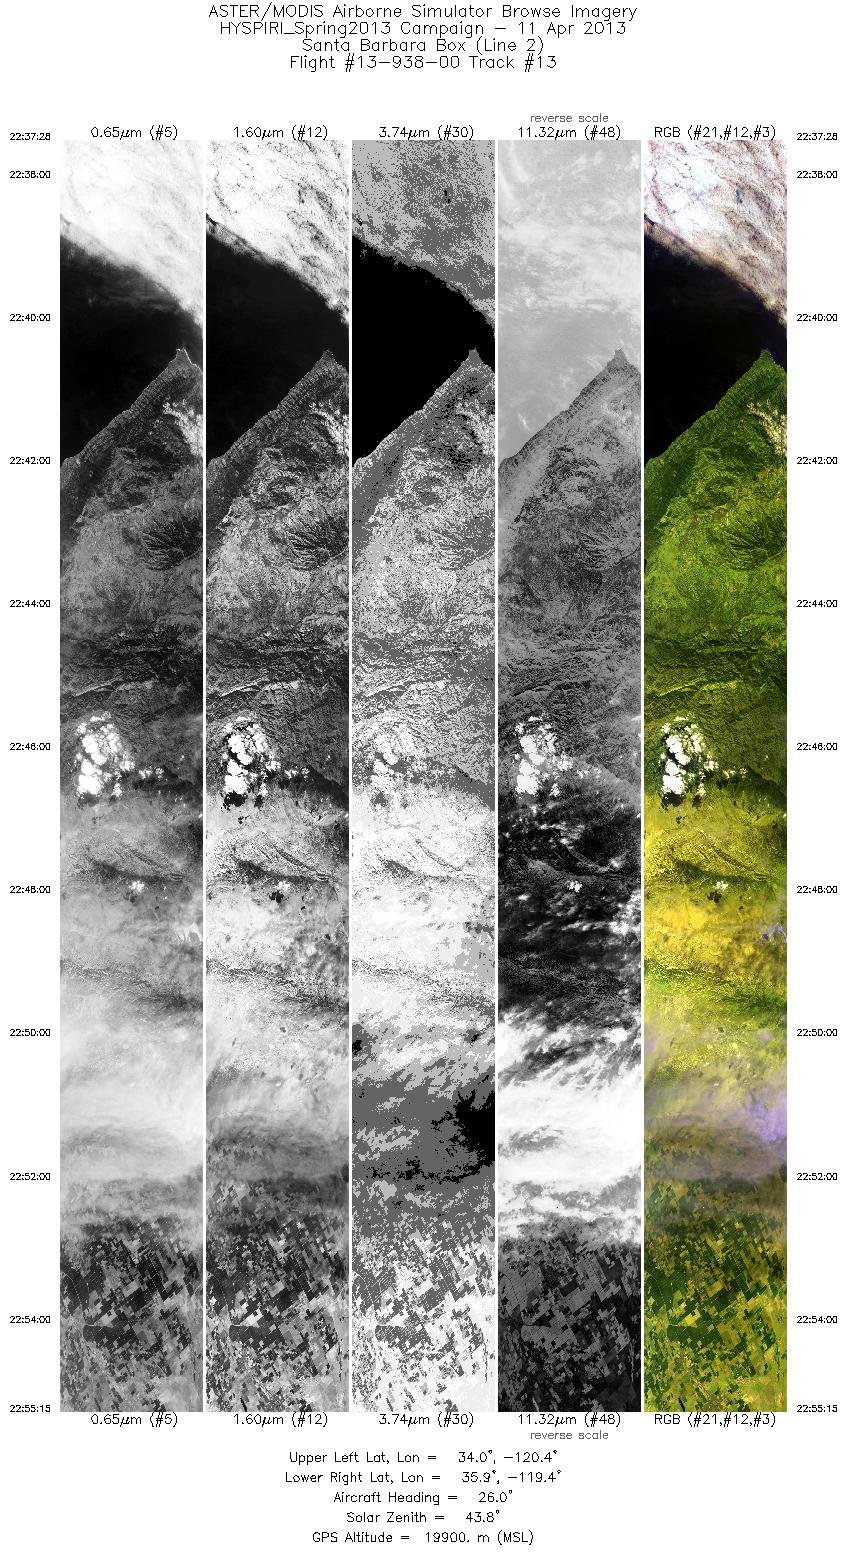
| 13 |
22:37 - 22:55 |
29.5 |
34.117 - 35.784 |
120.567 - 119.240 |
6361 |
19898 |
|


