Flight: 13-648-00
Date: September 19, 2013
Aircraft: NASA ER-2, #806
Deployment: HyspIRI Fall 2013
Flight Location: Lake Tahoe, CA / Soda Straw
Principal Investigator: Green / Hook (JPL)
Additional Sensors: AVIRIS
|
Data Evaluation
Overall data quality is good.
Channels 41 and 45 are severely limited by noise artifacts
All data collected @6.25Hz
|
Processing Information
Level-1B Data in HDF format is available
Flight Line Summary
Spectral Band Configuration
Spectral Response Function Table
Spectral Response Function (text)
|
Browse Imagery
Flight Tracks: 13
Scanlines: 72280
|
Browse Imagery Table
|
Click a Flight Track number to view a quicklook image
Lat/Lon ranges are for the BEG-END scanline nadir pixels
|
Flight
Track |
Time Span
(UTC) |
Heading
(Deg) |
Lat Range
(Deg N) |
Lon Range
(Deg W) |
Length
(Scanlines) |
Altitude
(Meters) |
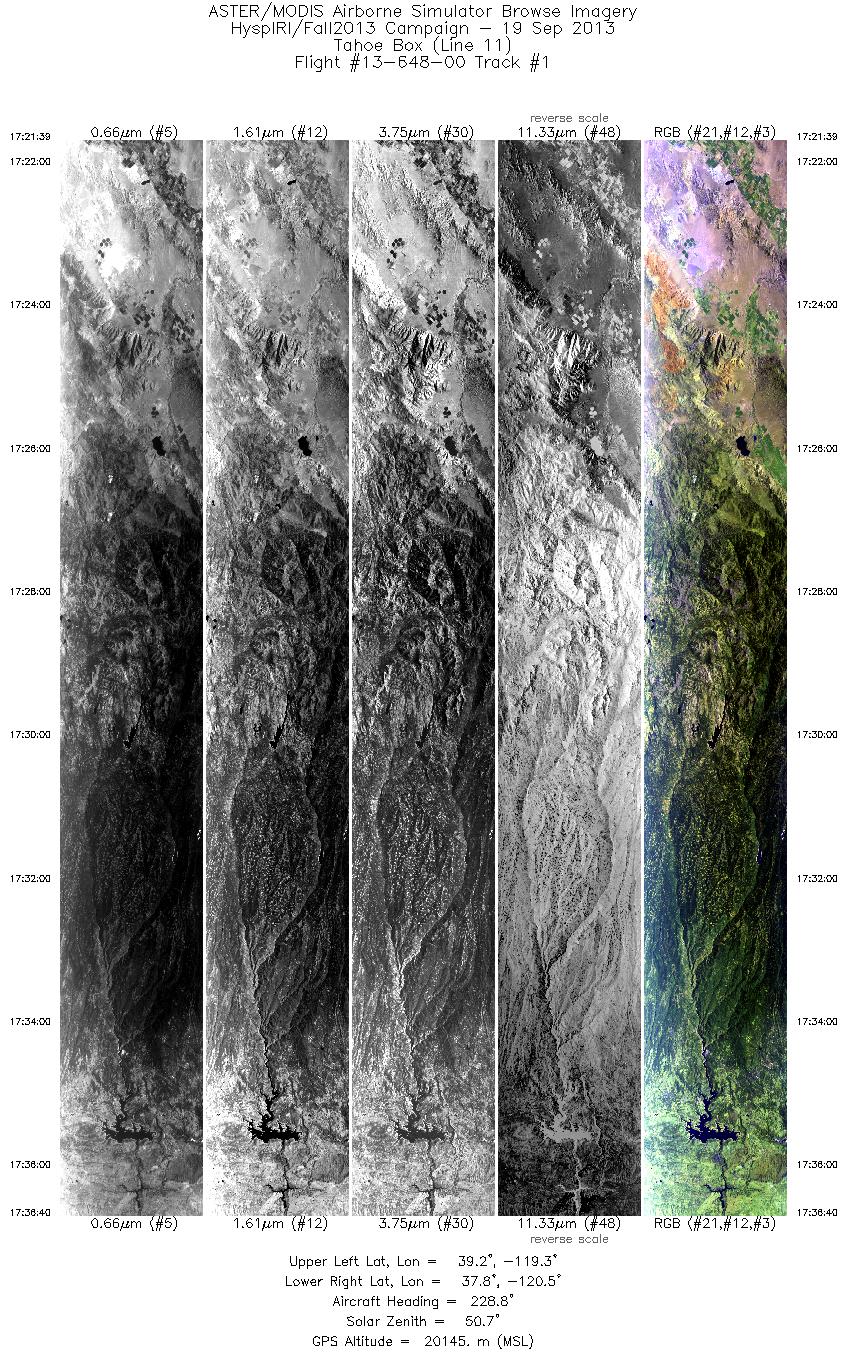
| 1 |
17:21 - 17:36 |
227.7 |
39.045 - 37.876 |
119.157 - 120.628 |
5381 |
20150 |
| 2 |
17:40 - 17:54 |
39.3 |
37.917 - 39.015 |
120.864 - 119.490 |
4889 |
20128 |
| 3 |
17:58 - 18:12 |
222.8 |
39.232 - 38.111 |
119.511 - 120.916 |
5173 |
20138 |
| 4 |
18:17 - 18:31 |
39.6 |
38.100 - 39.238 |
121.218 - 119.803 |
5039 |
20127 |
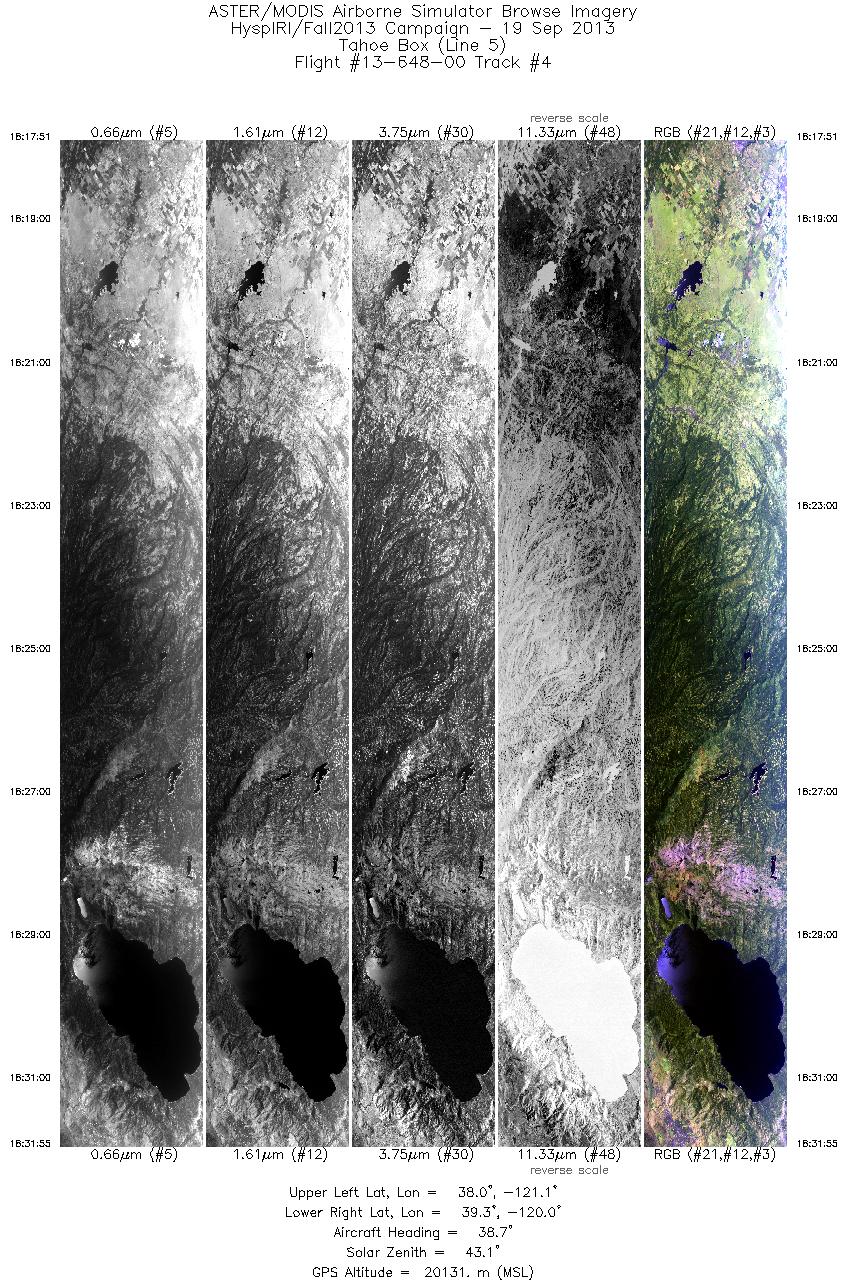
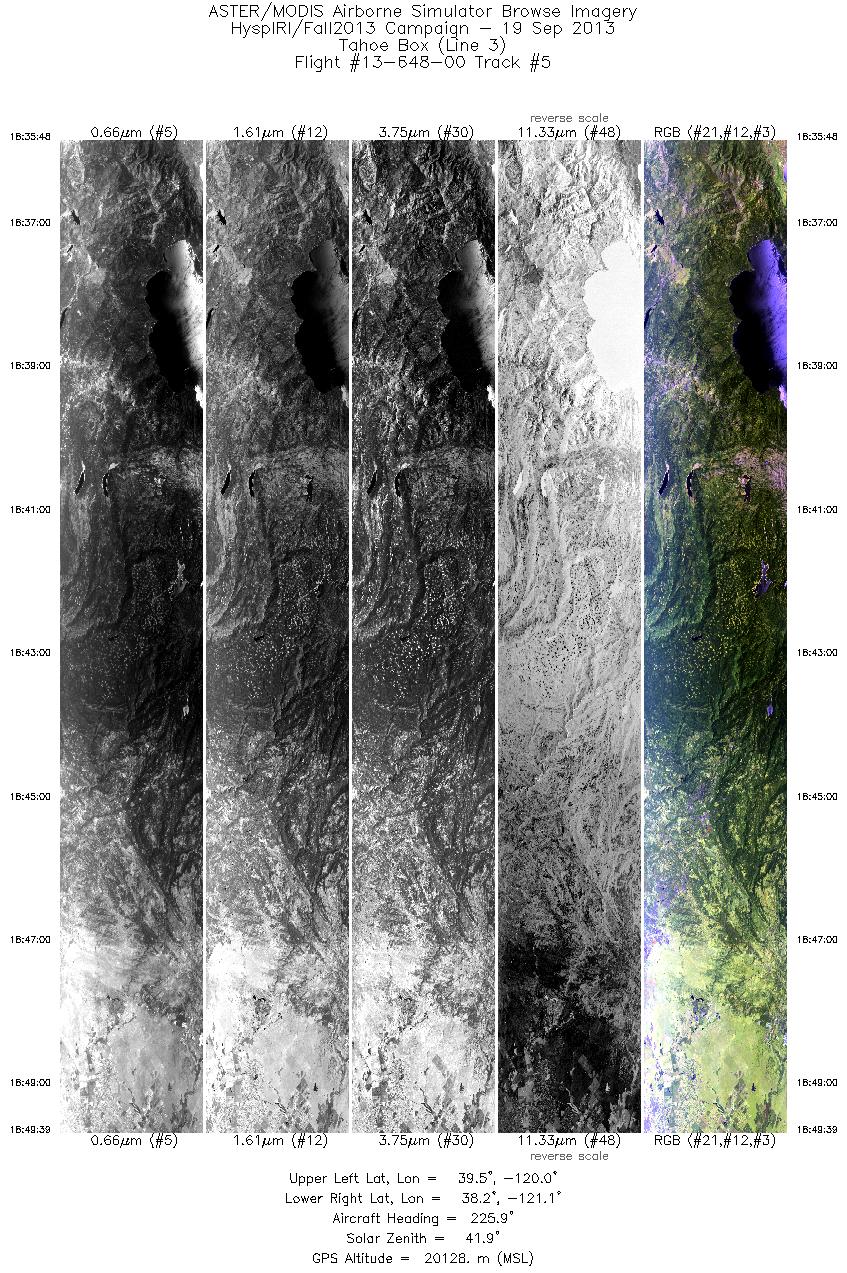
| 5 |
18:35 - 18:49 |
224.4 |
39.408 - 38.337 |
119.889 - 121.227 |
4967 |
20118 |
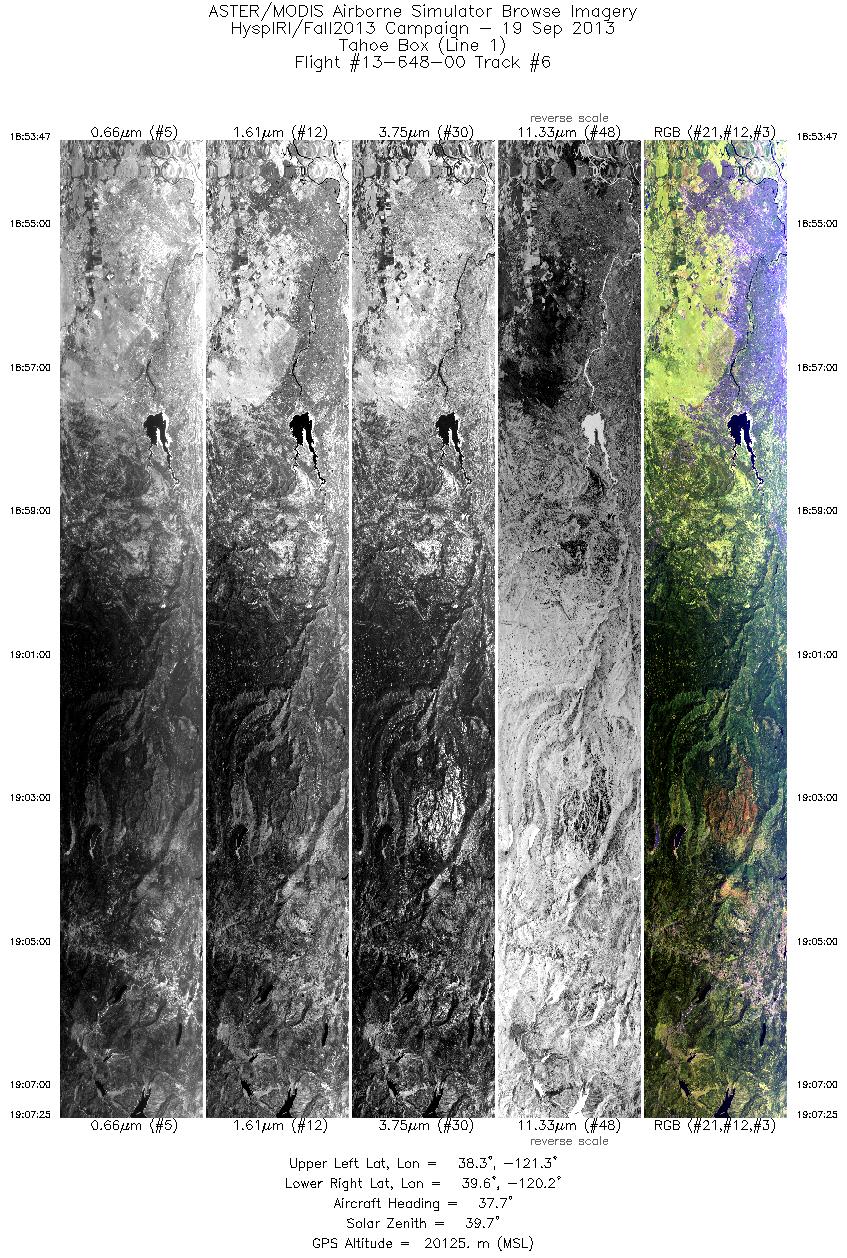
| 6 |
18:53 - 19:07 |
39.2 |
38.365 - 39.480 |
121.490 - 120.104 |
4891 |
20132 |
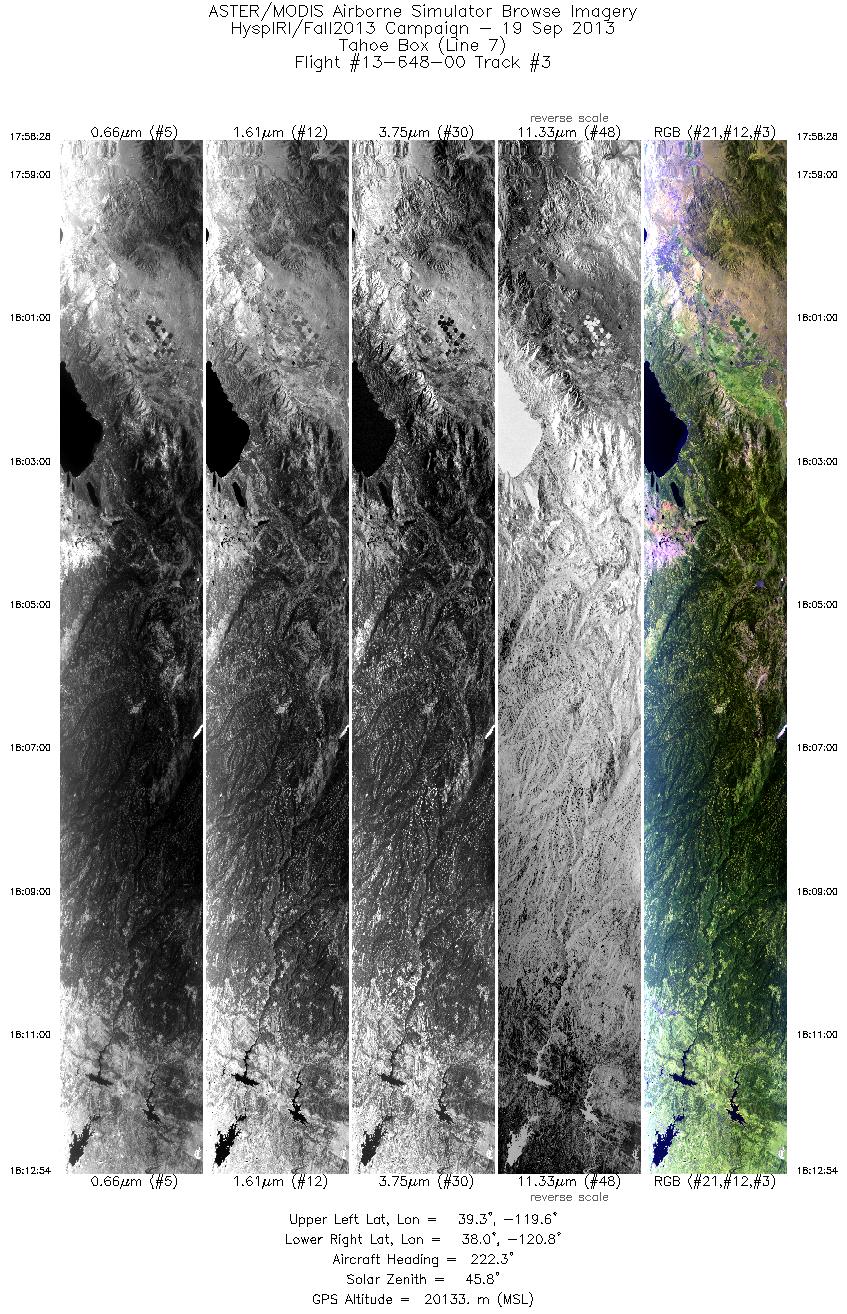
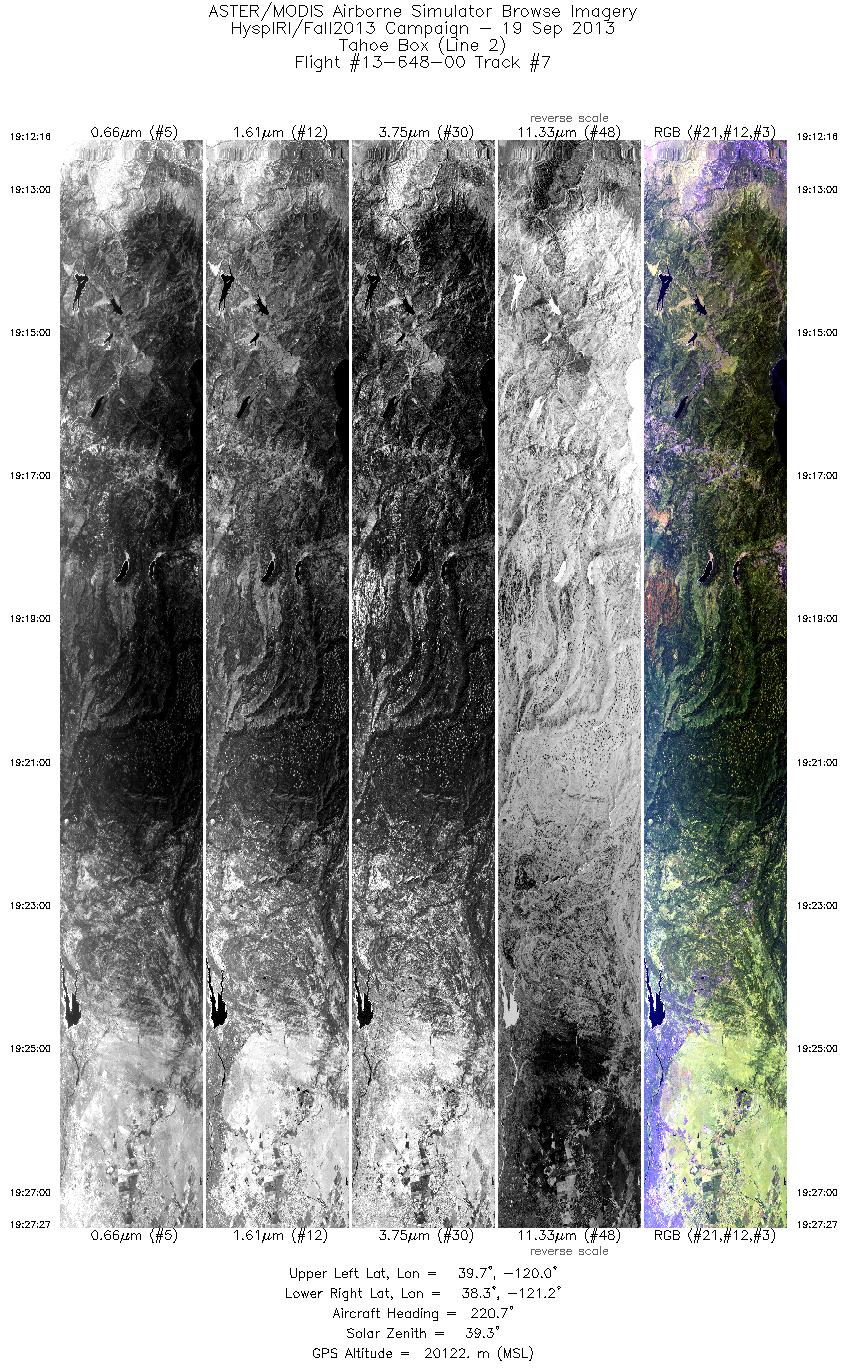
| 7 |
19:12 - 19:27 |
221.8 |
39.564 - 38.396 |
119.845 - 121.302 |
5442 |
20120 |
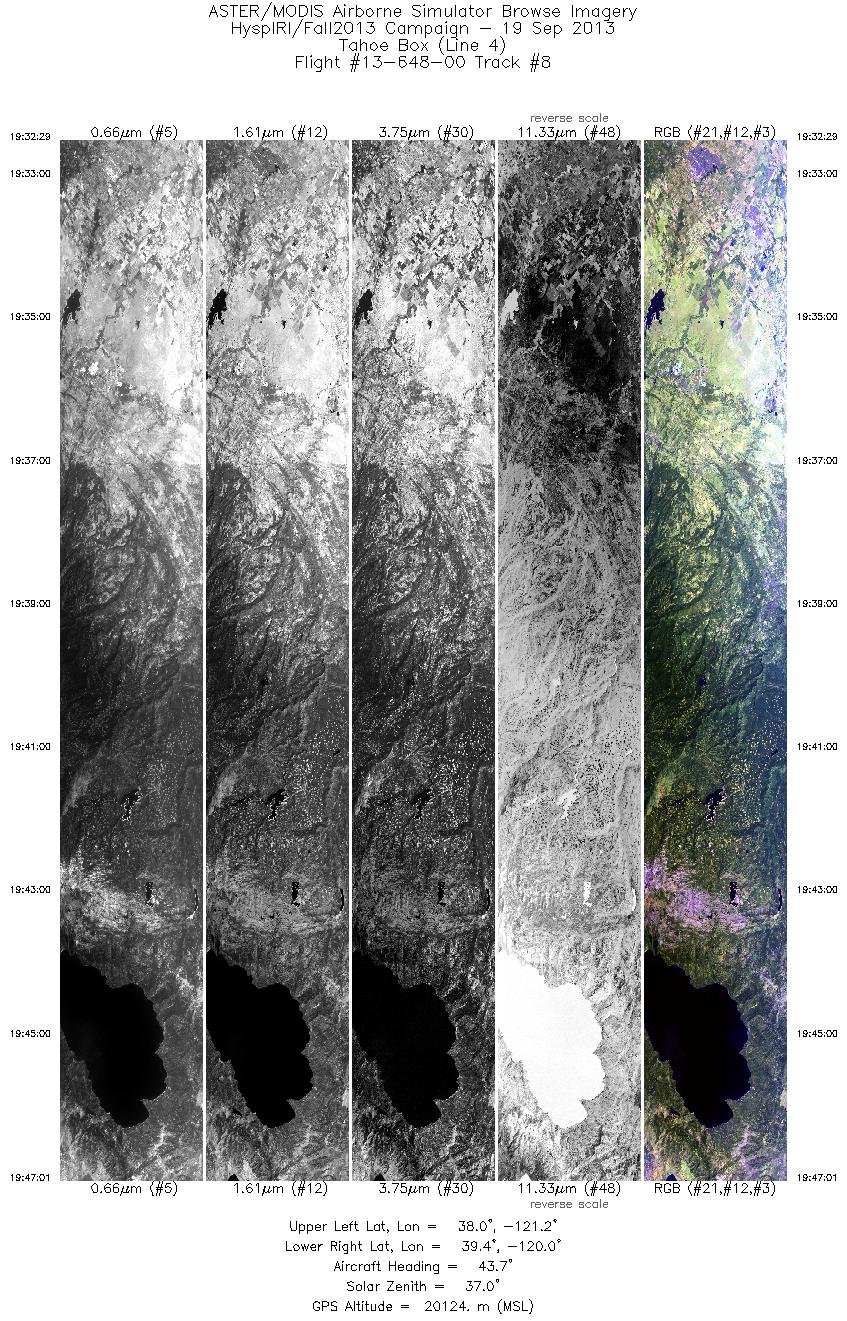
| 8 |
19:32 - 19:47 |
42.3 |
38.123 - 39.303 |
121.334 - 119.870 |
5209 |
20140 |
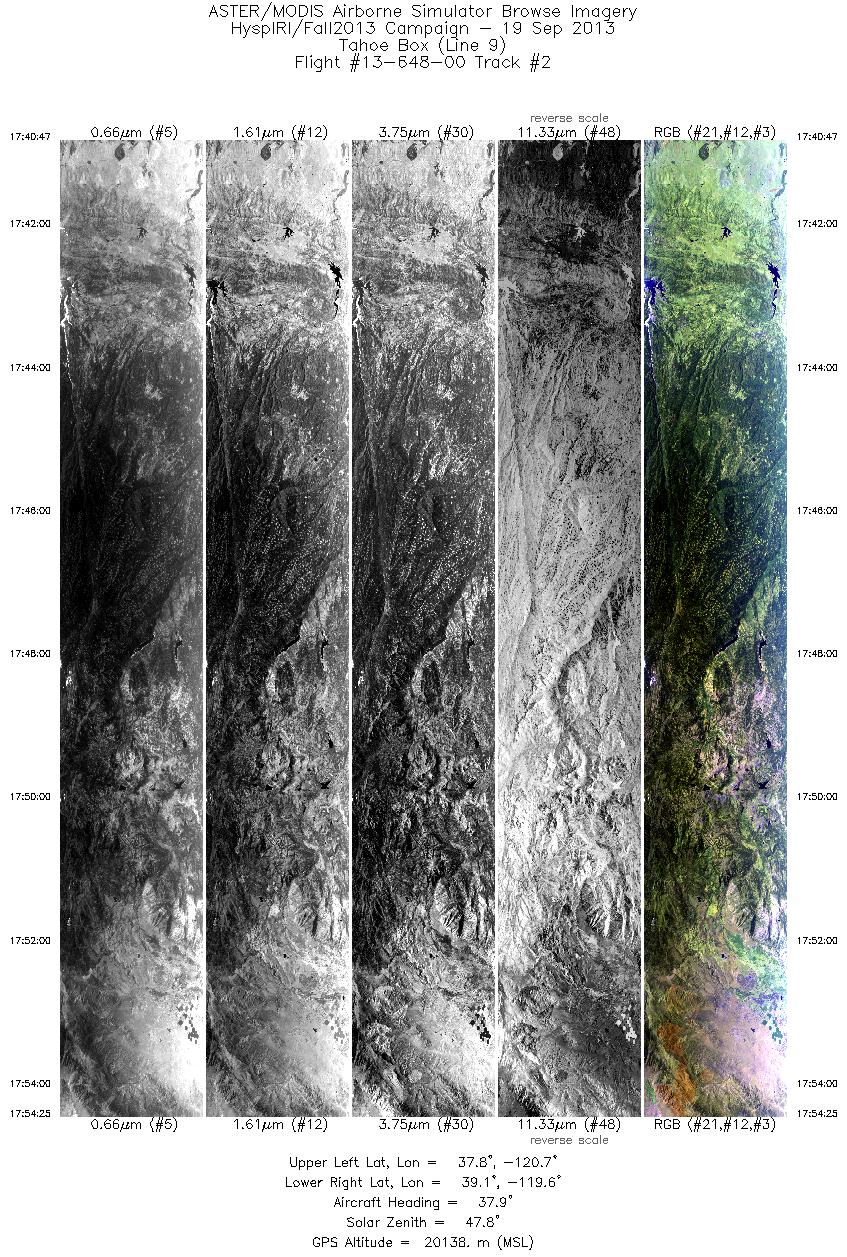
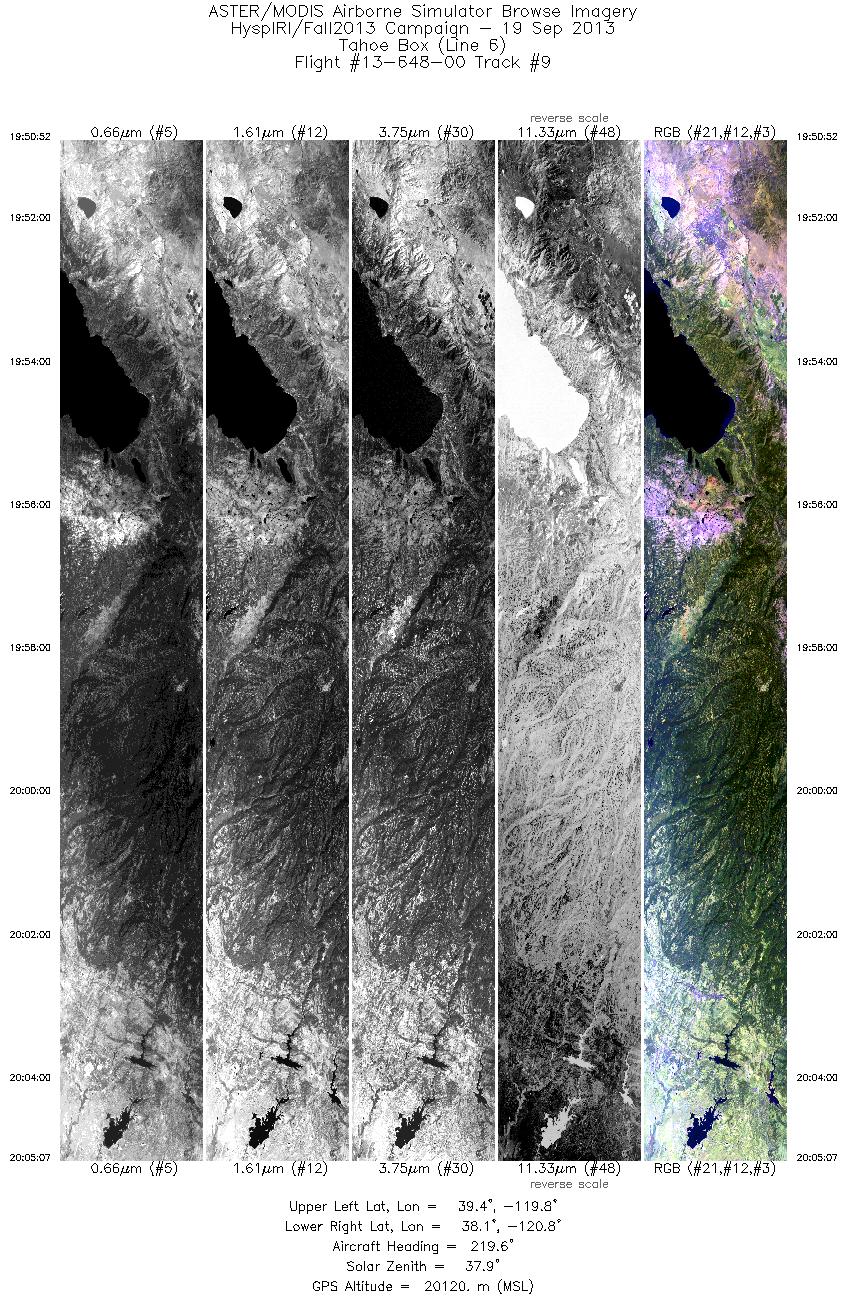
| 9 |
19:50 - 20:05 |
221.3 |
39.262 - 38.164 |
119.625 - 120.998 |
5109 |
20112 |
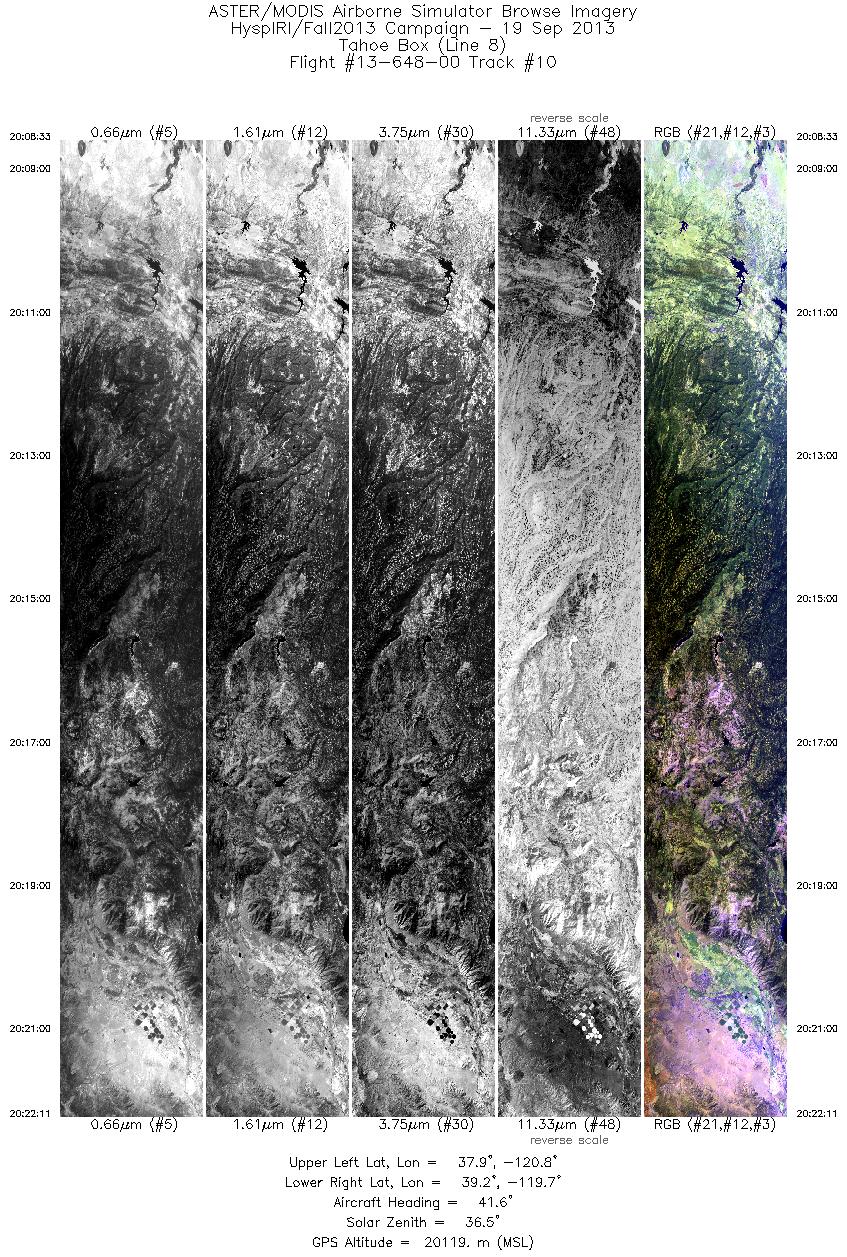
| 10 |
20:08 - 20:22 |
41.3 |
37.982 - 39.072 |
120.931 - 119.568 |
4889 |
20123 |
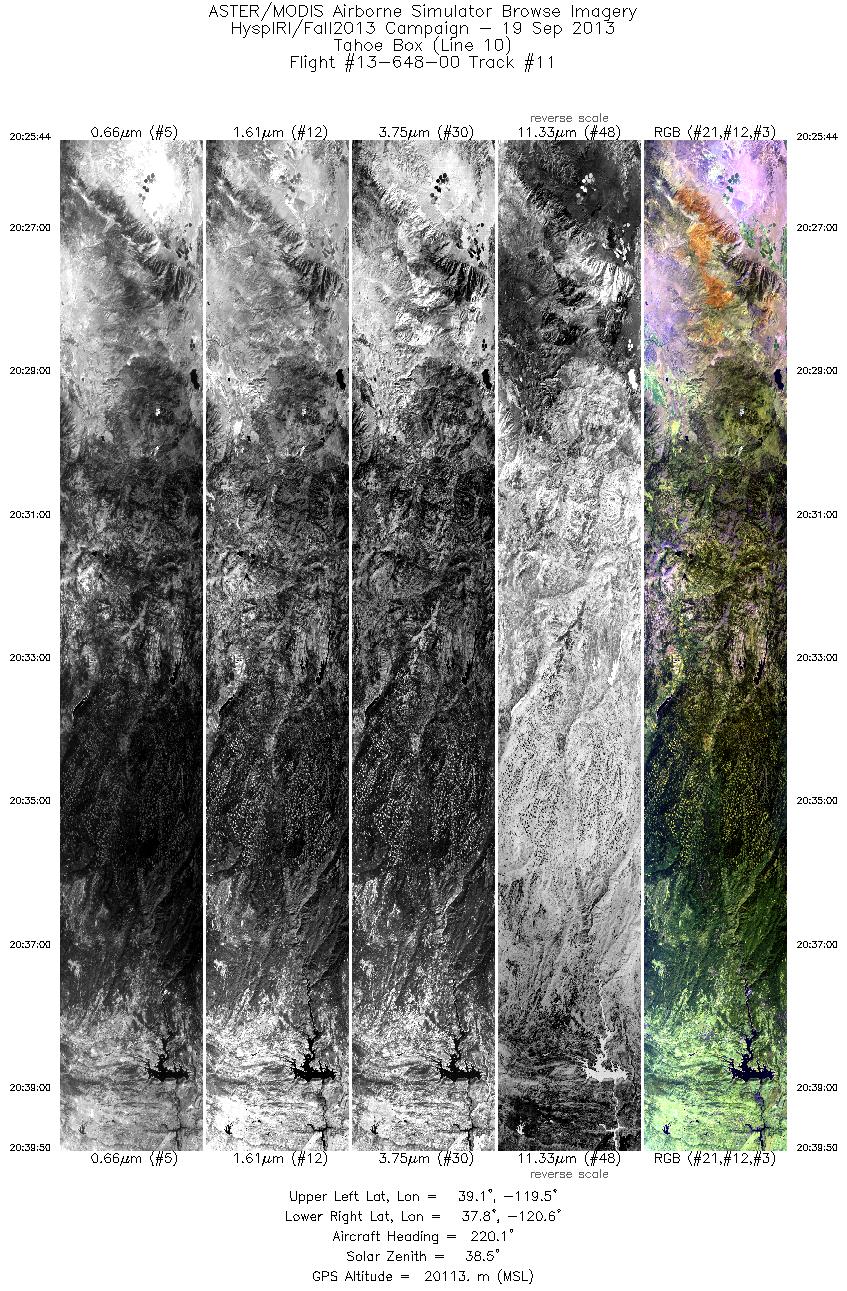
| 11 |
20:25 - 20:39 |
221.8 |
39.032 - 37.936 |
119.324 - 120.696 |
5056 |
20118 |
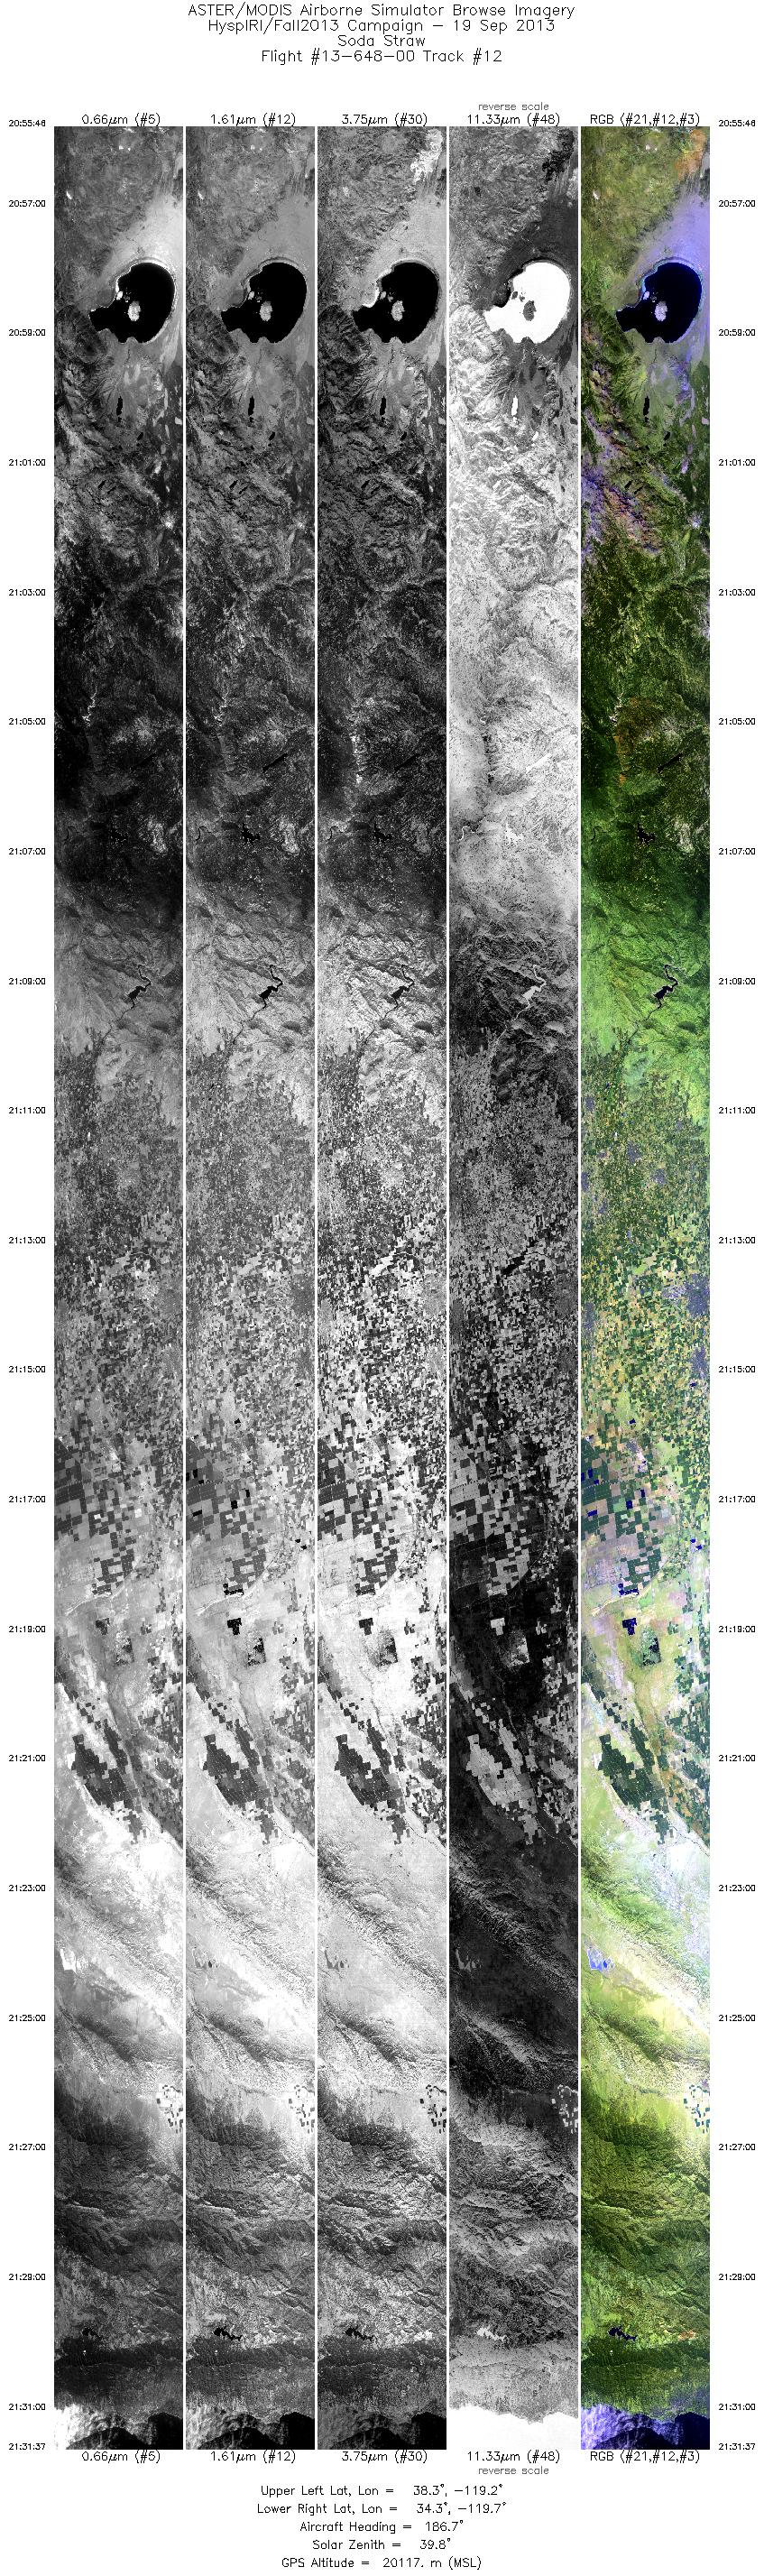
| 12 |
20:55 - 21:31 |
189.2 |
38.306 - 34.368 |
118.998 - 119.928 |
12875 |
20126 |
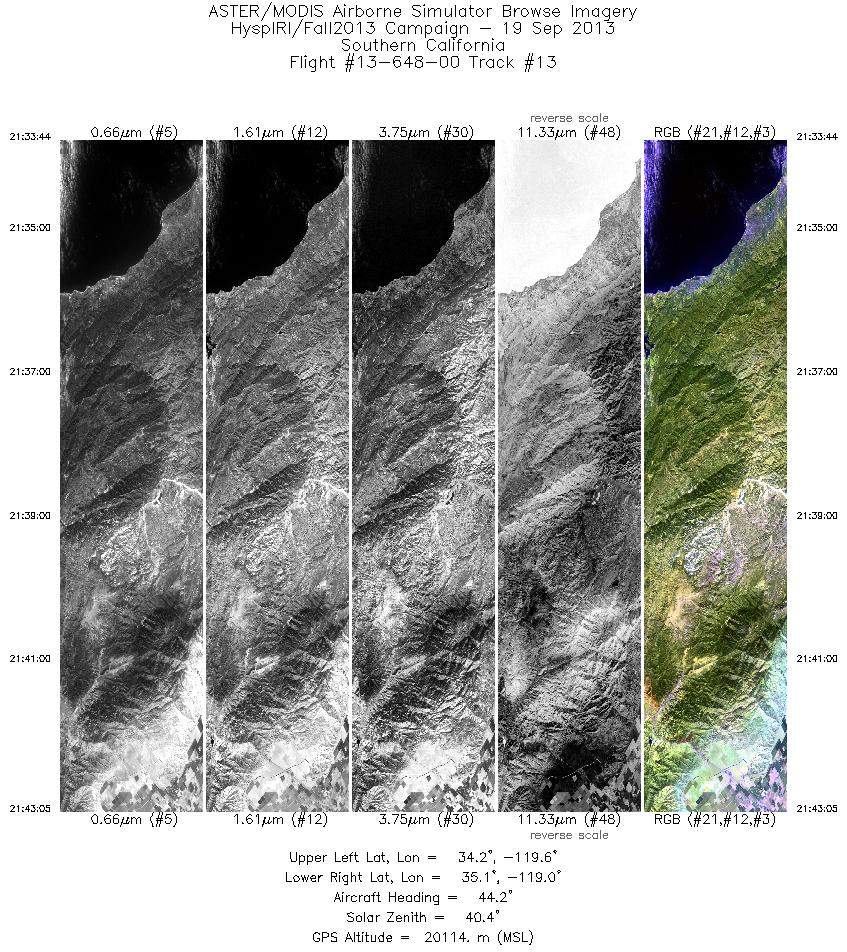
| 13 |
21:33 - 21:43 |
44.2 |
34.280 - 35.011 |
119.744 - 118.873 |
3360 |
20121 |
|


