Flight: 13-628-00
Date: June 6, 2013
Aircraft: NASA ER2, #806
Deployment: HyspIRI Late Spring 2013
Flight Location: Santa Barbara, CA
Principal Investigator: Green / Hook (JPL)
Additional Sensors: AVIRIS
|
Data Evaluation
Overall data quality is good.
All data collected @6.25Hz
|
Processing Information
Level-1B Data in HDF format is available
Flight Line Summary
Spectral Band Configuration
Spectral Response Function Table
Spectral Response Function (text)
|
Browse Imagery
Flight Tracks: 14
Scanlines: 94338
|
Browse Imagery Table
|
Click a Flight Track number to view a quicklook image
Lat/Lon ranges are for the BEG-END scanline nadir pixels
|
Flight
Track |
Time Span
(UTC) |
Heading
(Deg) |
Lat Range
(Deg N) |
Lon Range
(Deg W) |
Length
(Scanlines) |
Altitude
(Meters) |
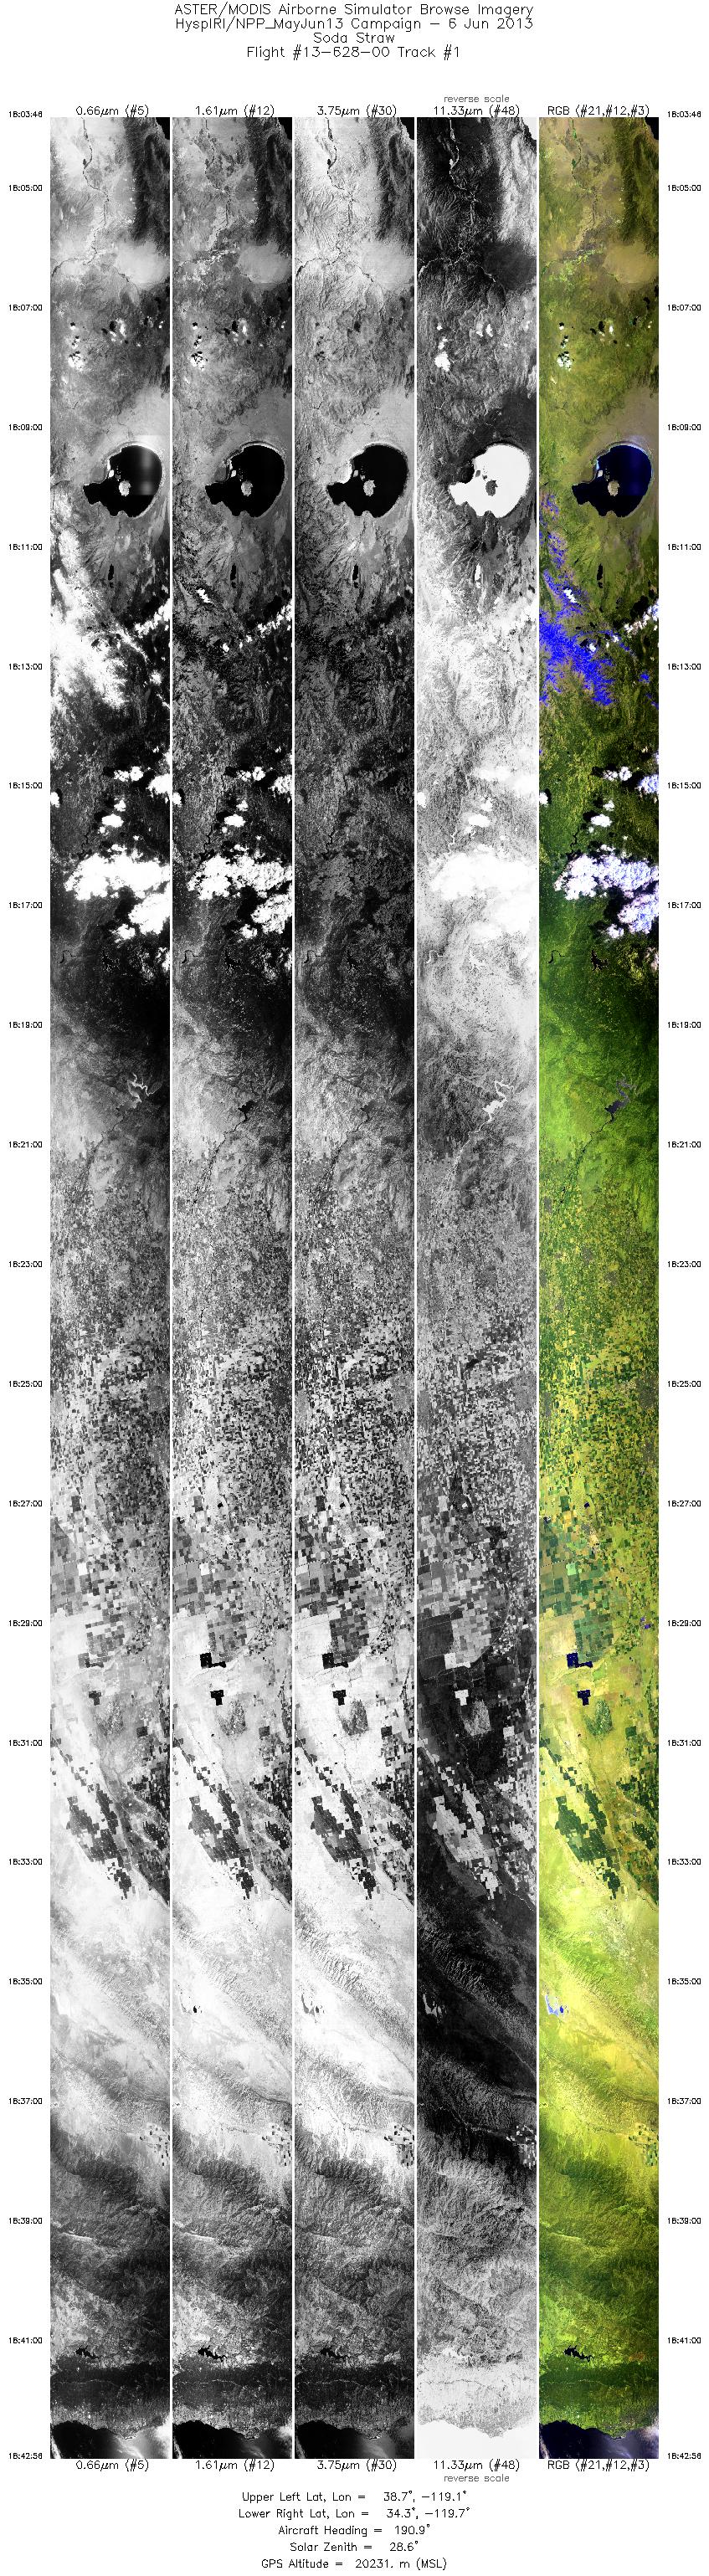
| 1 |
18:03 - 18:42 |
190.3 |
38.693 - 34.375 |
118.902 - 119.925 |
13994 |
19995 |
| 2 |
18:51 - 19:11 |
38.1 |
33.768 - 35.459 |
120.217 - 118.851 |
7006 |
20228 |
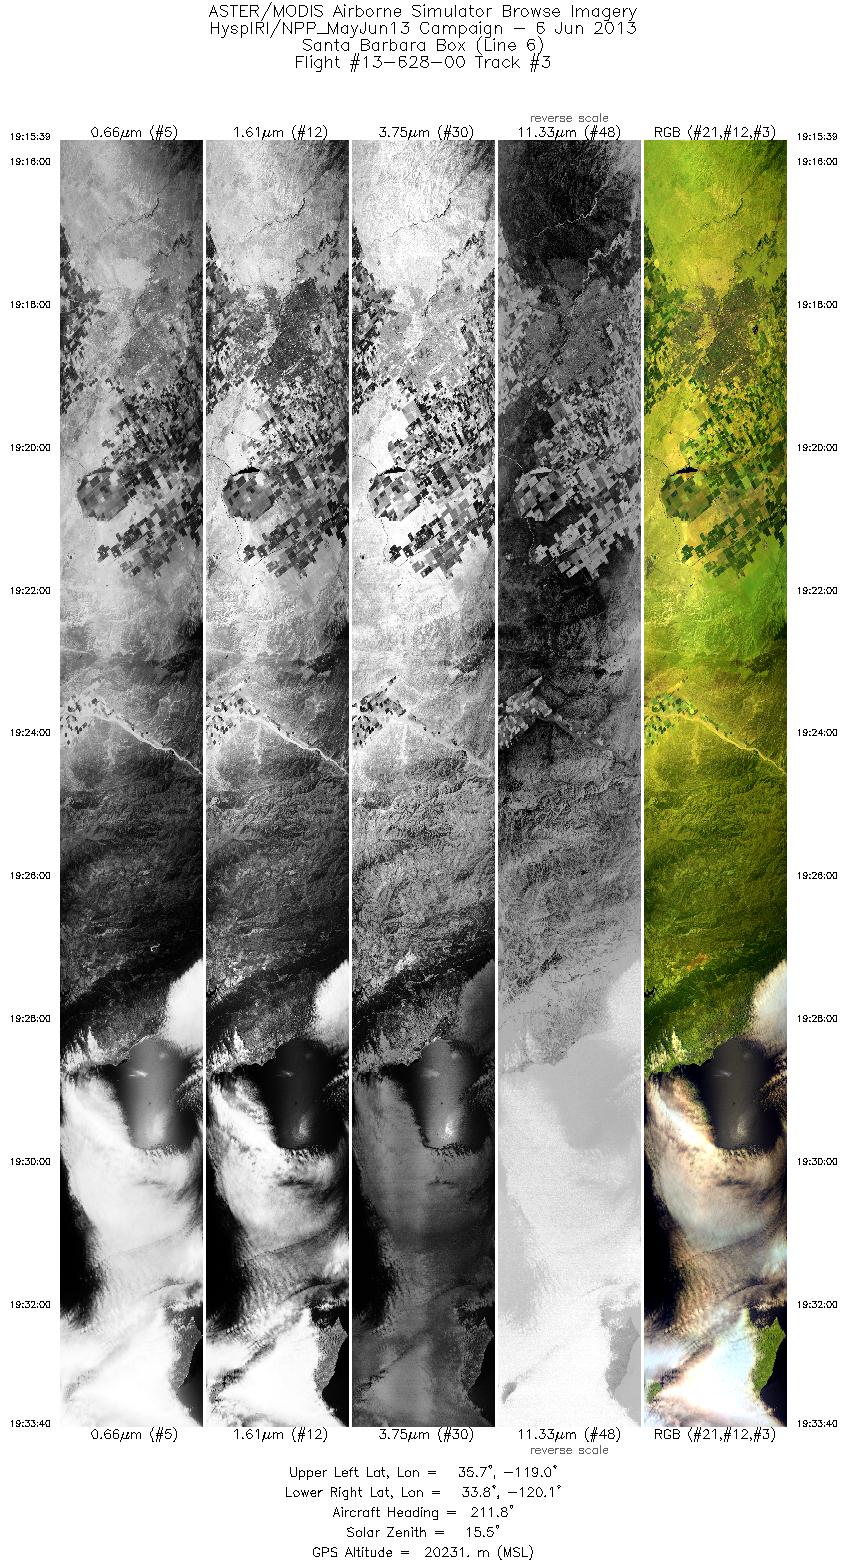
| 3 |
19:15 - 19:33 |
212.7 |
35.626 - 33.906 |
118.840 - 120.234 |
6435 |
20215 |
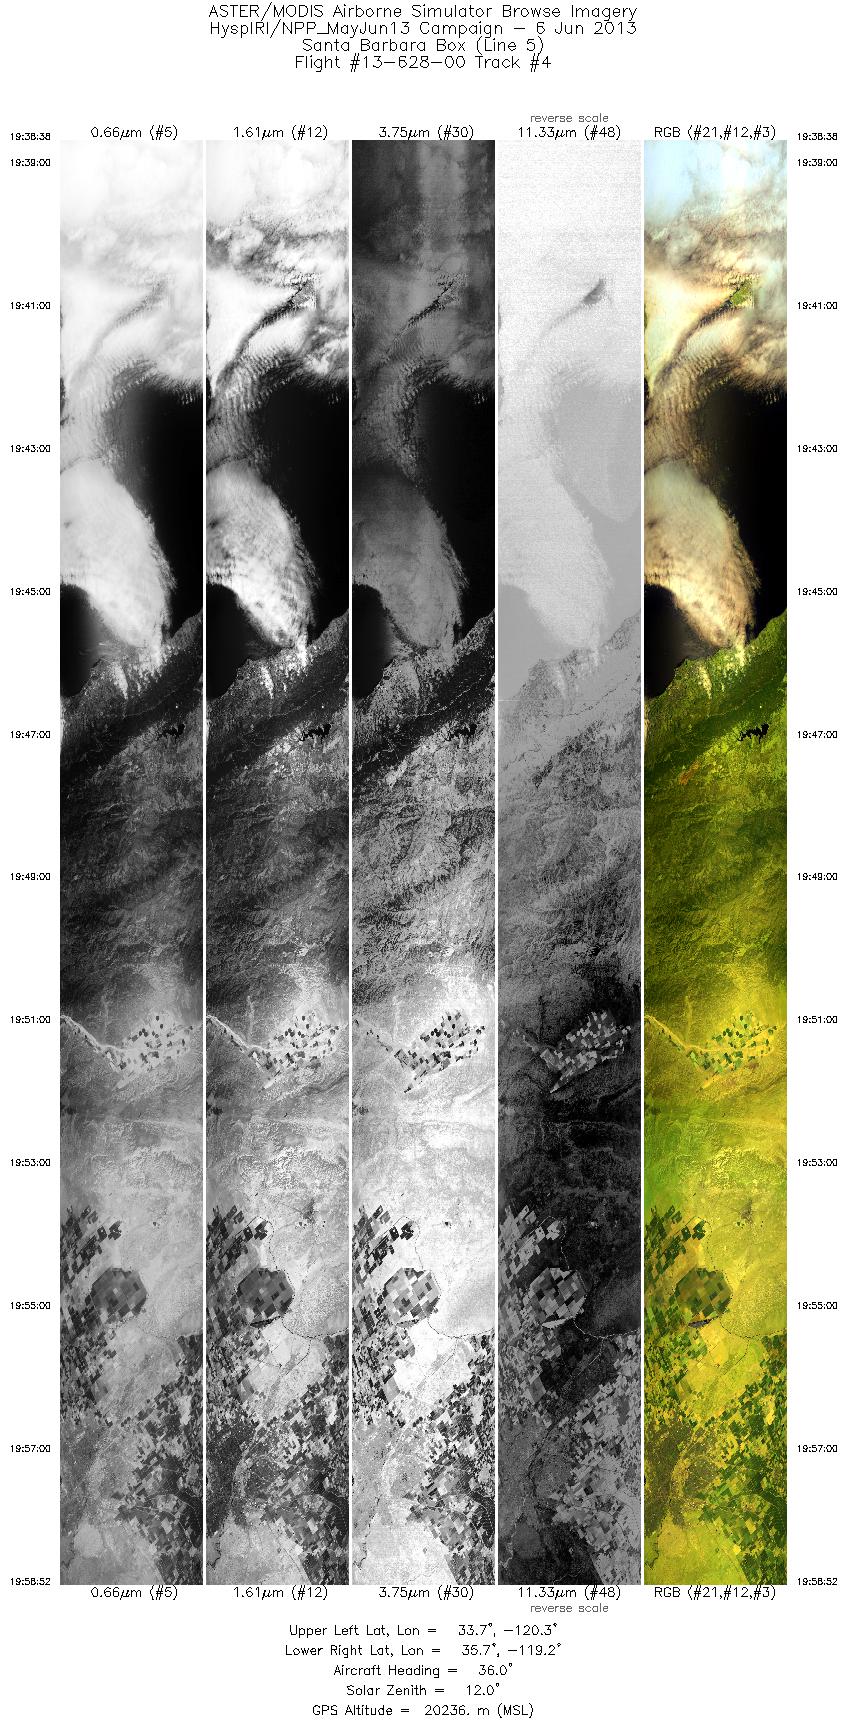
| 4 |
19:38 - 19:58 |
36.6 |
33.813 - 35.558 |
120.436 - 119.033 |
7227 |
20249 |
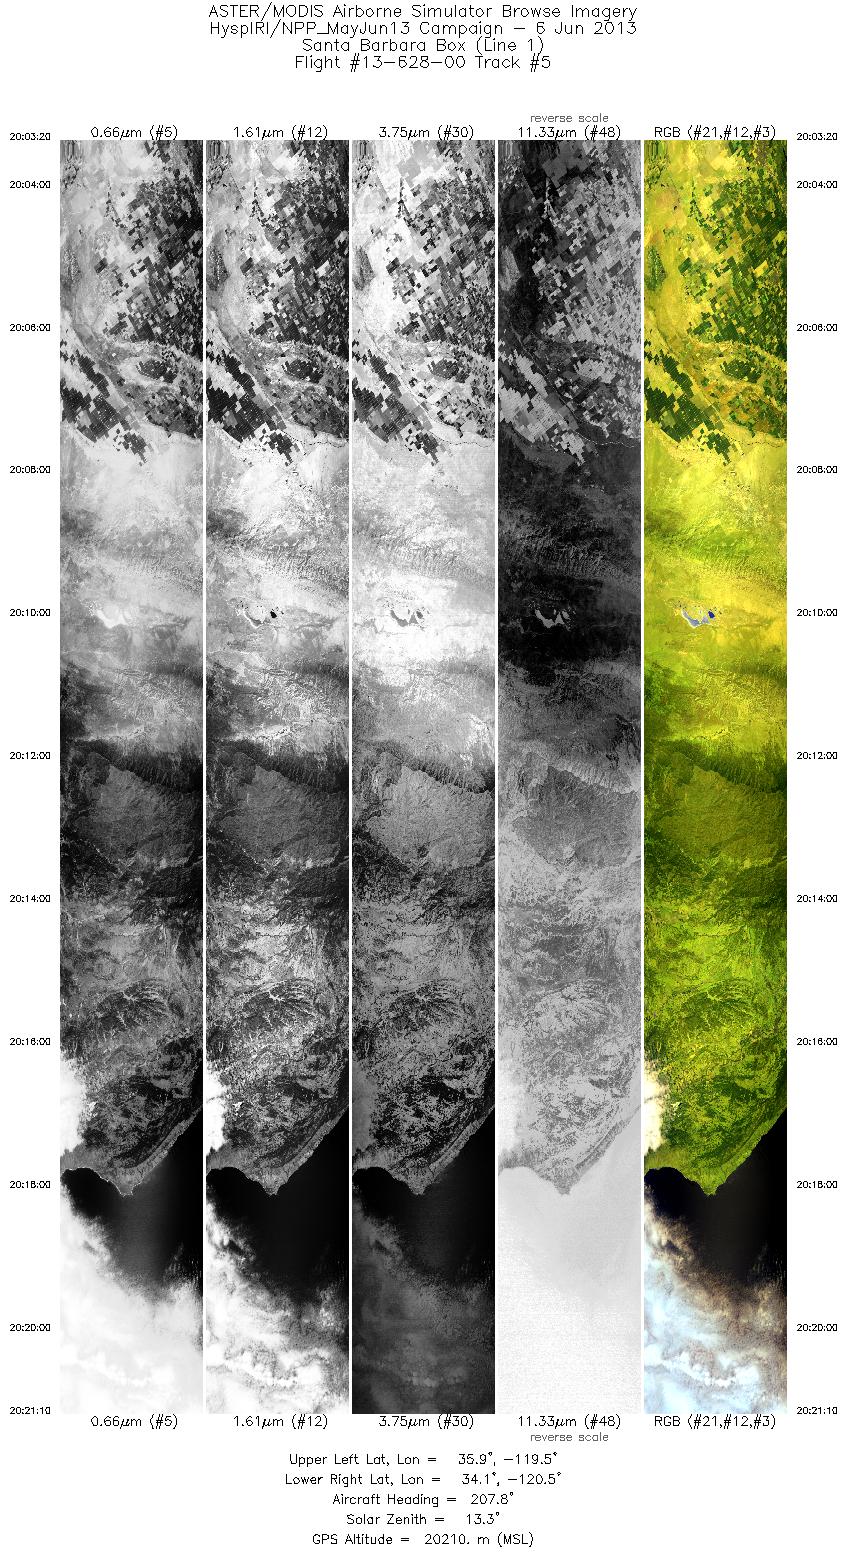
| 5 |
20:03 - 20:21 |
209.0 |
35.840 - 34.146 |
119.330 - 120.686 |
6374 |
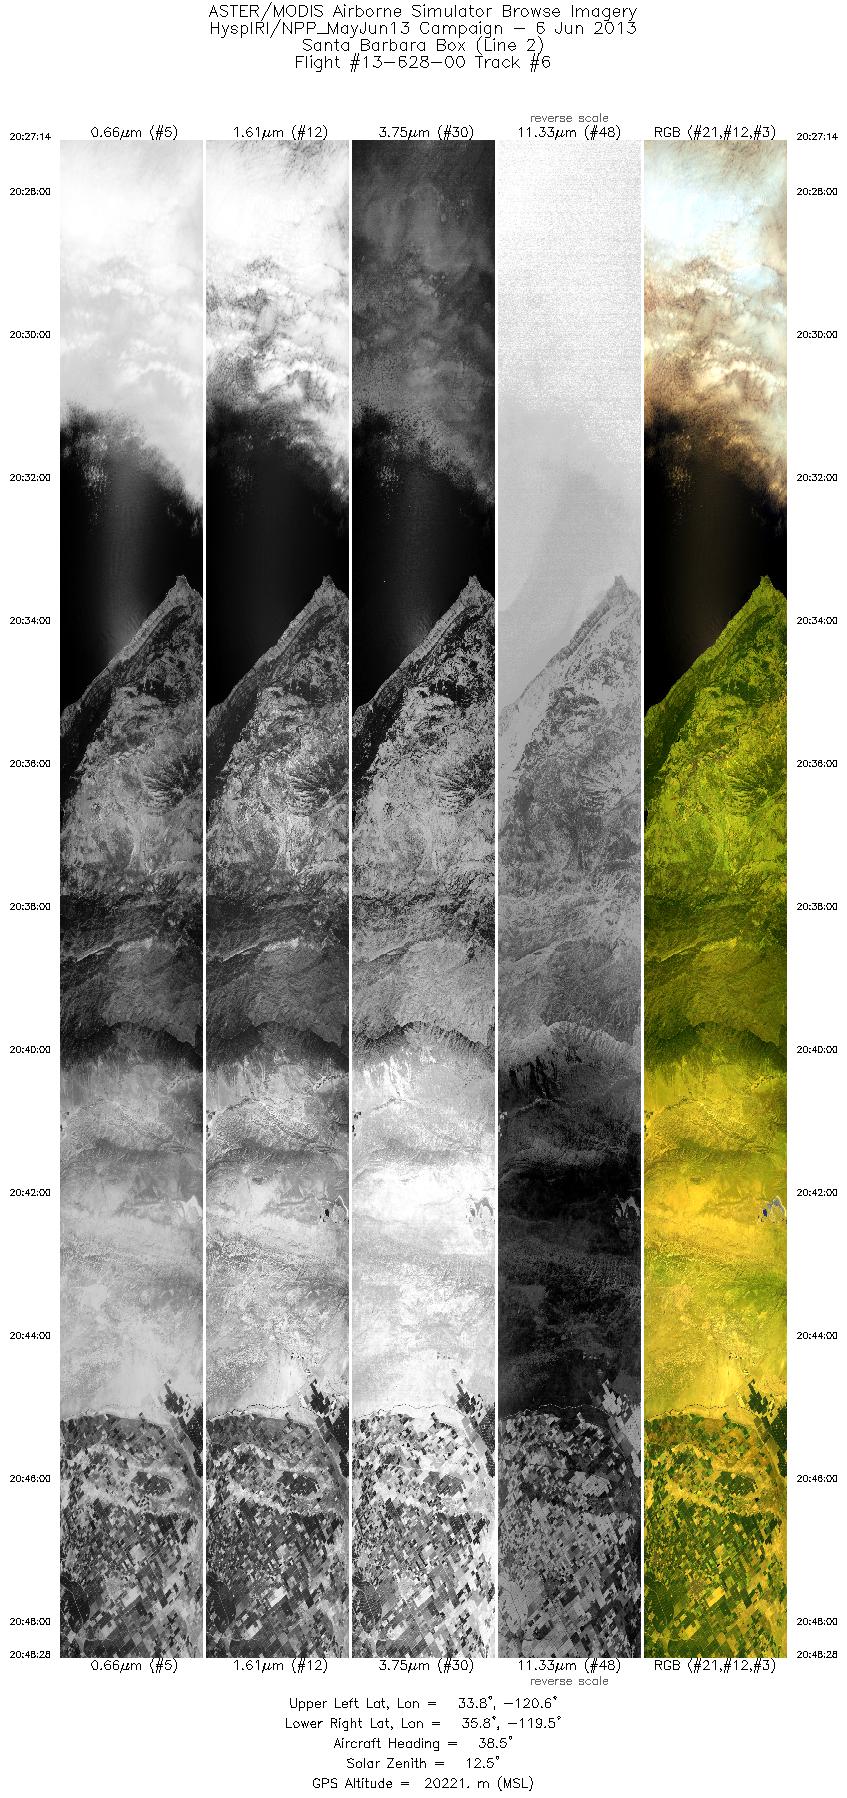
20212 |
| 6 |
20:27 - 20:48 |
36.1 |
33.860 - 35.701 |
120.777 - 119.309 |
7594 |
20193 |
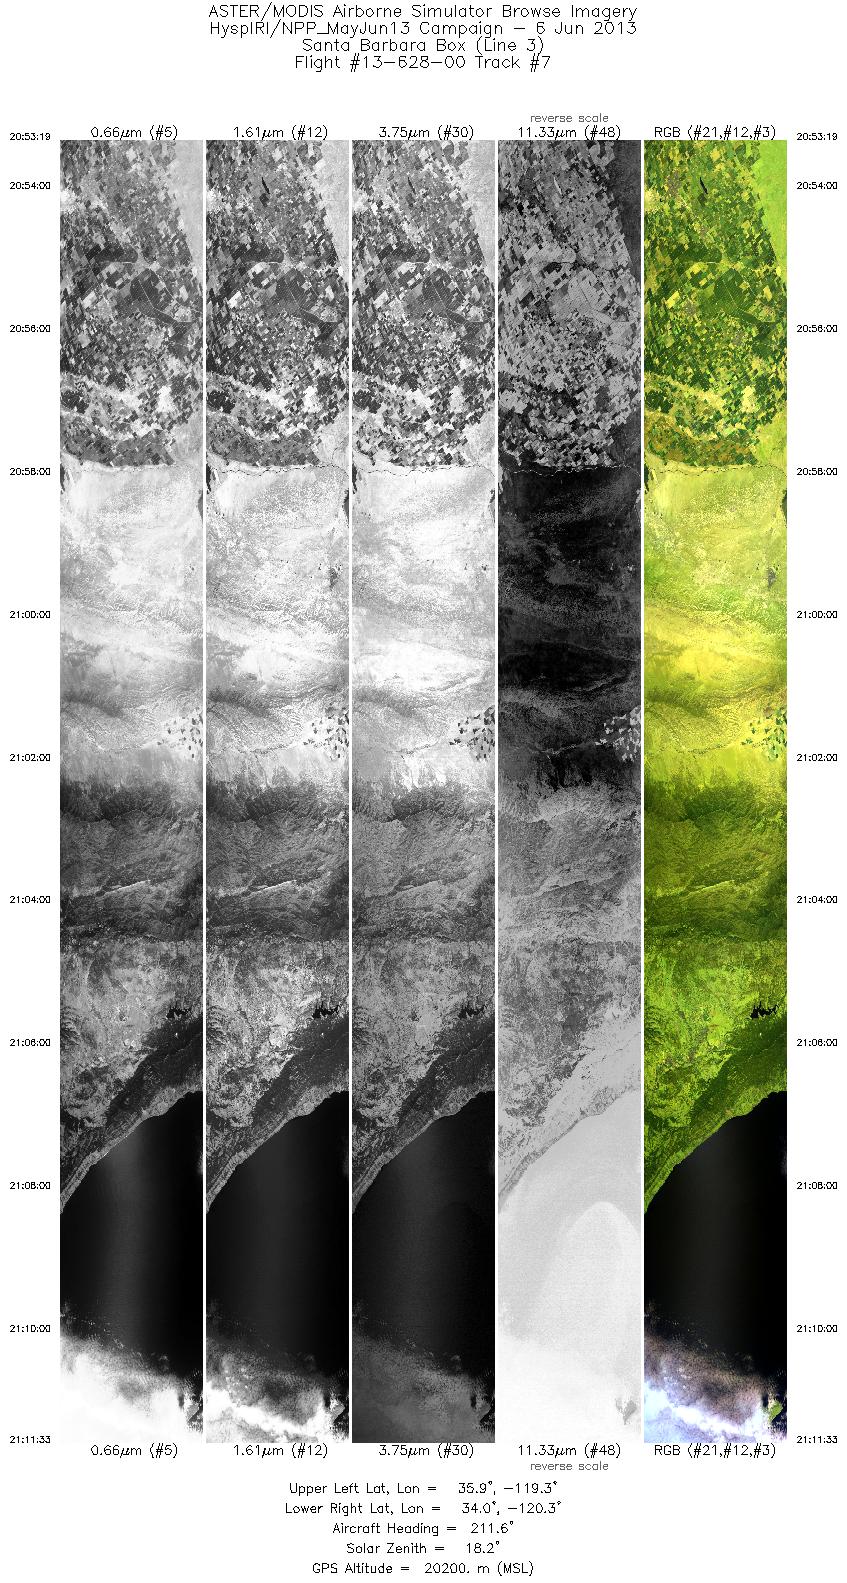
| 7 |
20:53 - 21:11 |
212.3 |
35.786 - 34.051 |
119.108 - 120.503 |
6519 |
20201 |
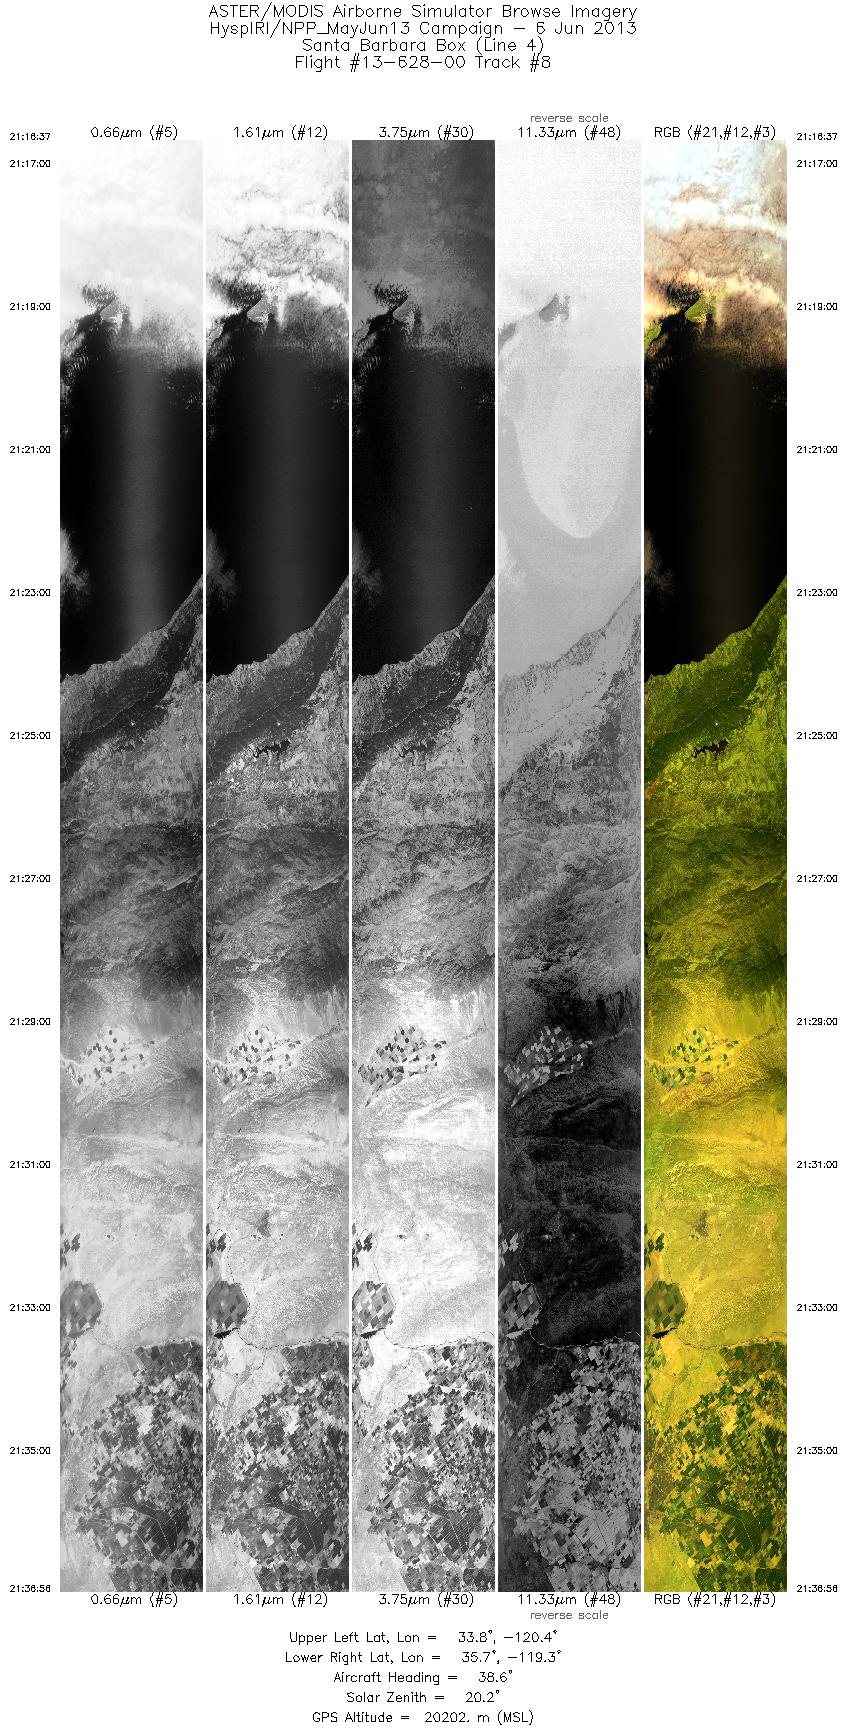
| 8 |
21:16 - 21:36 |
37.4 |
33.850 - 35.603 |
120.537 - 119.125 |
7260 |
20211 |
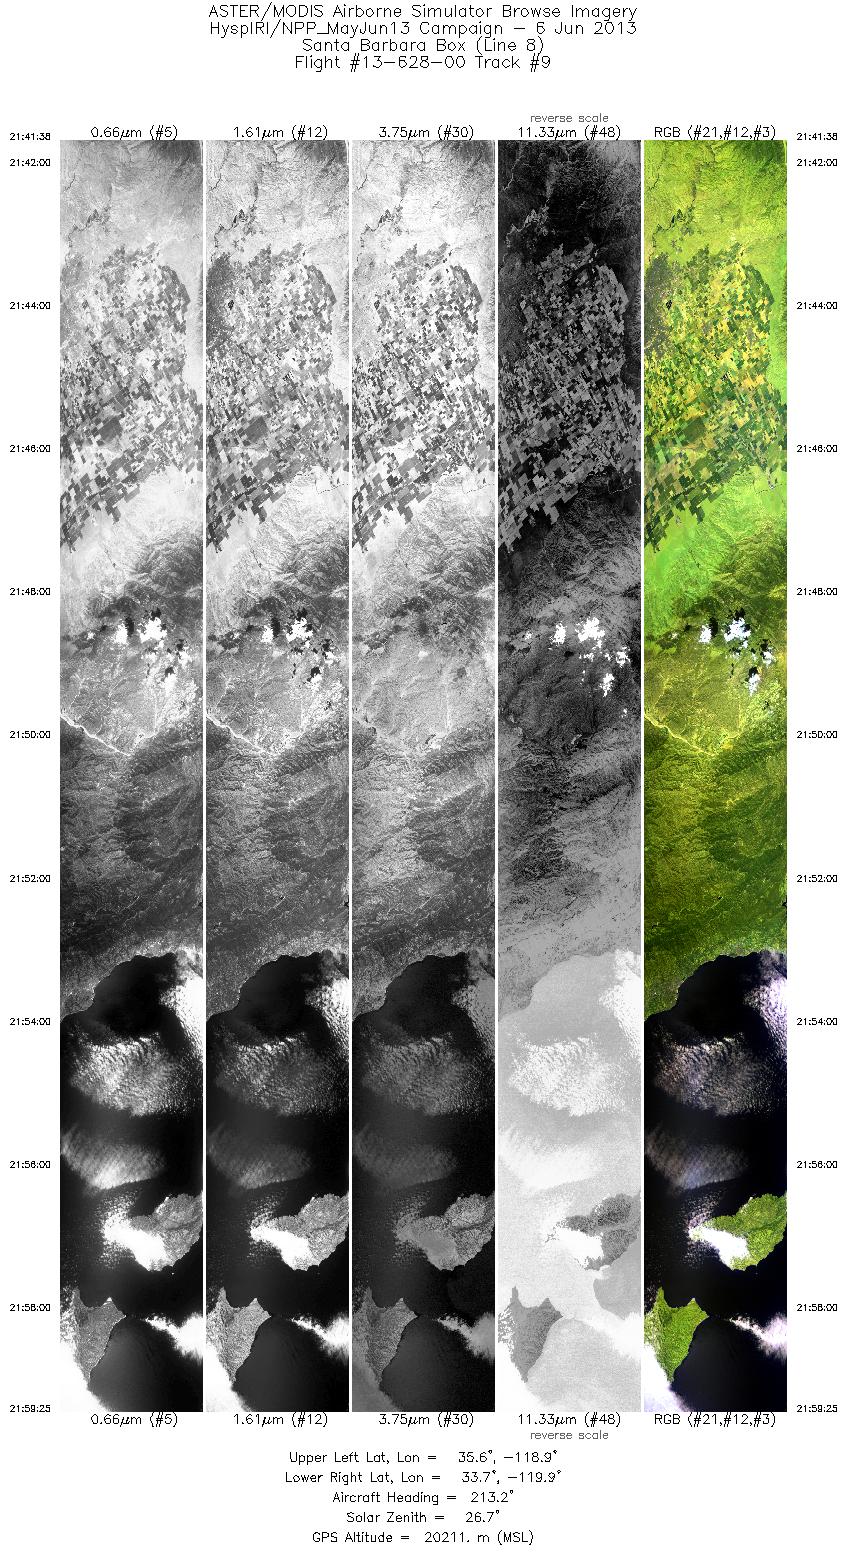
| 9 |
21:41 - 21:59 |
212.9 |
35.495 - 33.808 |
118.693 - 120.057 |
6360 |
20227 |
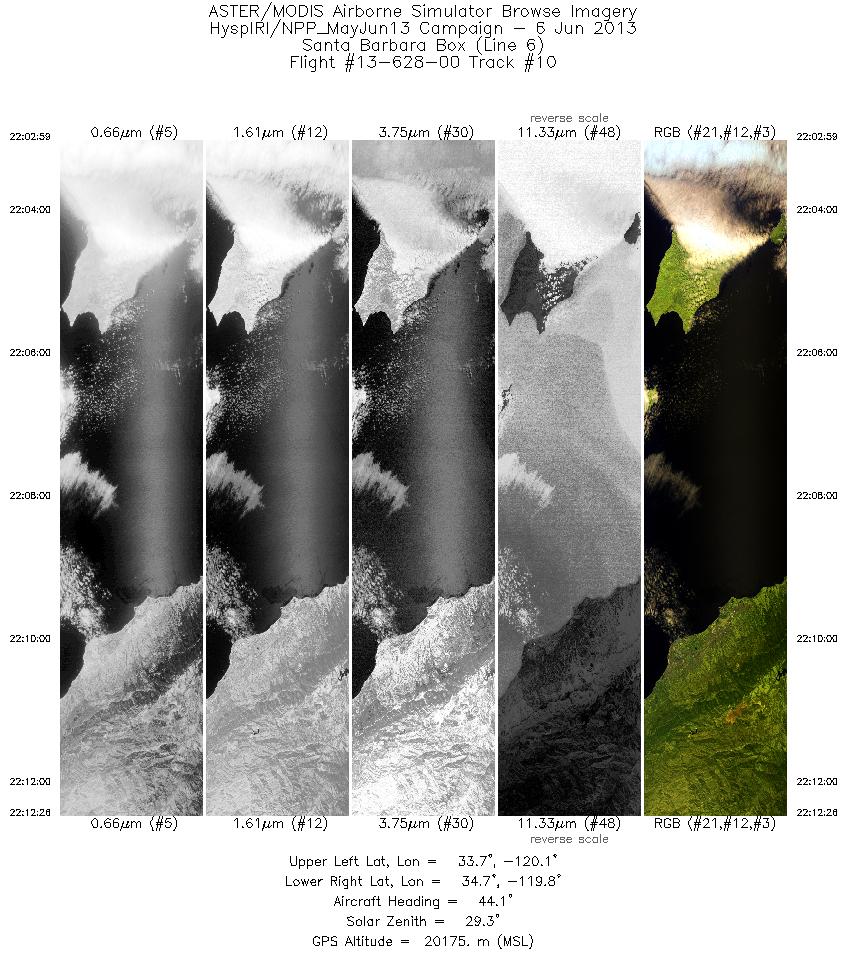
| 10 |
22:02 - 22:12 |
40.7 |
33.840 - 34.656 |
120.293 - 119.636 |
3383 |
20206 |
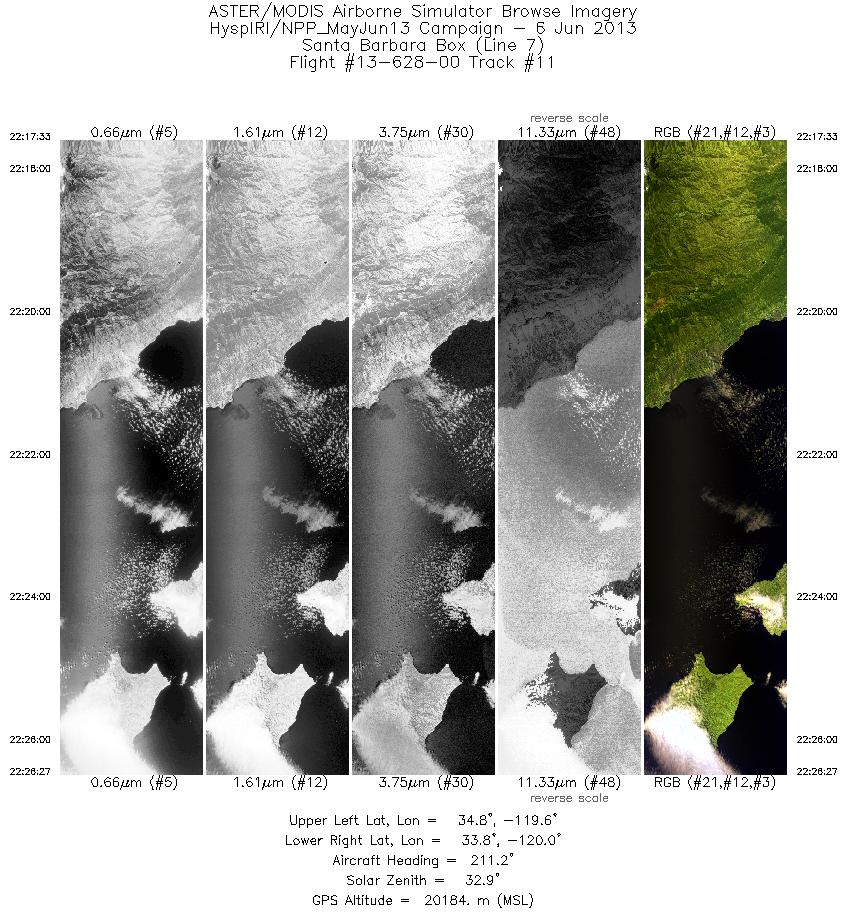
| 11 |
22:17 - 22:26 |
211.7 |
34.700 - 33.856 |
119.469 - 120.146 |
3178 |
20189 |
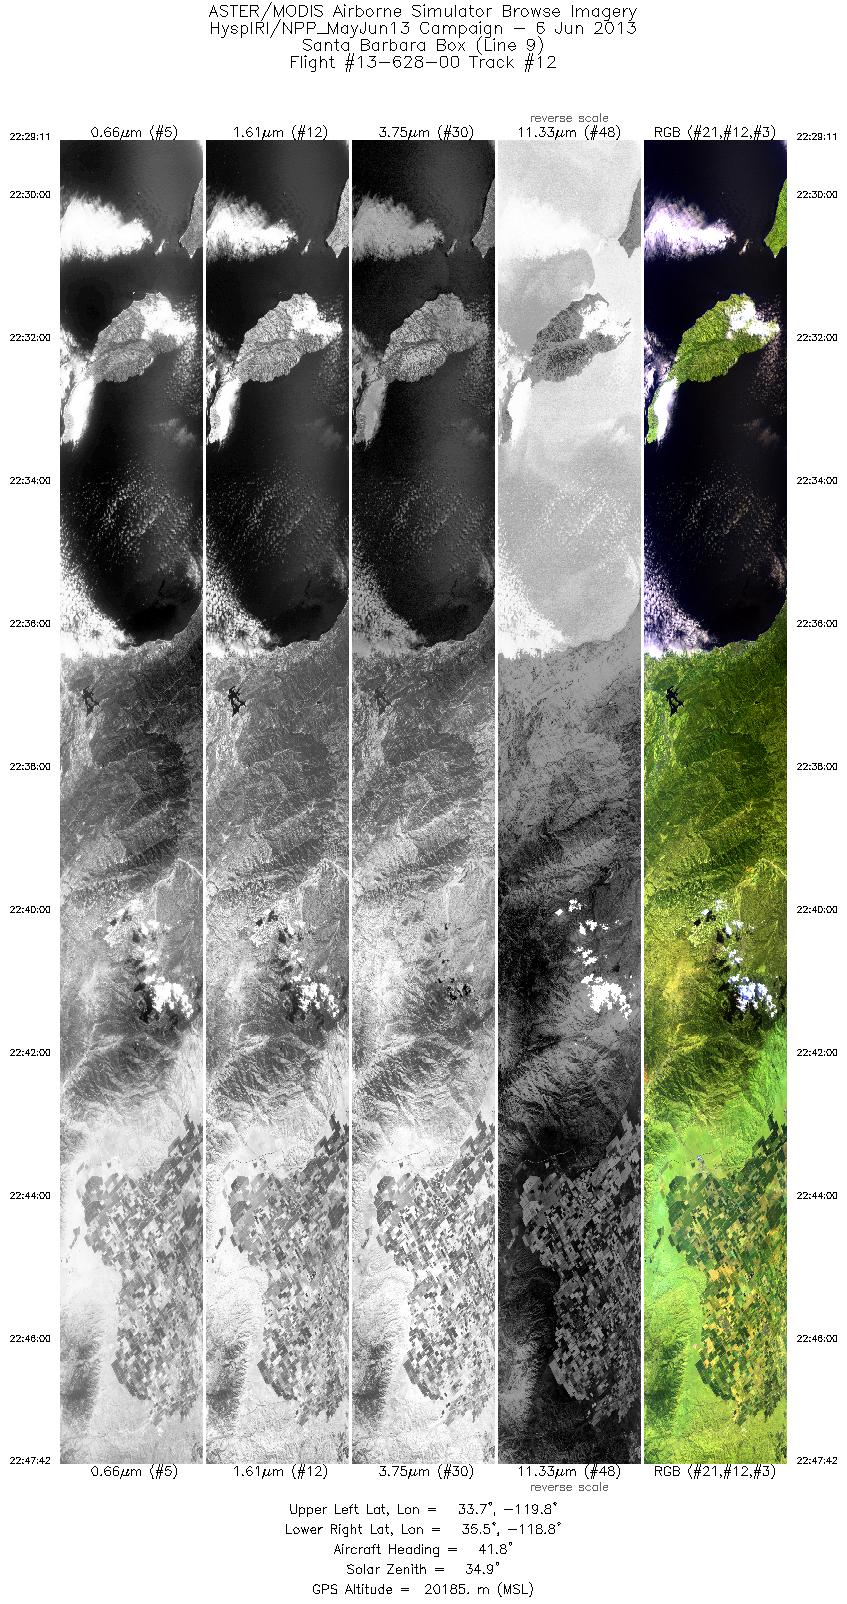
| 12 |
22:29 - 22:47 |
39.0 |
33.766 - 35.362 |
119.971 - 118.675 |
6621 |
20145 |
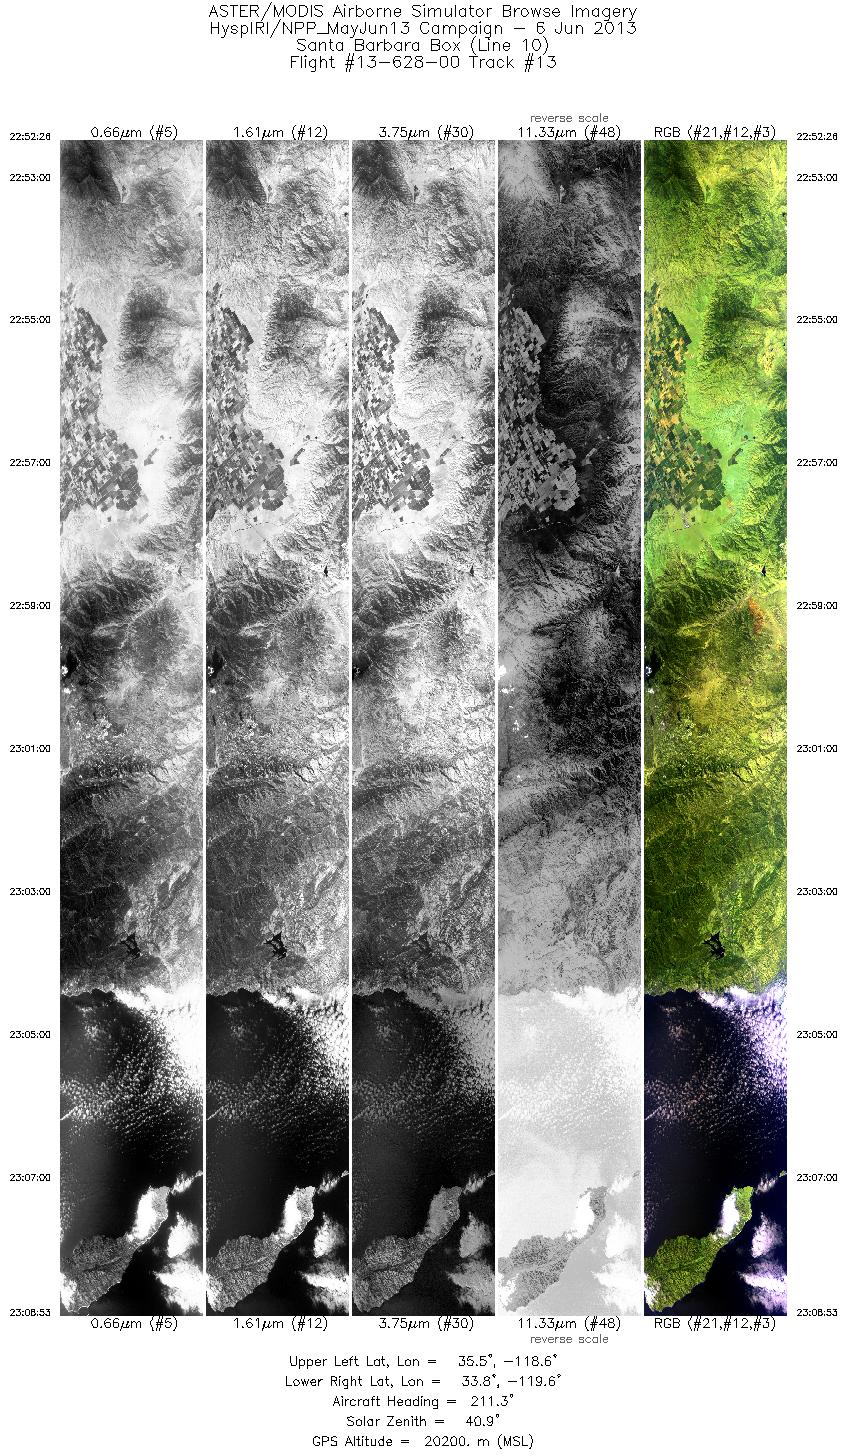
| 13 |
22:52 - 23:08 |
211.8 |
35.456 - 33.900 |
118.471 - 119.735 |
5883 |
20206 |
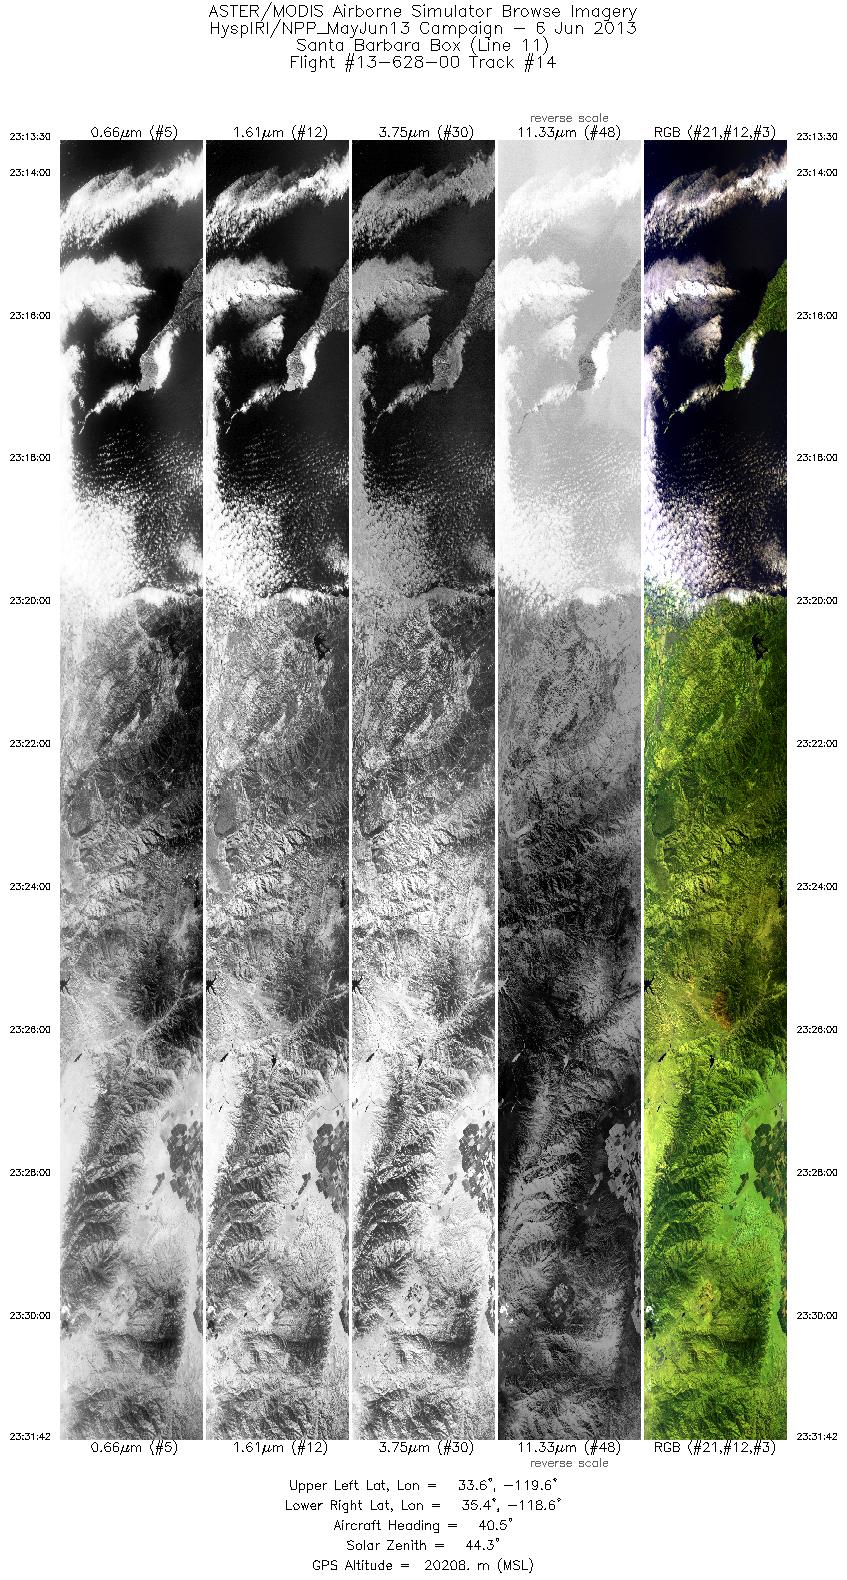
| 14 |
23:13 - 23:31 |
38.3 |
33.726 - 35.296 |
119.751 - 118.475 |
6504 |
20136 |
|


