


FLIGHT SUMMARY INFORMATION
Flight Track Map


|
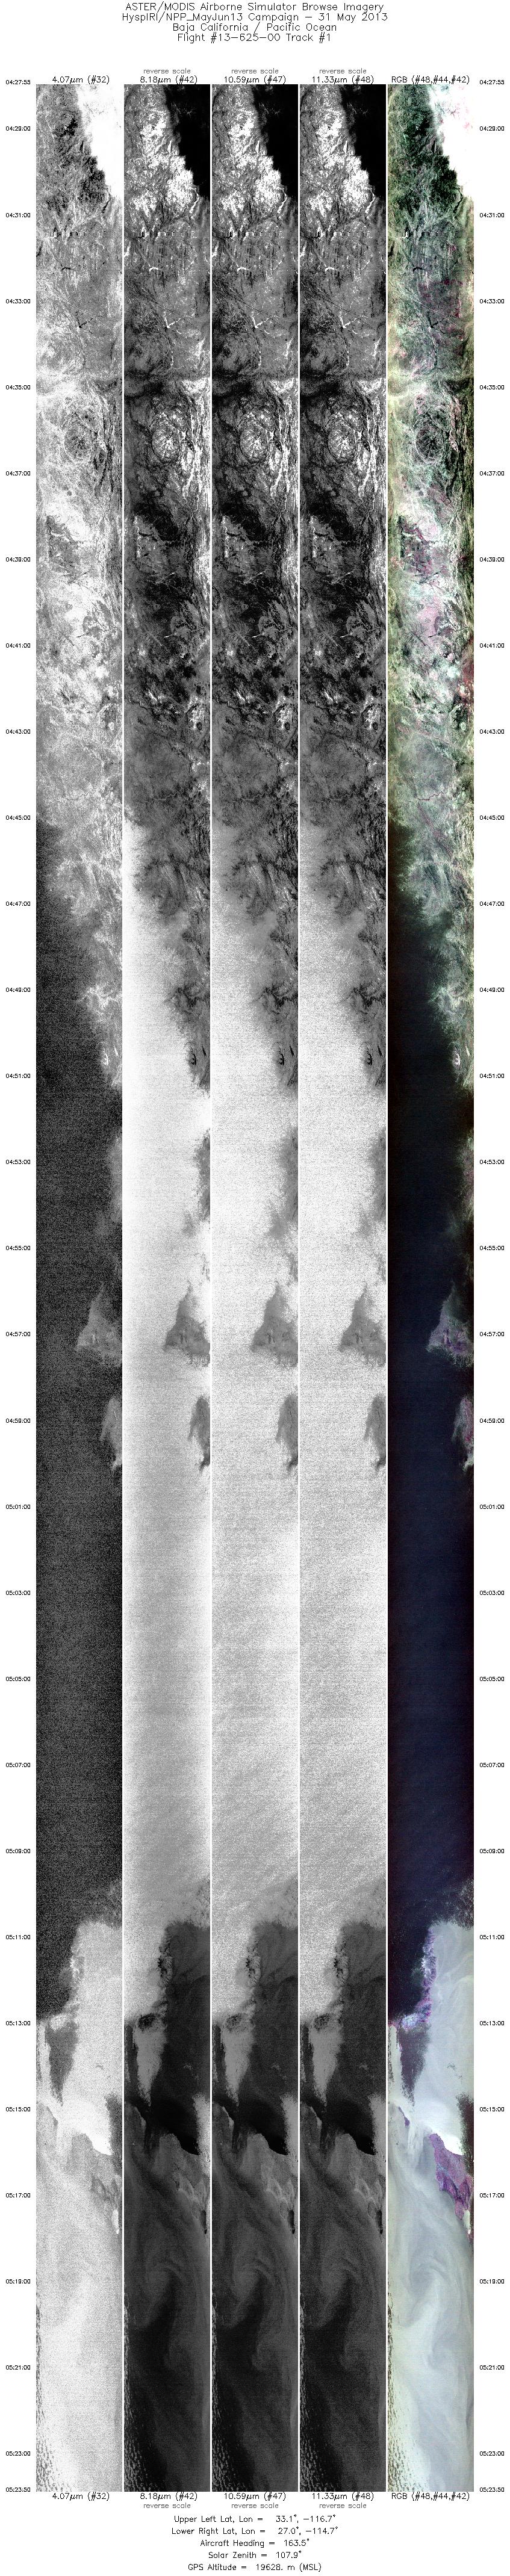
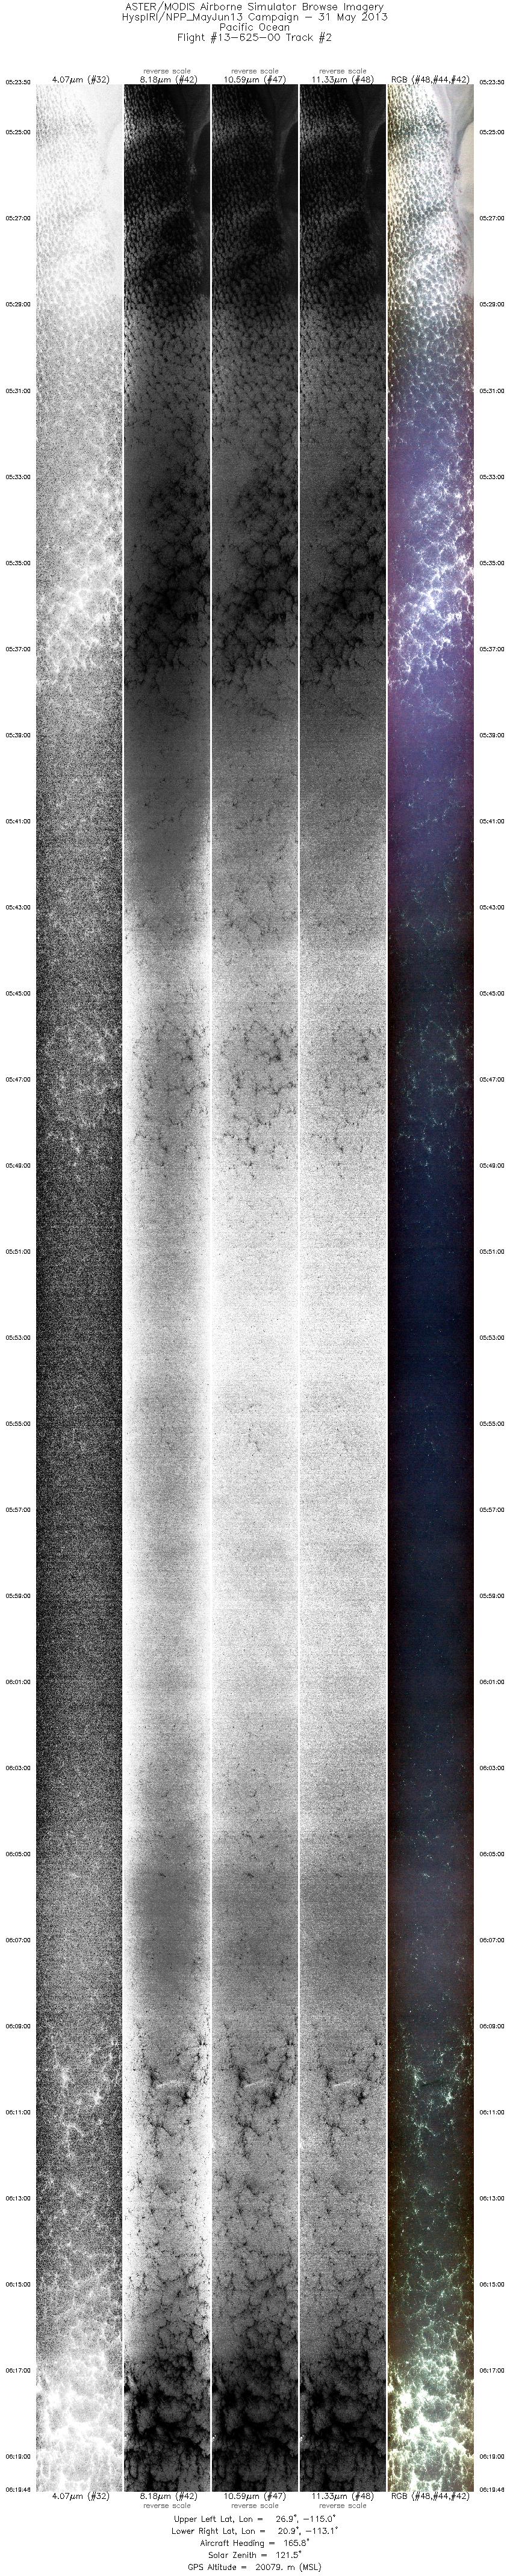
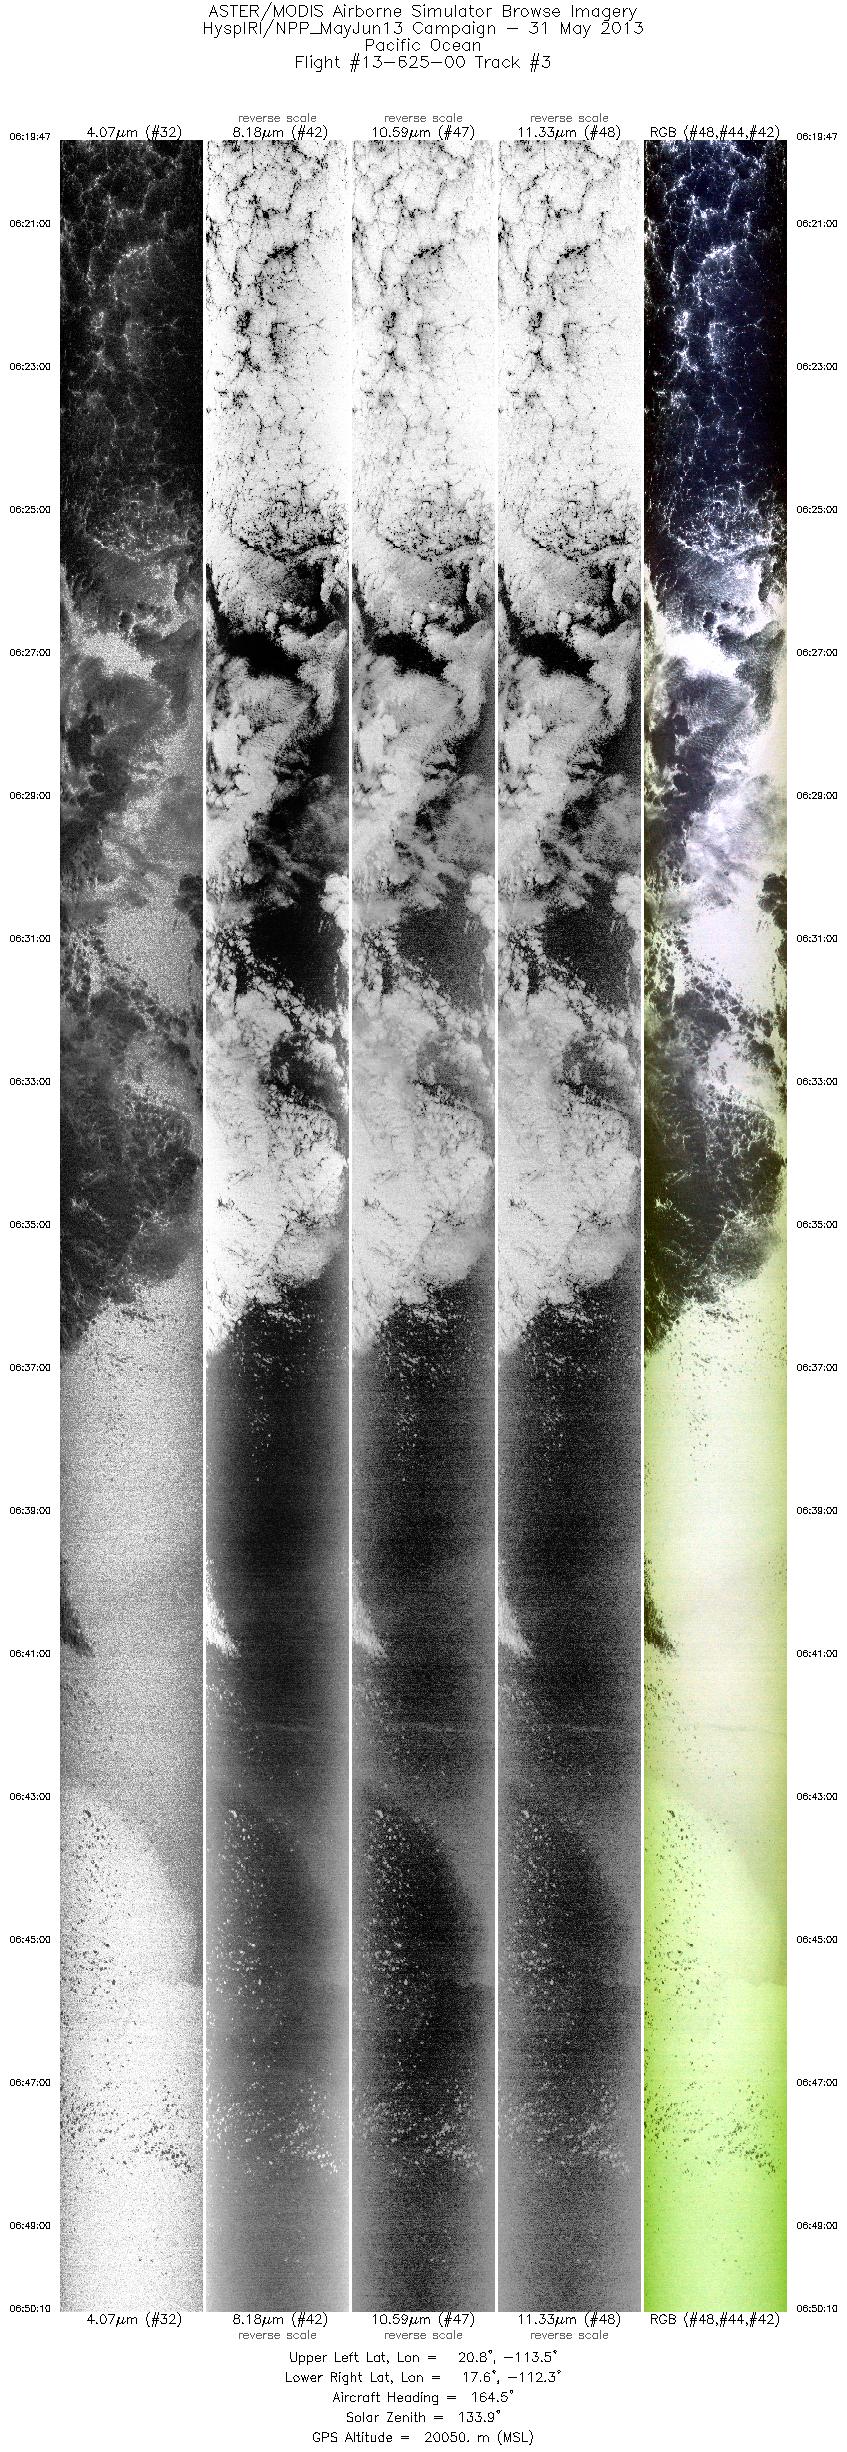
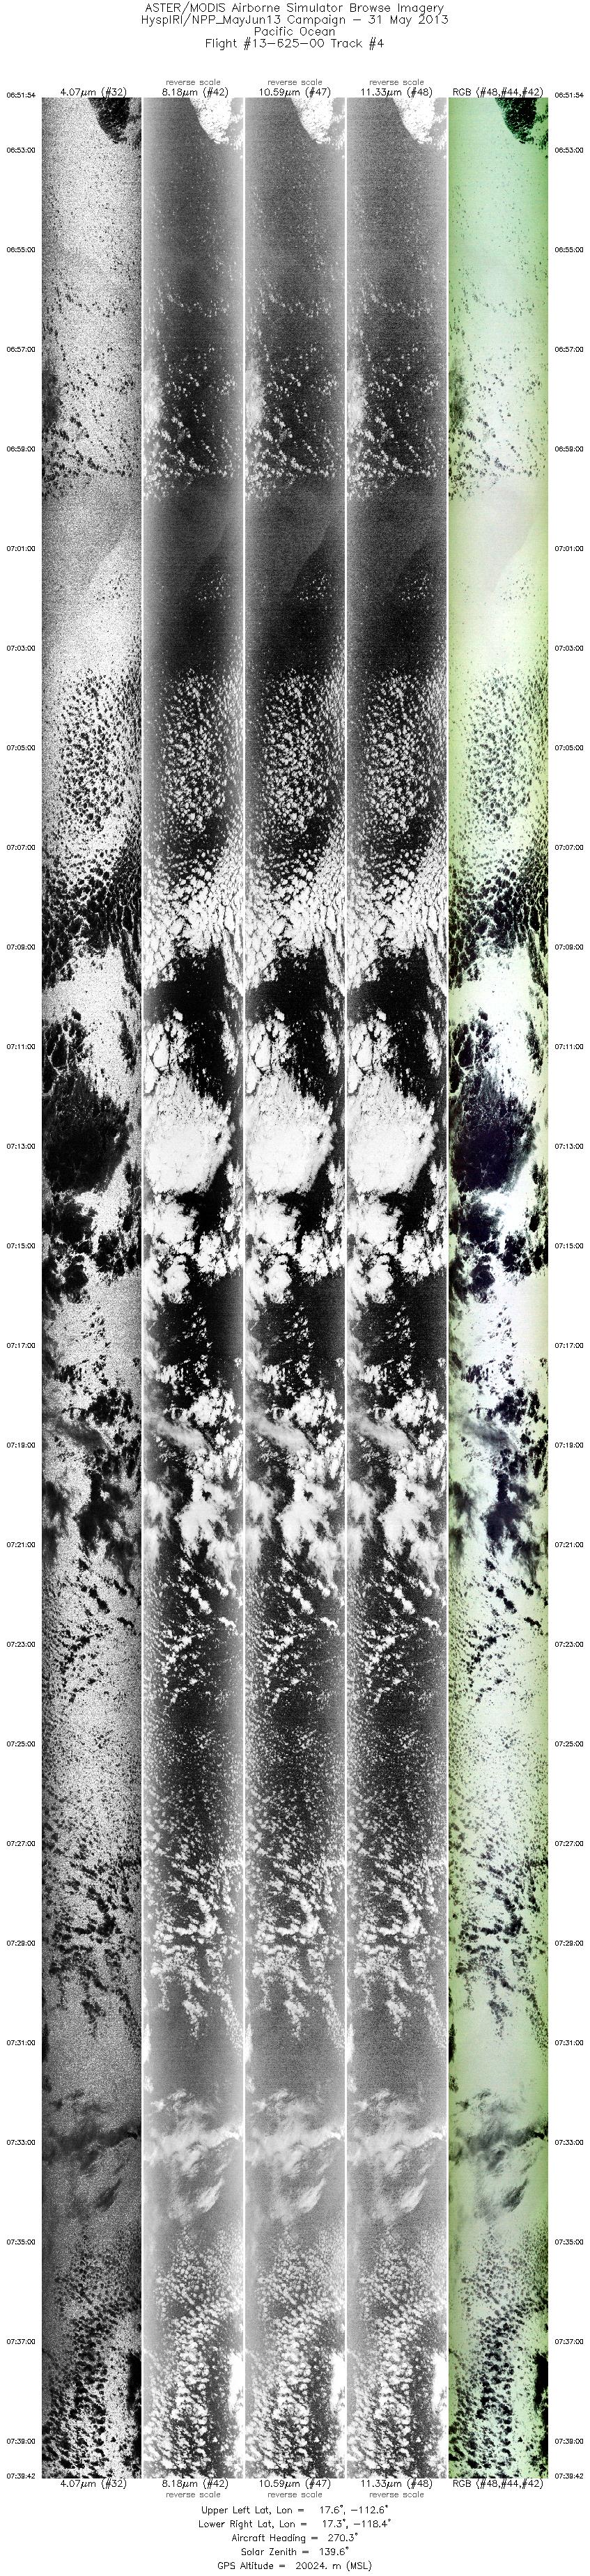
Flight: 13-625-00 Date: May 31 2013 Aircraft: NASA ER2, #806 Deployment: SNPP Spring 2013 Flight Location: Pacific Ocean (night) Principal Investigator: Larar (LRC) Additional Sensors: SHIS / NAST-I / NAST-M |
||||||||||||||||||||||||||||||||||||||||||||||||||||||||||||||||||||||||||||||||||||
|
Data Evaluation Overall data quality is good. All data collected @6.25Hz |
||||||||||||||||||||||||||||||||||||||||||||||||||||||||||||||||||||||||||||||||||||
|
Processing Information Level-1B Data in HDF format is available Flight Line Summary Spectral Band Configuration Spectral Response Function Table Spectral Response Function (text) |
||||||||||||||||||||||||||||||||||||||||||||||||||||||||||||||||||||||||||||||||||||
|
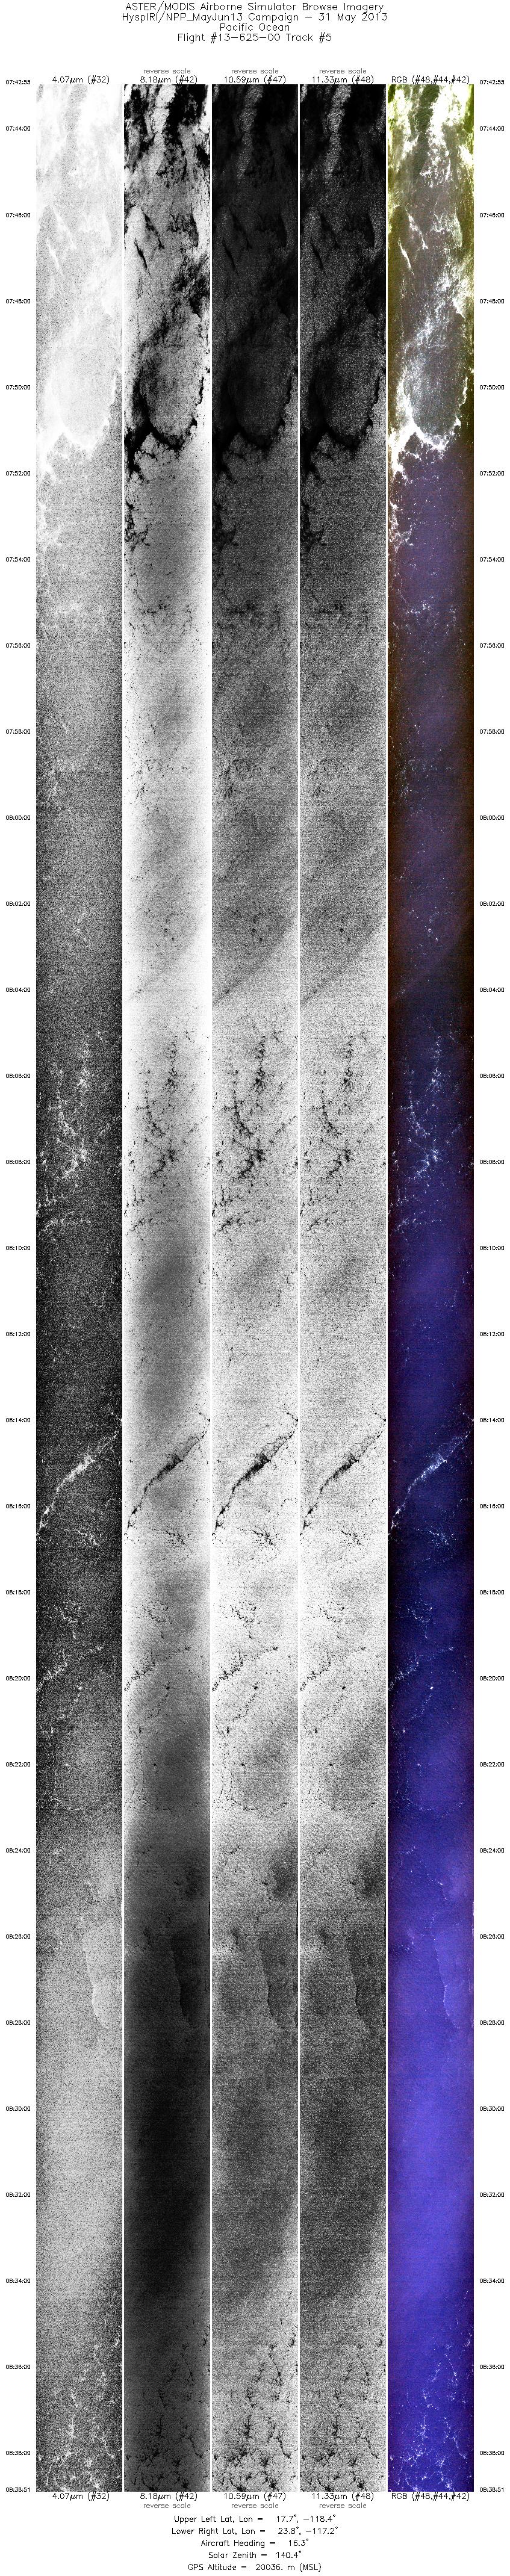
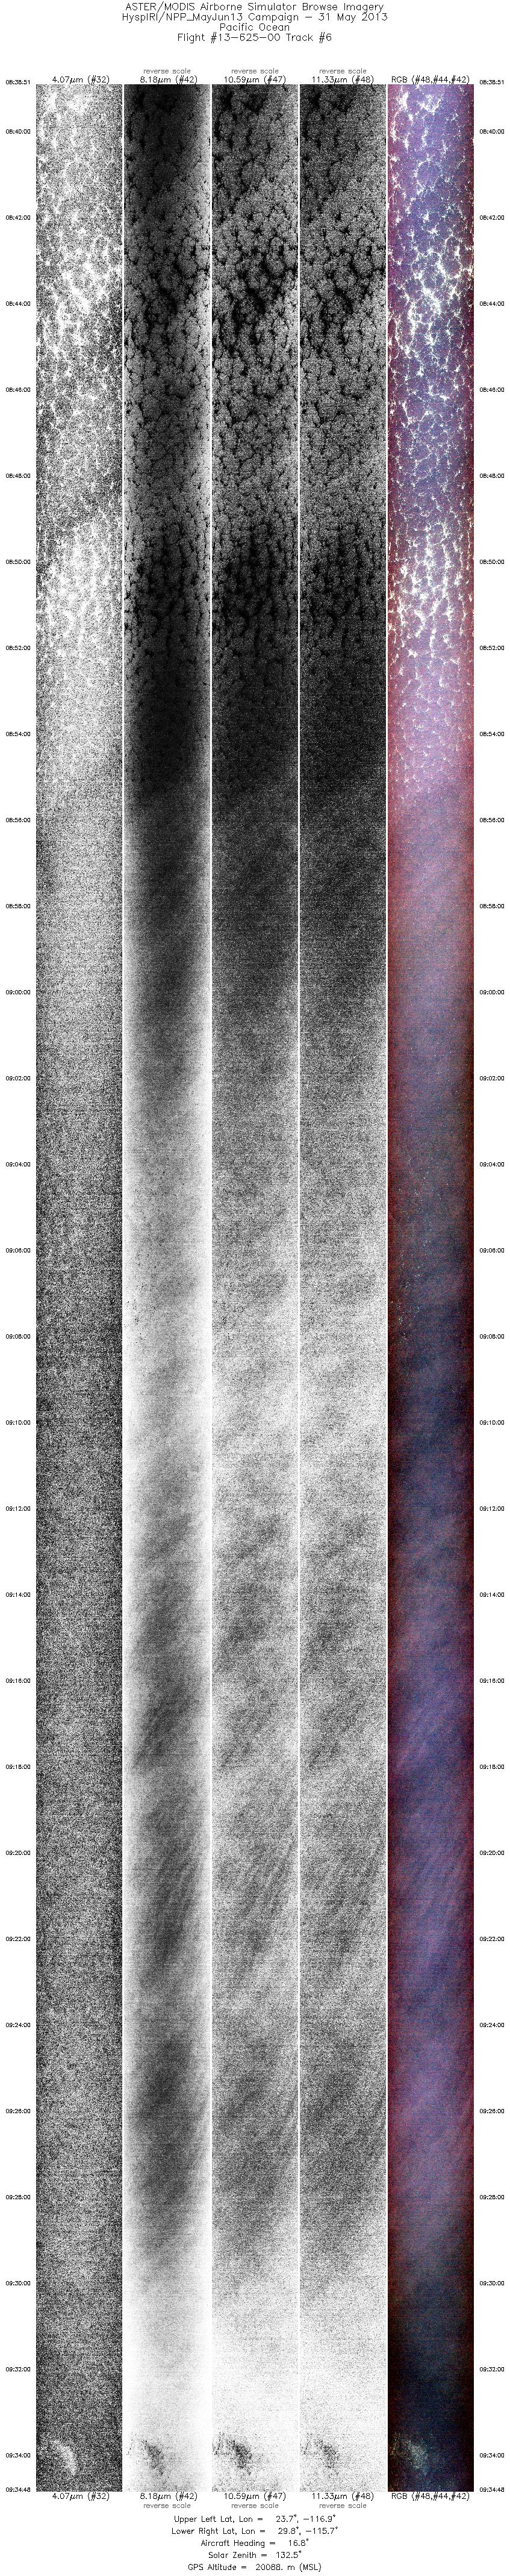
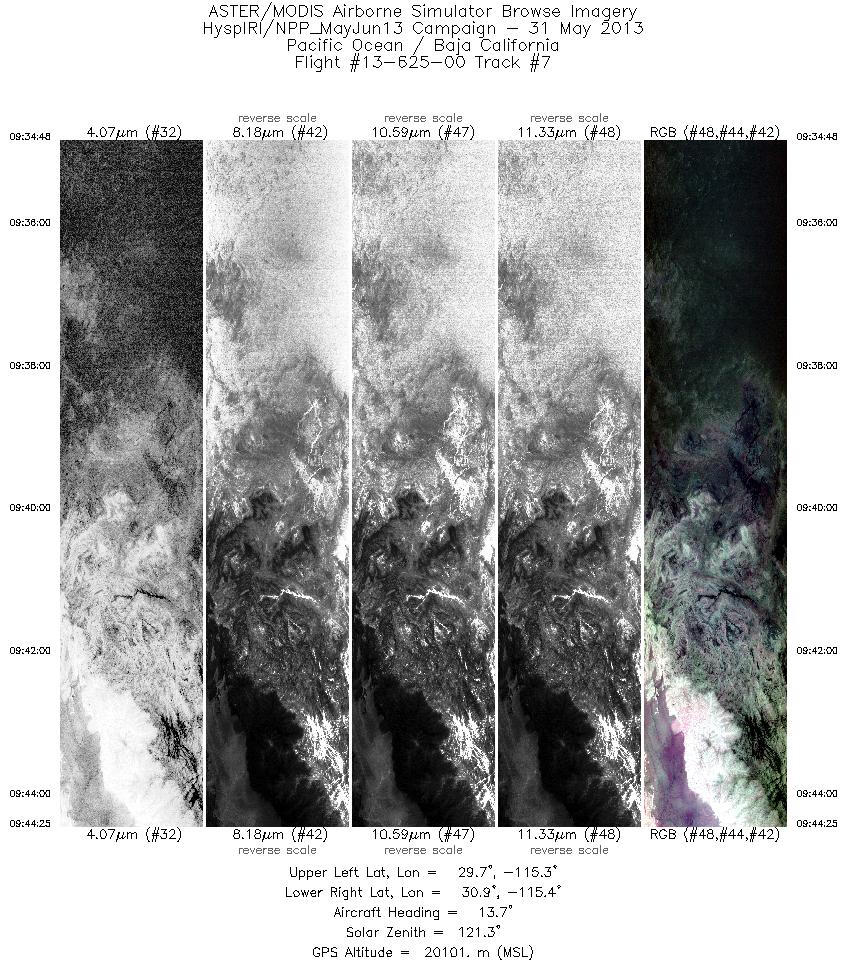
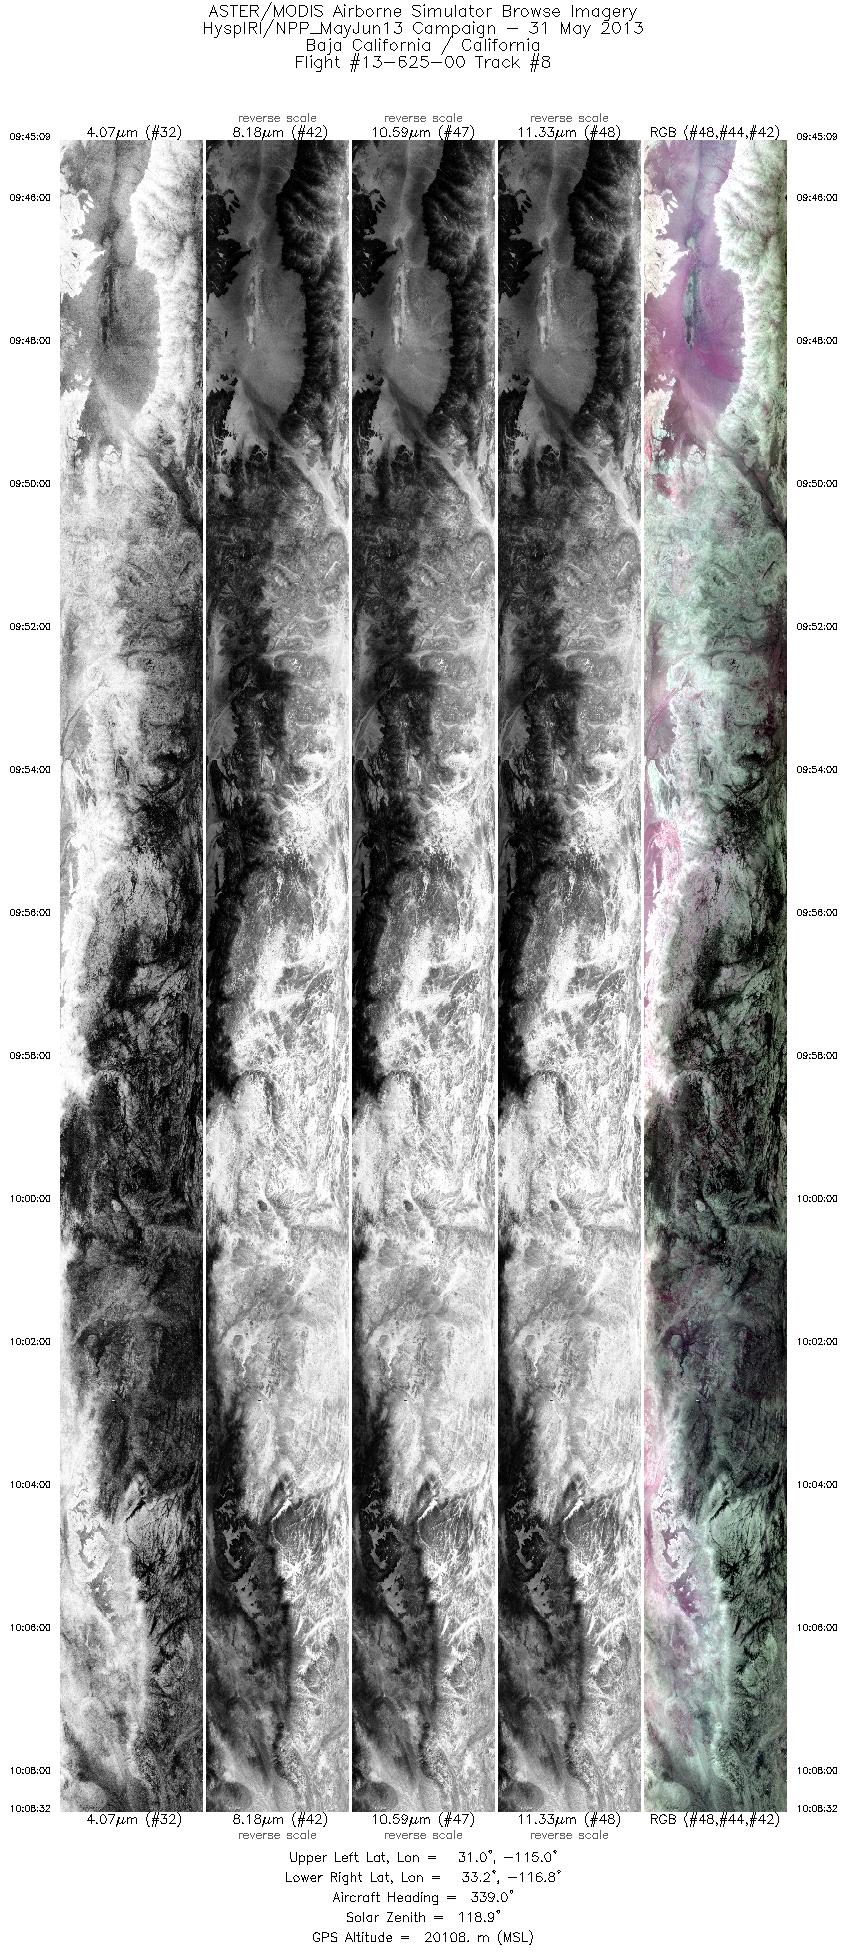
Browse Imagery Flight Tracks: 8 Scanlines: 119755 |
||||||||||||||||||||||||||||||||||||||||||||||||||||||||||||||||||||||||||||||||||||
|
||||||||||||||||||||||||||||||||||||||||||||||||||||||||||||||||||||||||||||||||||||

Flight 13-625-00


| Sample Imagery |
| Click image for full resolution |
|
Track #8 Baja California, Mexico |


|
|
R: 11.33µm G: 9.06µm B: 8.18µm |


