


FLIGHT SUMMARY INFORMATION
Flight Track Map


|
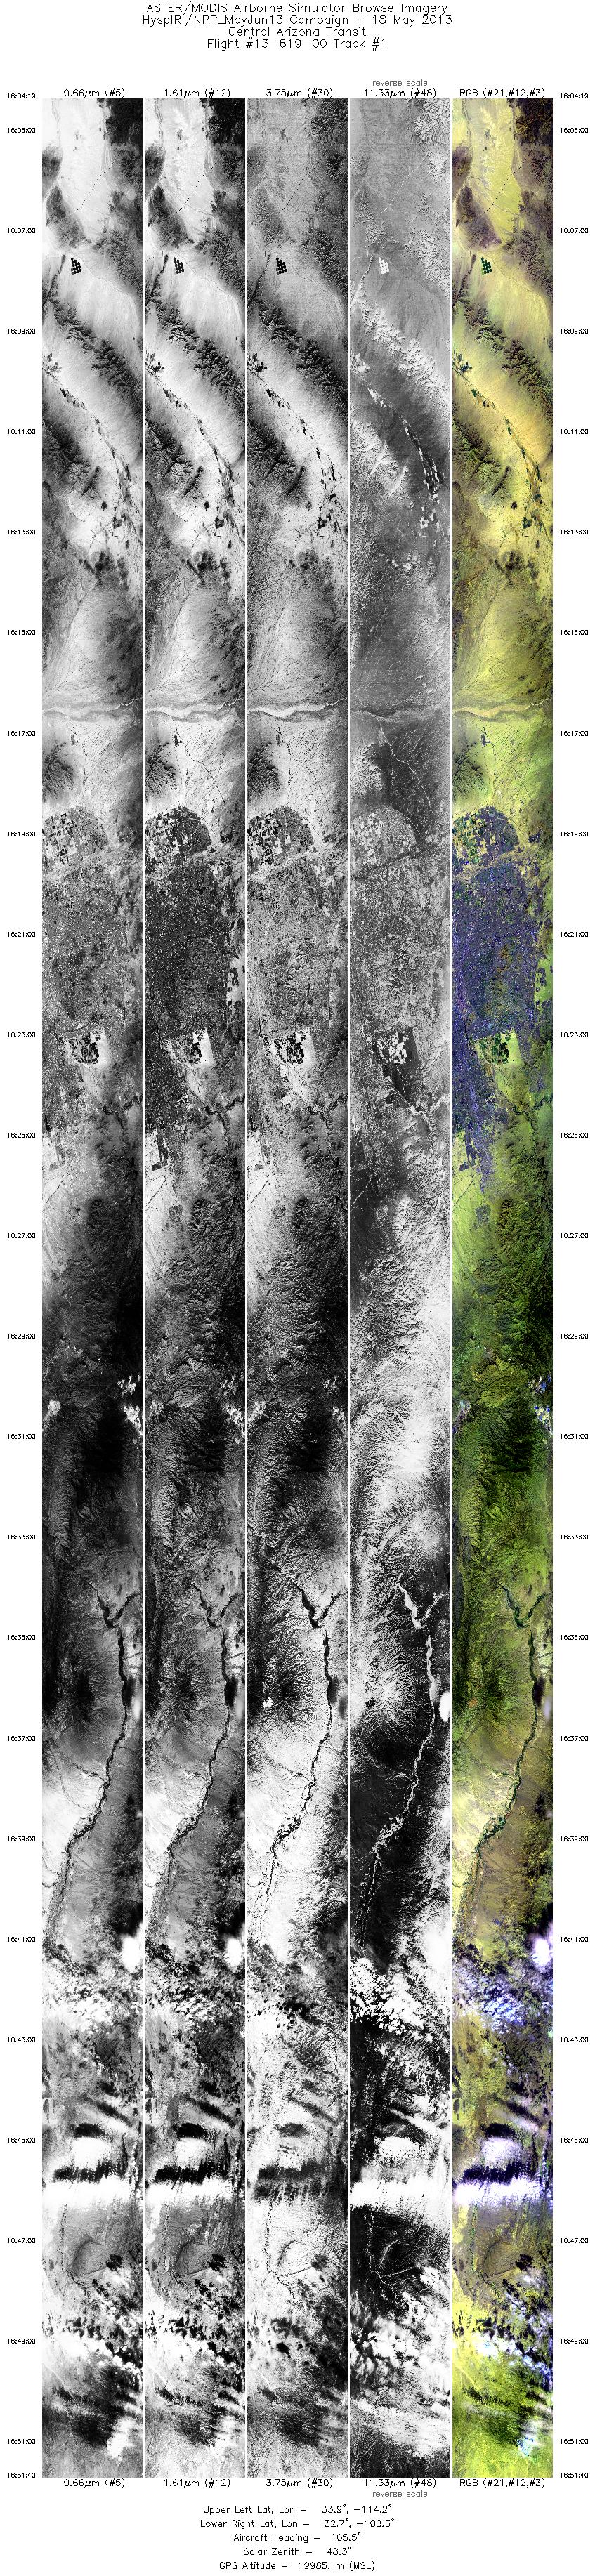
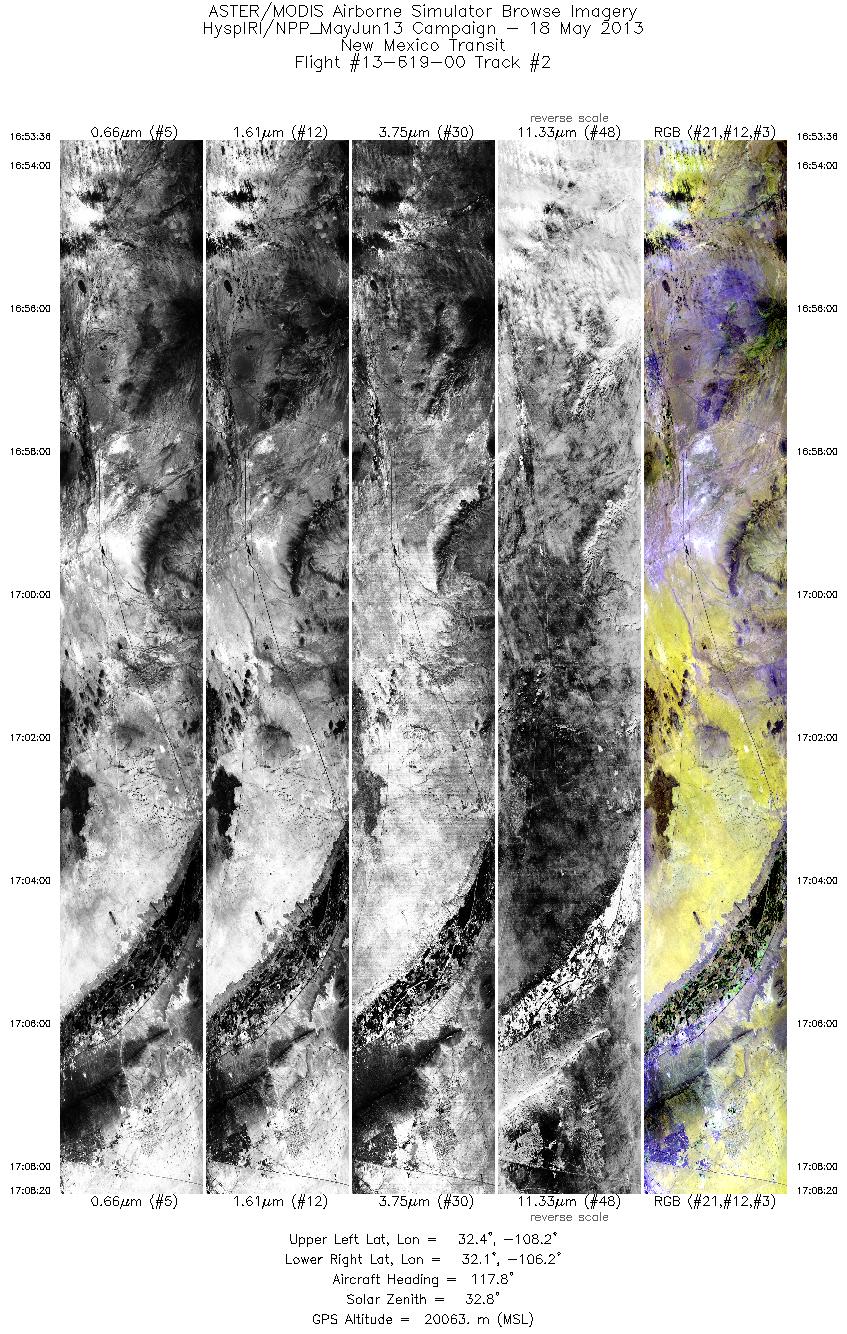
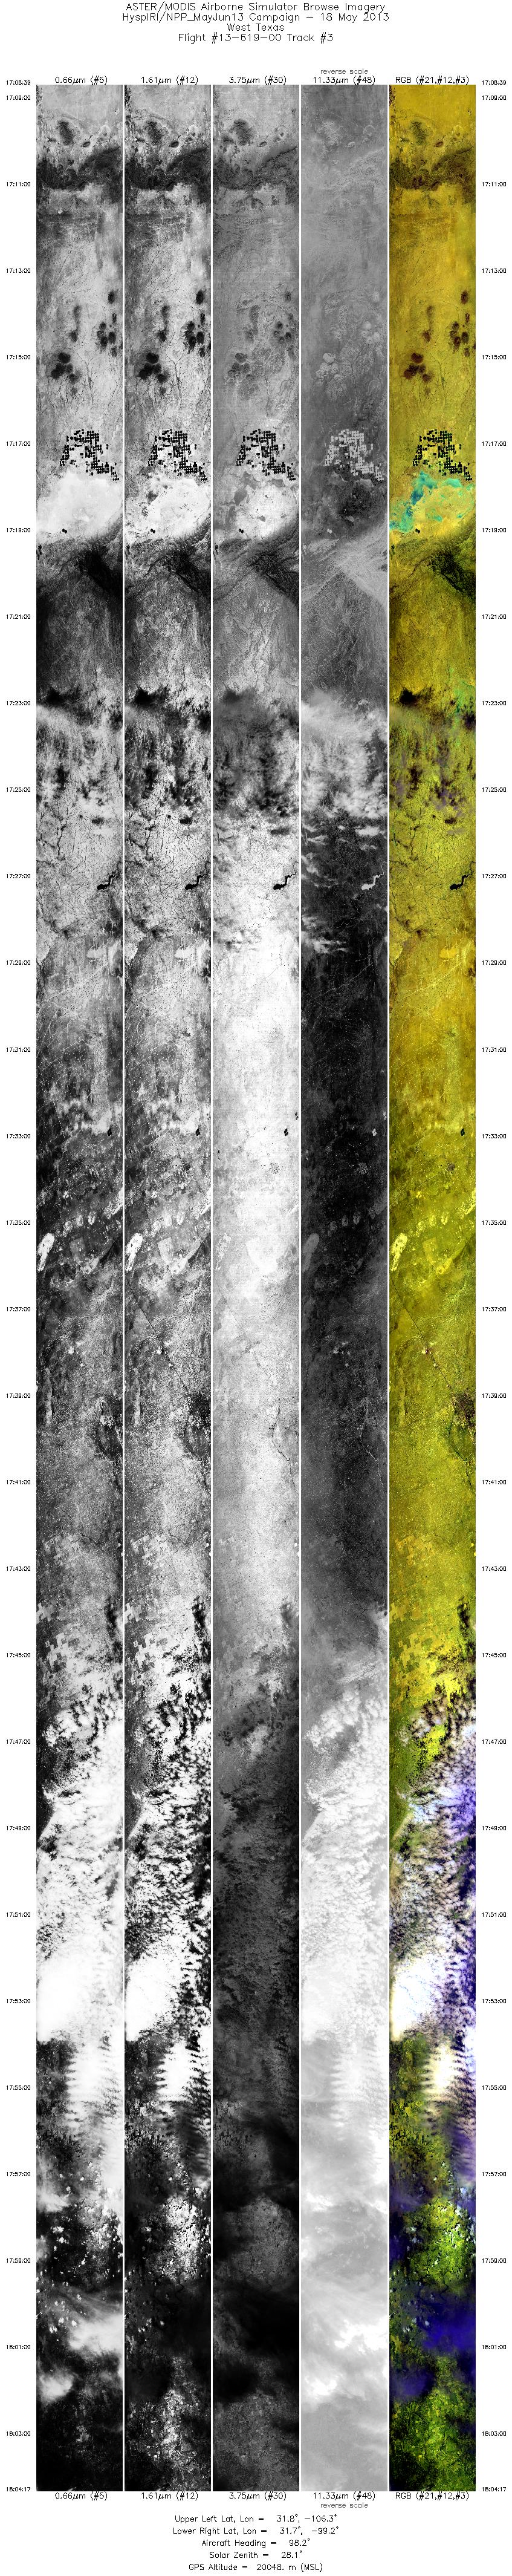
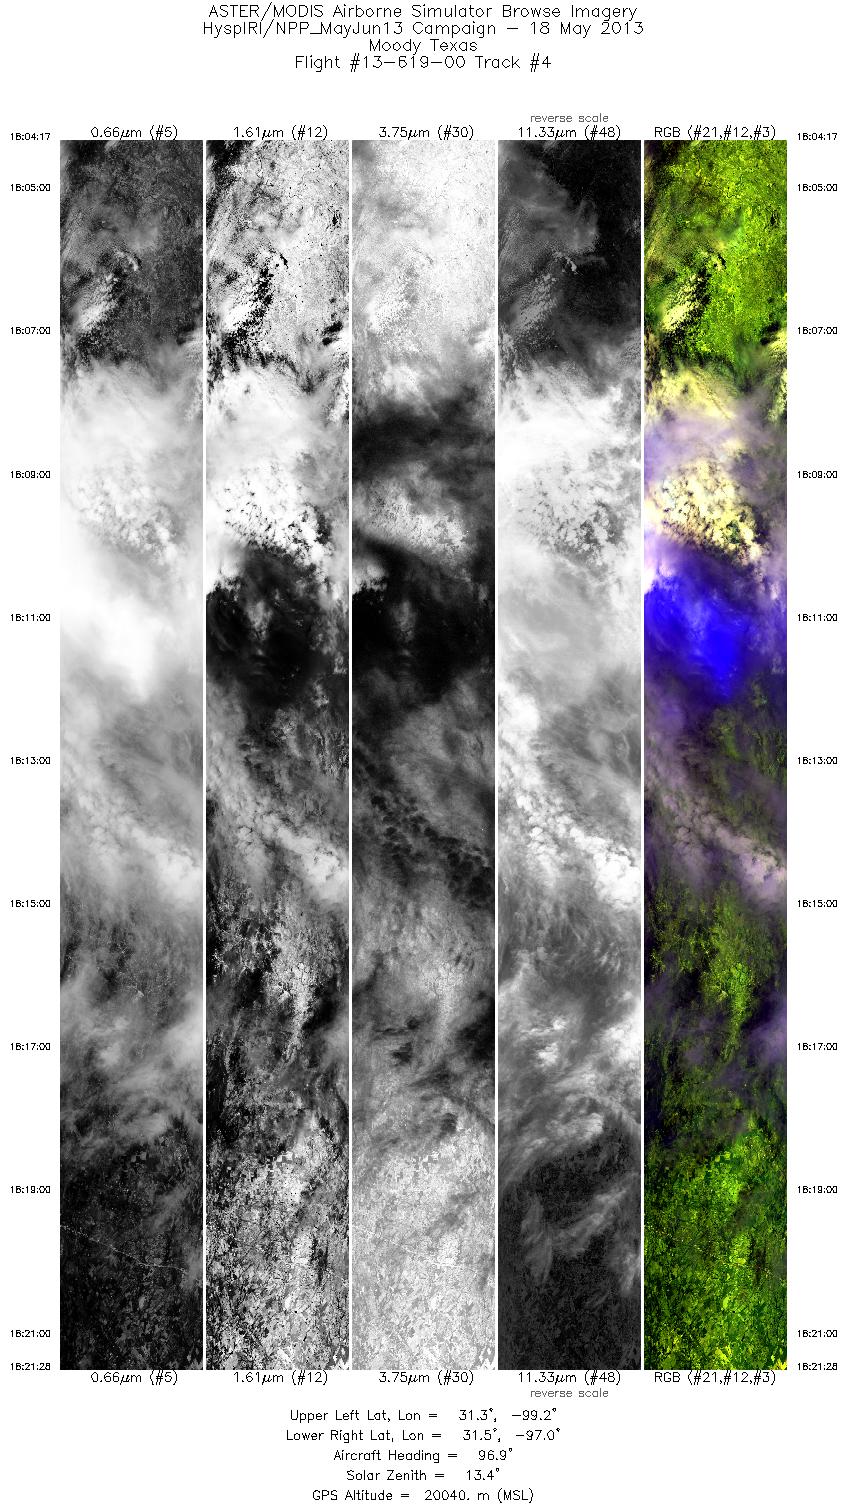
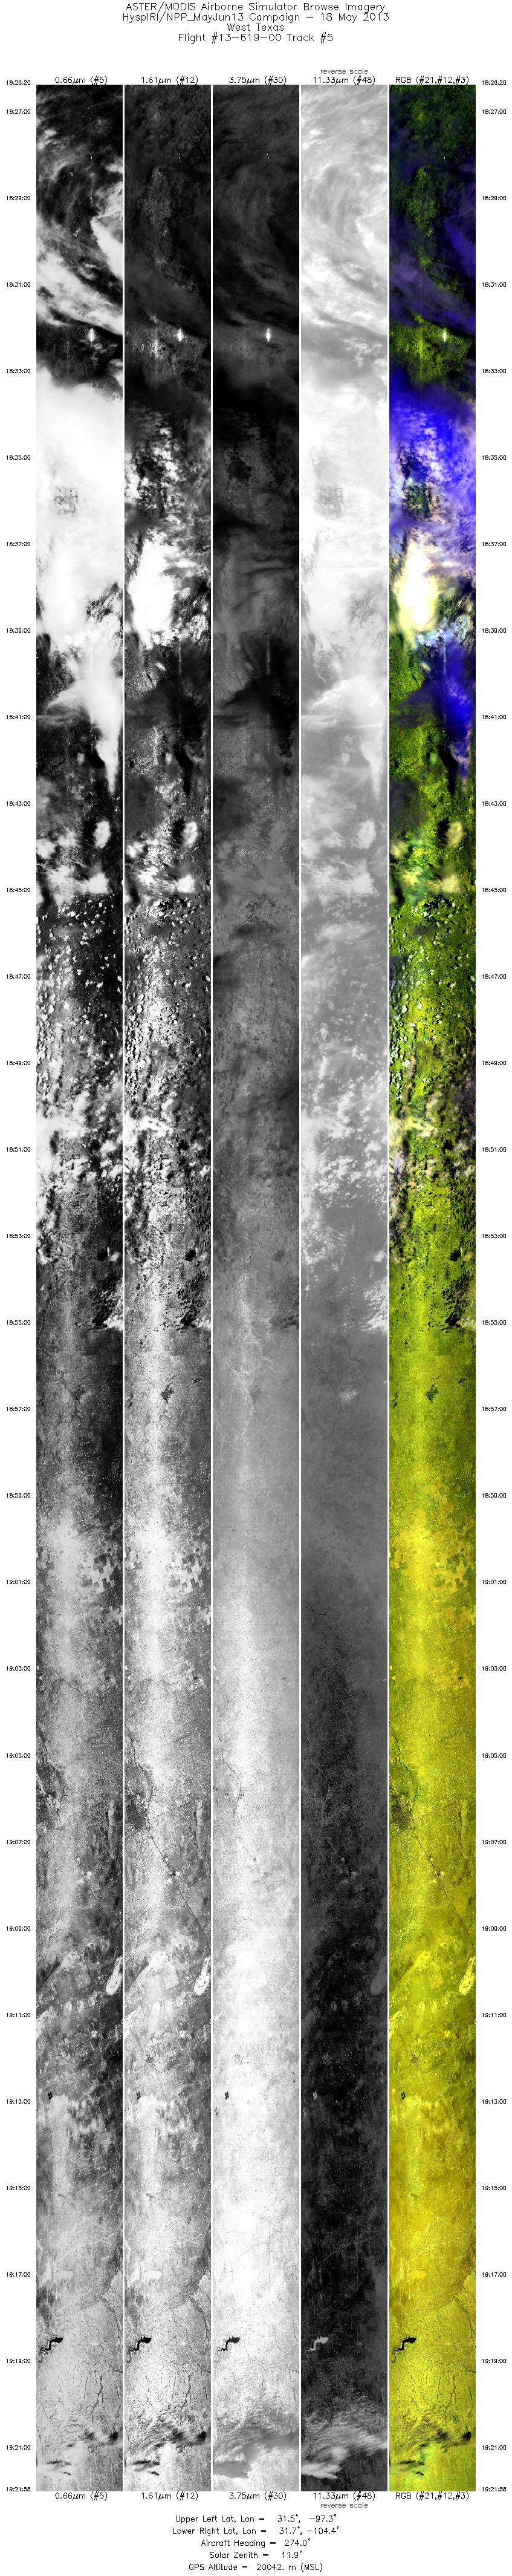
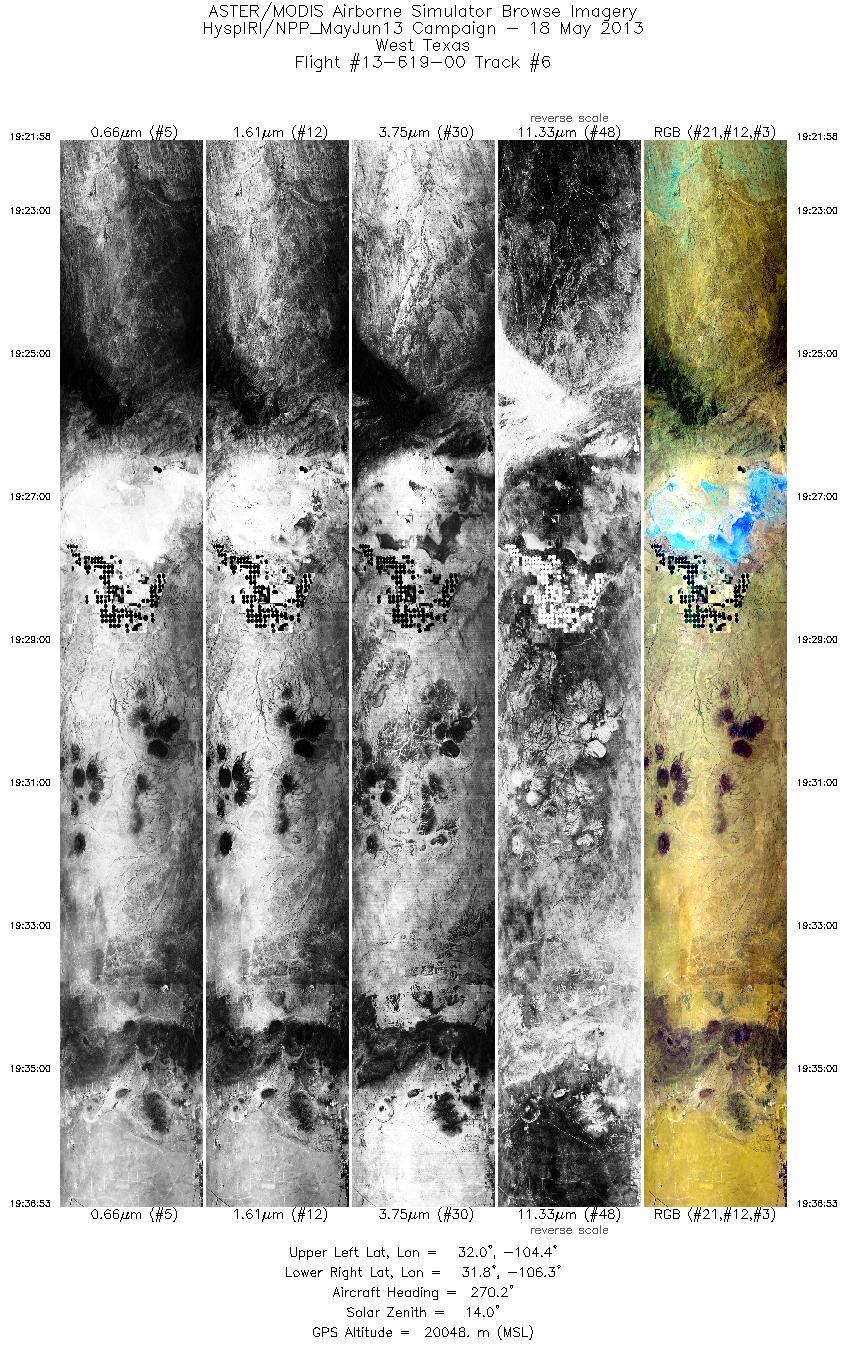
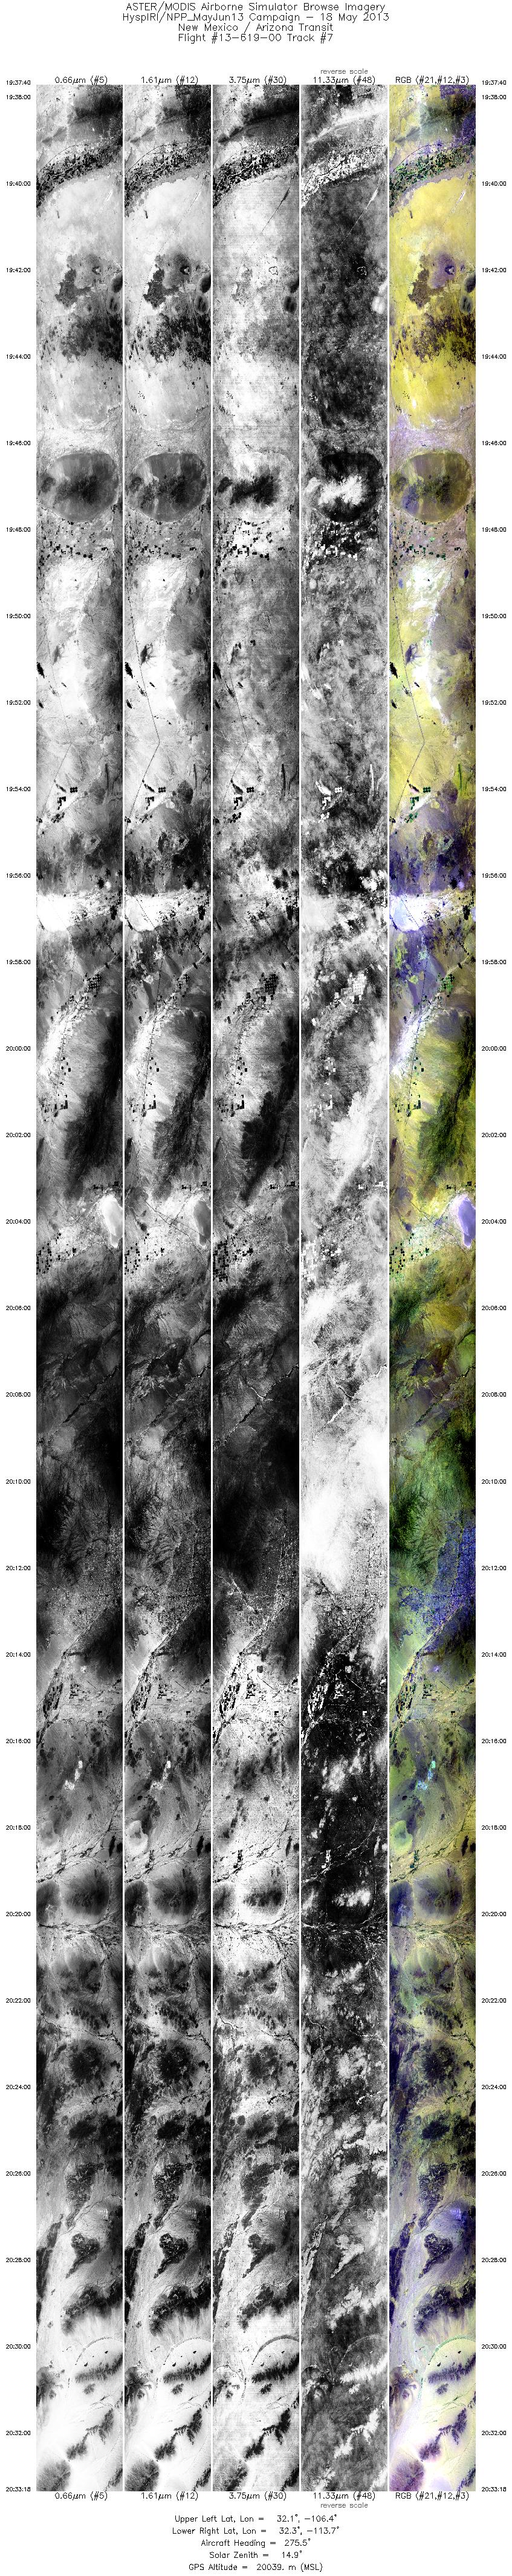
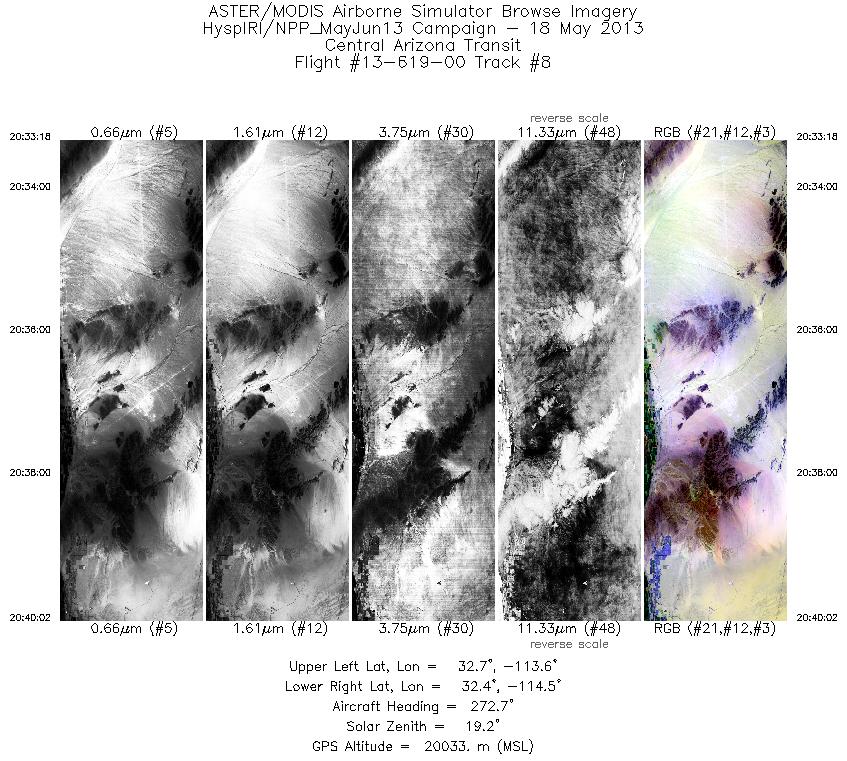
Flight: 13-619-00 Date: May 18, 2013 Aircraft: NASA ER2, #806 Deployment: SNPP Spring 2013 Flight Location: Texas Principal Investigator: Larar (LRC) Additional Sensors: AVIRIS / SHIS / NAST-I / NAST-M |
|||||||||||||||||||||||||||||||||||||||||||||||||||||||||||||||||||||||||||||||||||||||||||||||||||||||||
|
Data Evaluation Overall data quality is good. All data collected @6.25Hz |
|||||||||||||||||||||||||||||||||||||||||||||||||||||||||||||||||||||||||||||||||||||||||||||||||||||||||
|
Processing Information Level-1B Data in HDF format is available Flight Line Summary Spectral Band Configuration Spectral Response Function Table Spectral Response Function (text) |
|||||||||||||||||||||||||||||||||||||||||||||||||||||||||||||||||||||||||||||||||||||||||||||||||||||||||
|
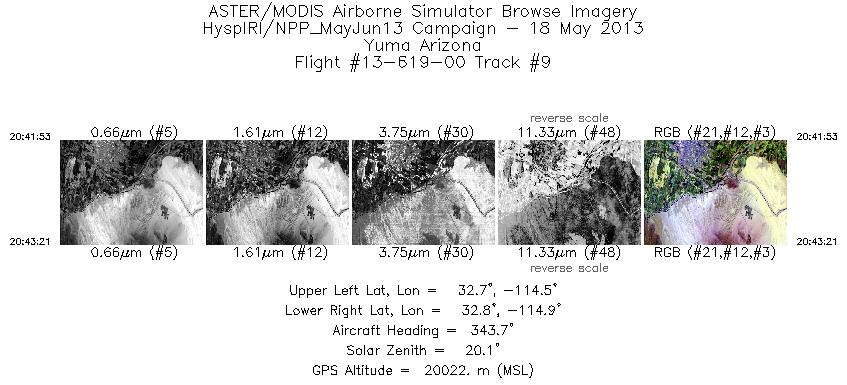
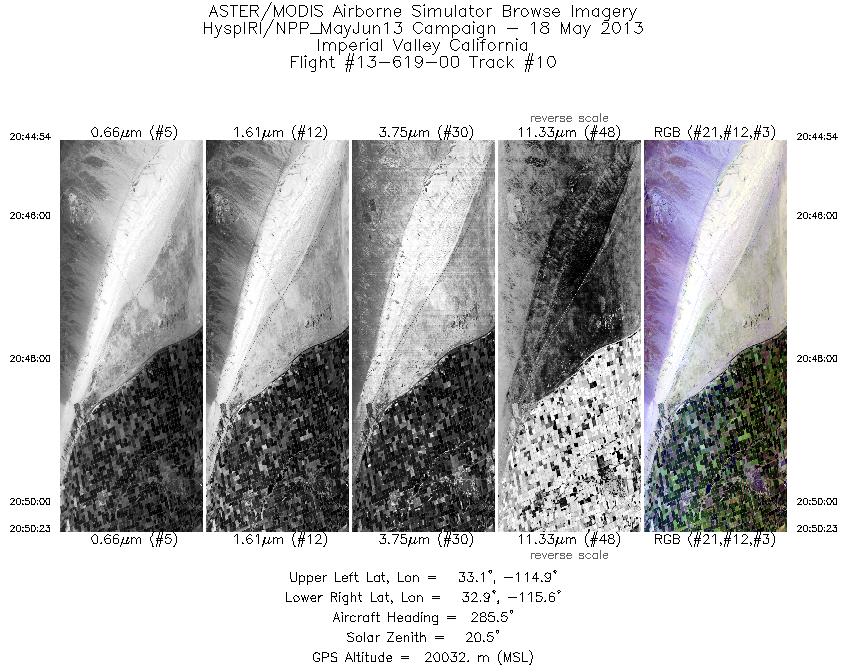
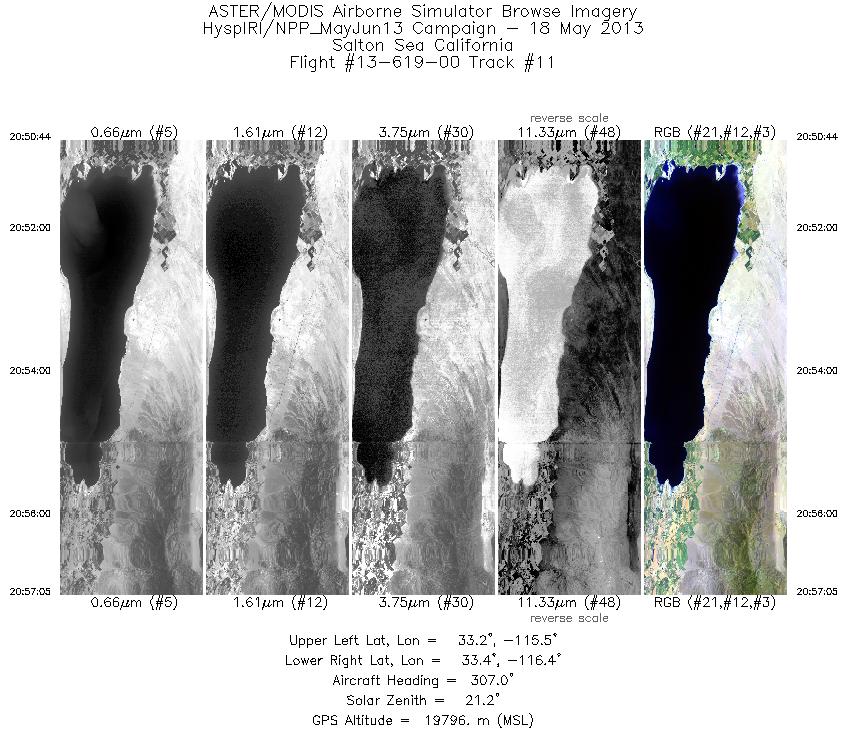
Browse Imagery Flight Tracks: 11 Scanlines: 100569 |
|||||||||||||||||||||||||||||||||||||||||||||||||||||||||||||||||||||||||||||||||||||||||||||||||||||||||
|
|||||||||||||||||||||||||||||||||||||||||||||||||||||||||||||||||||||||||||||||||||||||||||||||||||||||||


