


FLIGHT SUMMARY INFORMATION
Flight Track Map


|
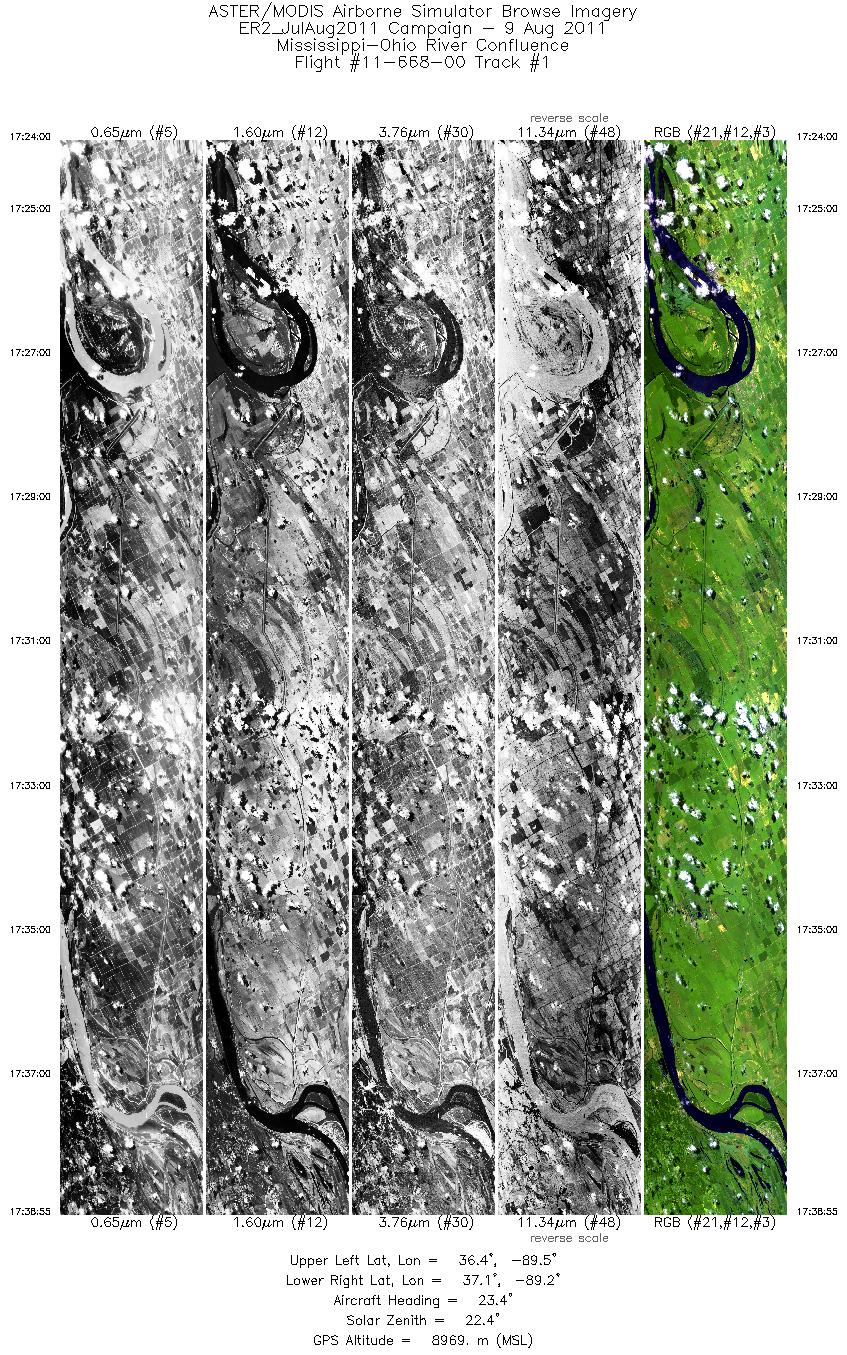
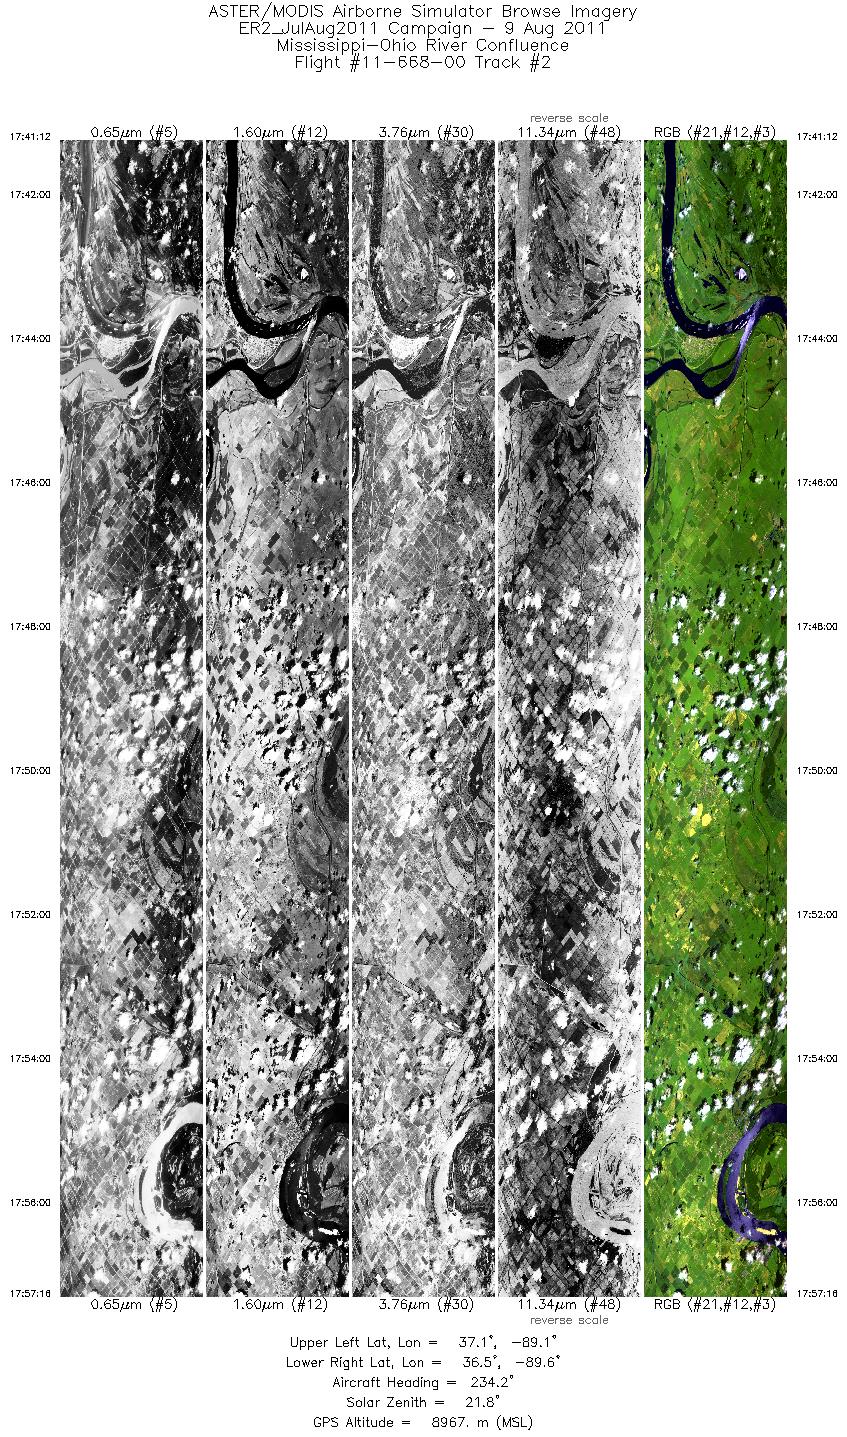
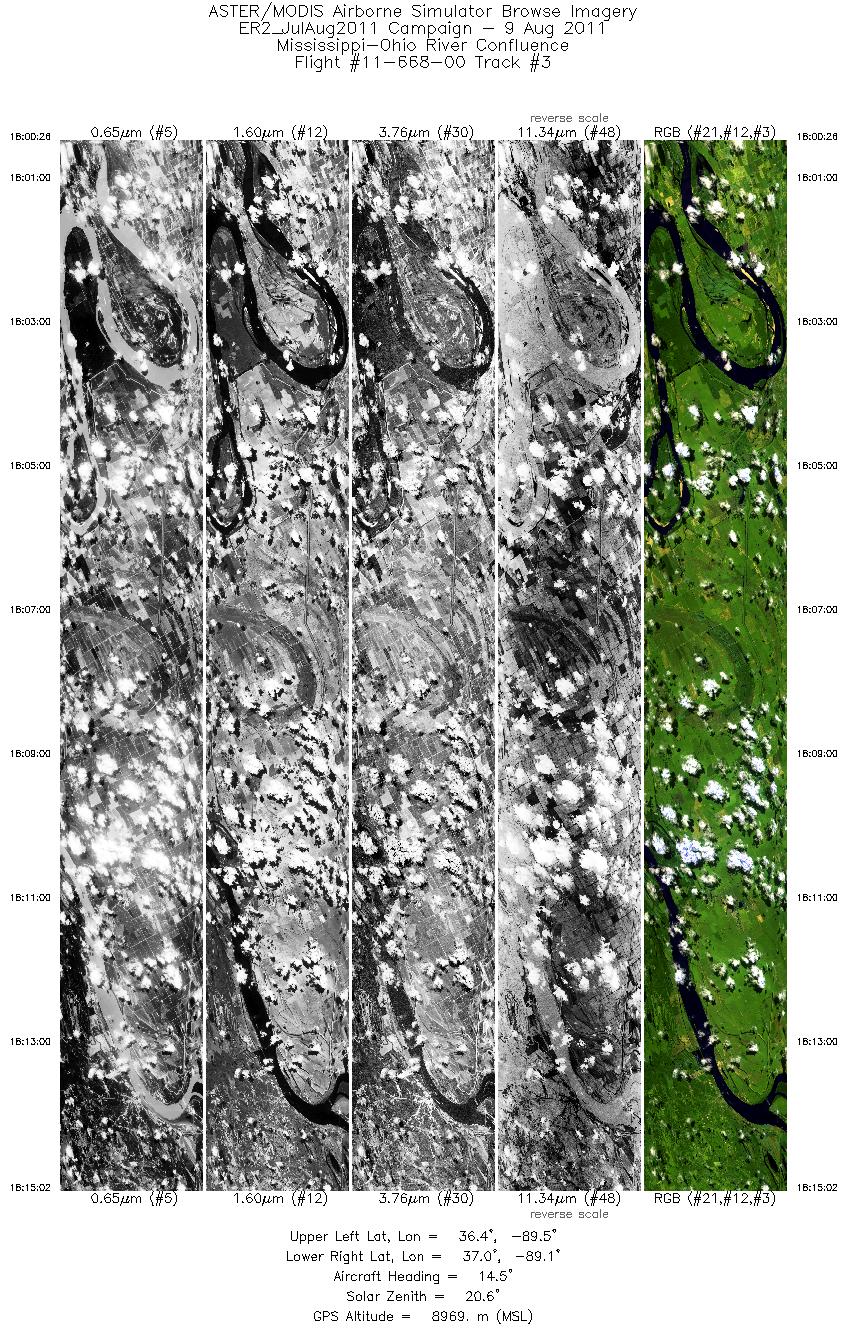
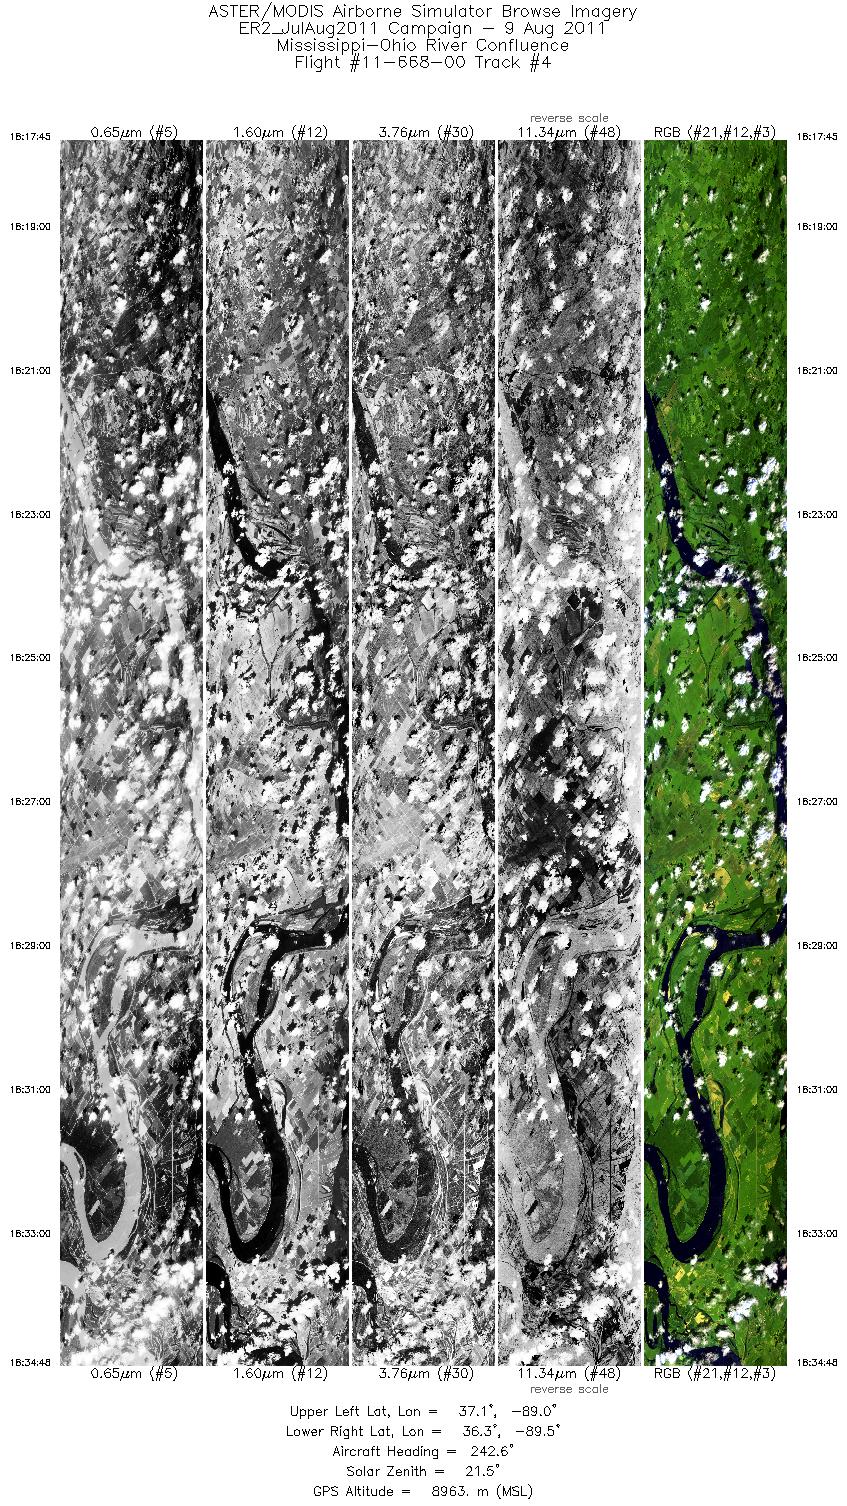
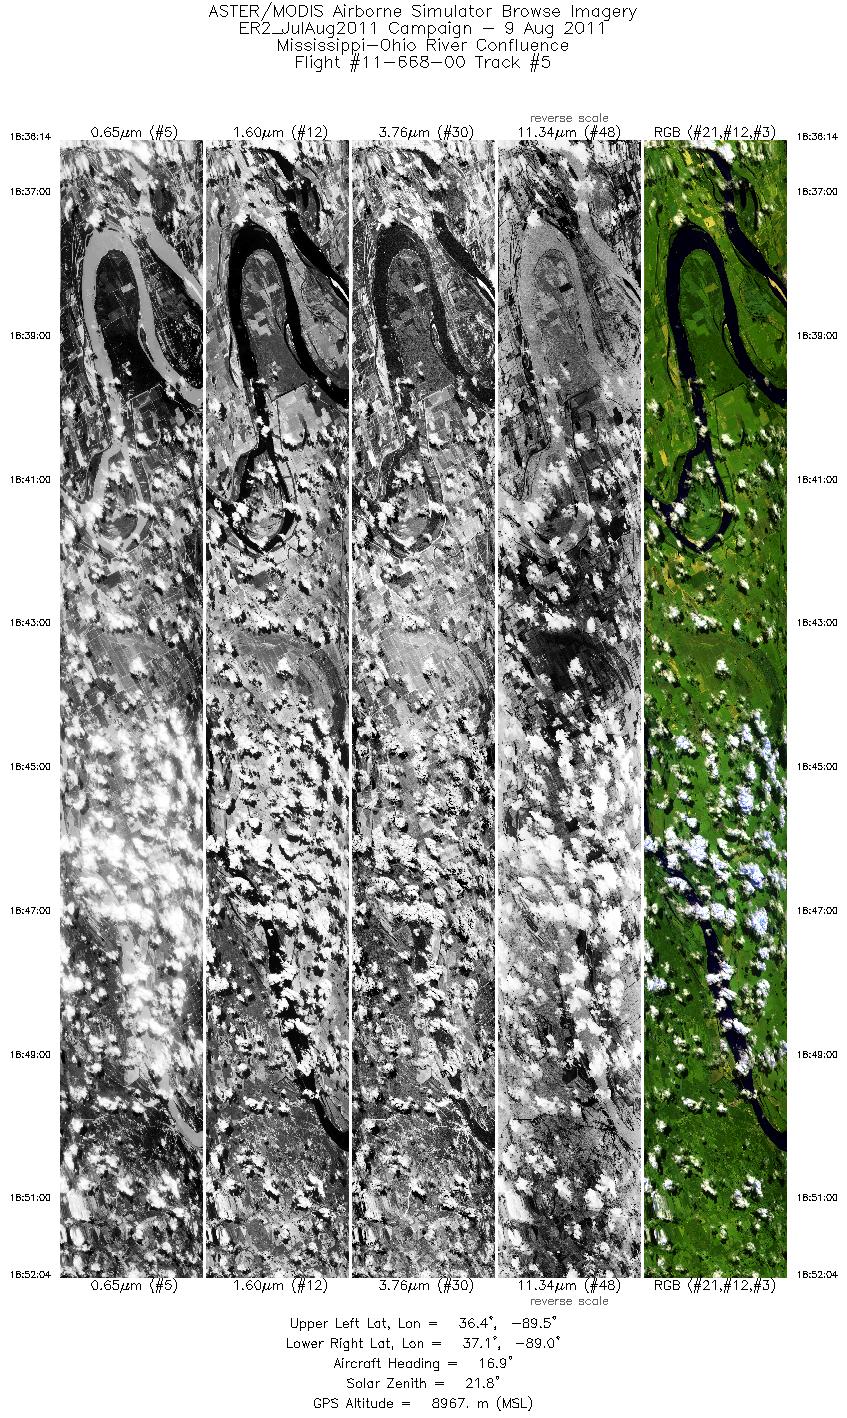
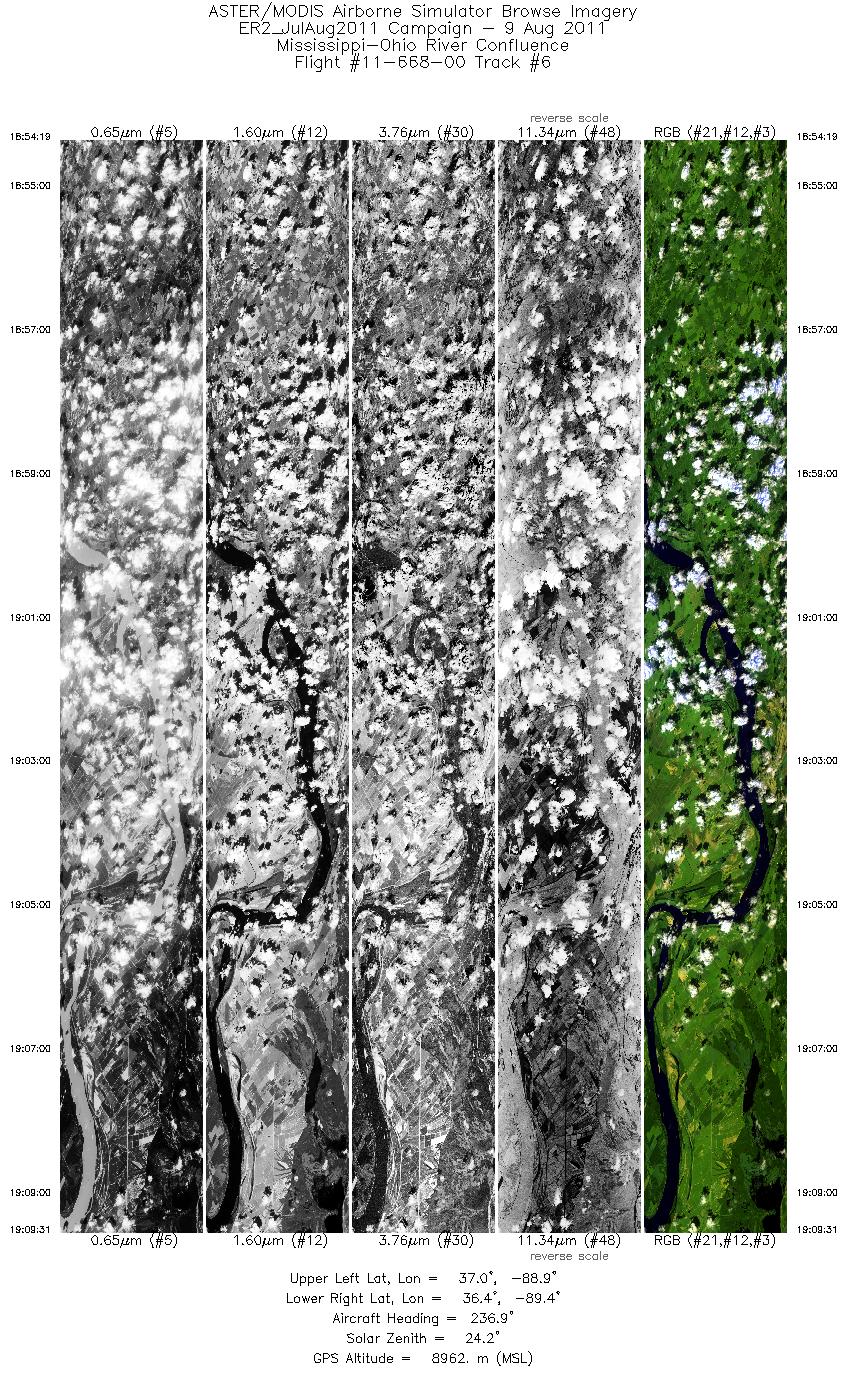
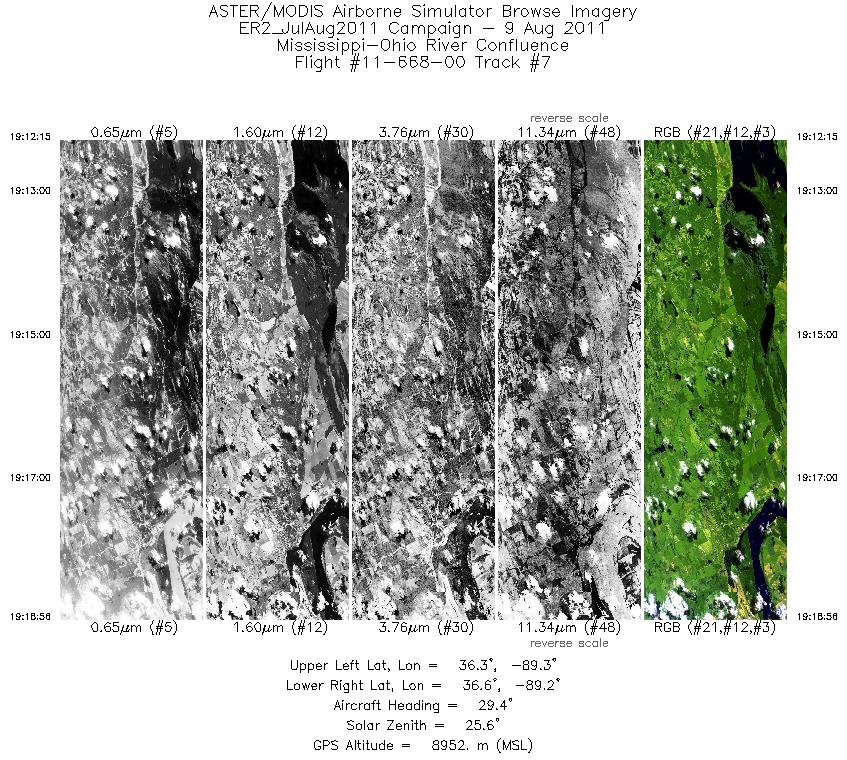
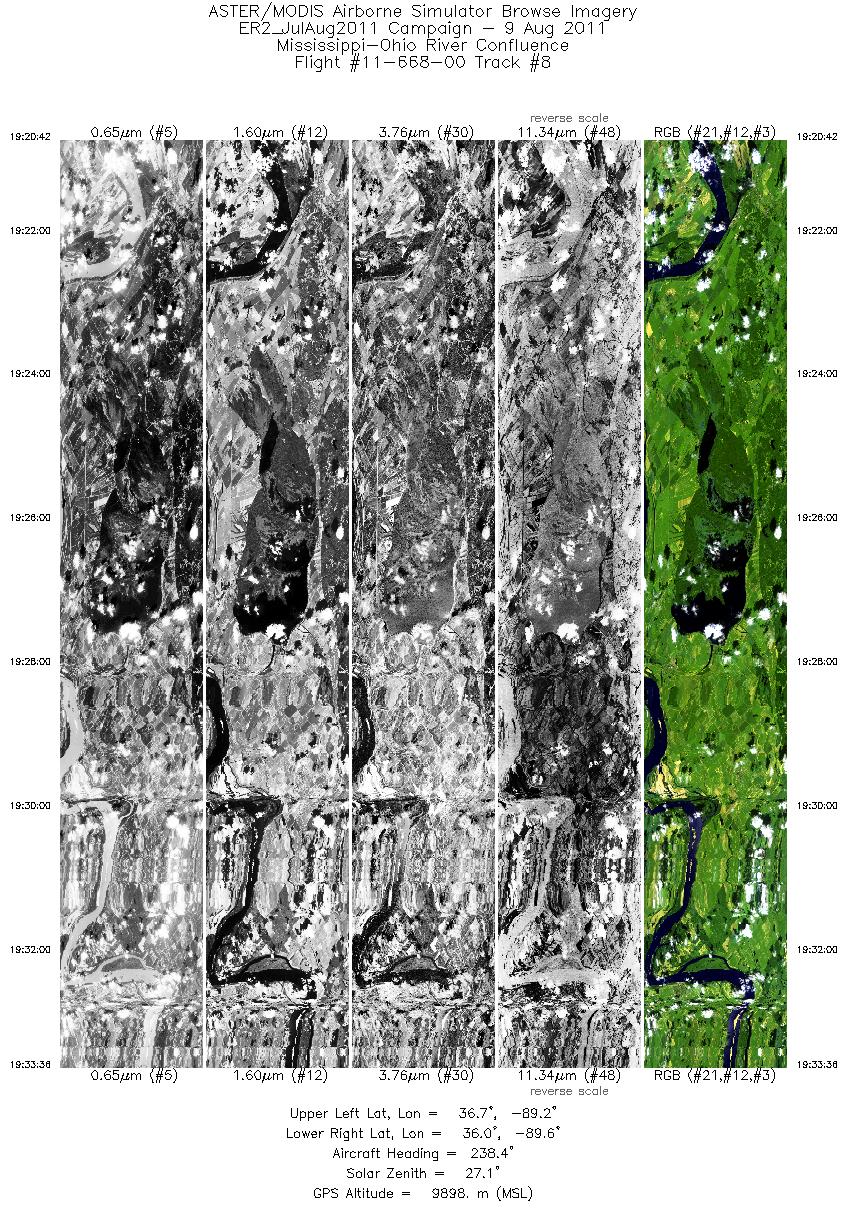
Flight: 11-668-00 Date: August 9, 2011 Aircraft: NASA ER2, #806 Deployment: Houston 2011 Flight Location: Mississippi-Ohio River Confluence Principal Investigator: Greenberg (UCD) Additional Sensors: AVIRIS / DCS |
||||||||||||||||||||||||||||||||||||||||||||||||||||||||||||||||||||||||||||||||||||
|
Data Evaluation Overall data quality is good. All data collected @28K MSL |
||||||||||||||||||||||||||||||||||||||||||||||||||||||||||||||||||||||||||||||||||||
|
Processing Information Level-1B Data in HDF format is available Flight Line Summary Spectral Band Configuration Spectral Response Function Table Spectral Response Function (text) |
||||||||||||||||||||||||||||||||||||||||||||||||||||||||||||||||||||||||||||||||||||
|
Browse Imagery Flight Tracks: 8 Scanlines: 40759 |
||||||||||||||||||||||||||||||||||||||||||||||||||||||||||||||||||||||||||||||||||||
|
||||||||||||||||||||||||||||||||||||||||||||||||||||||||||||||||||||||||||||||||||||


