
|
Sample Image

27 June 1997
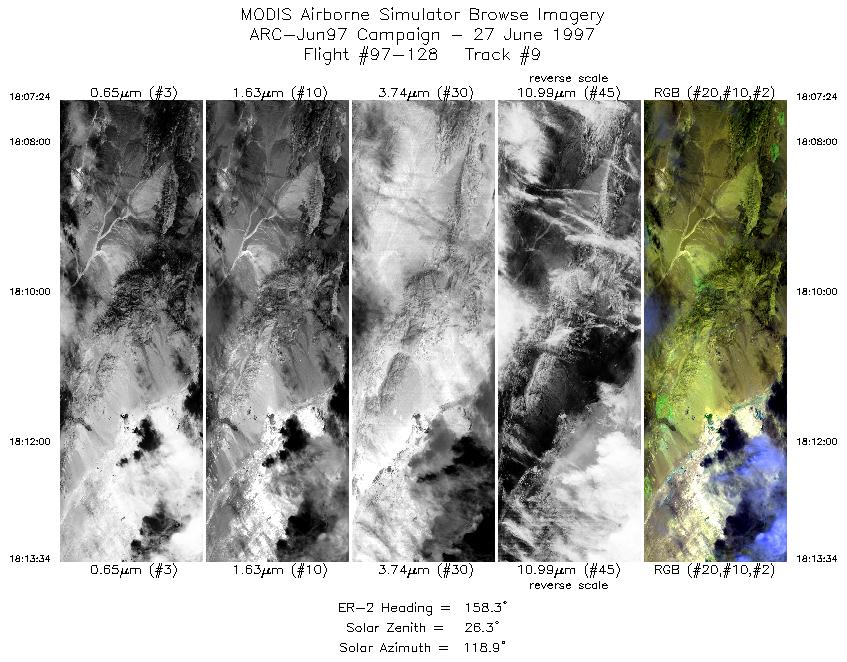
Track 09
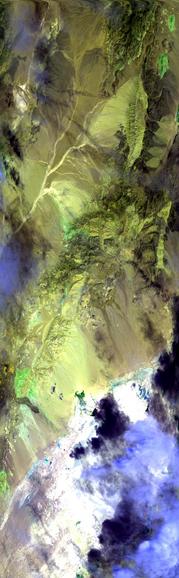
Flightline begins over Steptoe Valley, west of the Egan Range, Nevada. Proceeds southeast over the Schell Creek Range into Lake Valley, crossing over Highway 93.
R: 2.14 microns
G: 1.63 microns
B: 0.55 microns
|
|
Mission Summary
Date: Jun 27, 1997
ER-2 Flight Number: 97-128
Deployment: ARC-Jun97
Flight Location: Railroad Valley, Lunar Crater, NV (day)
Principal Investigators: Dr. Zhengming Wan (UCSB), Dr. Philip Slater (UofA), Dr. Ann Kahle (JPL)
Additional Sensors: 12" RC-10 (CIR), AVIRIS
Objective: Validation of an algorithim used to calculate land surface temperatures and emissivity based on thermal infrared data (Wan). AVIRIS data used in refining calibration techniques and data validation (Slater).
Level-1B Processing Information
Level-1B Data processed by: Ames Research Center
Level-1B Data Version: #10
Level-1B Configuration: (sample file)
Calibration Type: Preliminary
Calibration Version: 0.1
Temperature Adjustment: No
Status: Completed with preliminary calibration
|
|
Flight Track Map

|
Level-1B Browse Imagery
Straight Line Flight Tracks: 16
Scanlines Processed: 41367
Solar Azimuth and Zenith Angles
|
Browse Images
|
Click on the Flight Track number to load images.
Lat/Lon ranges are for the BEG-END scanline nadir pixels.
|
Flight
Track |
Time_Span
(GMT) |
Heading
(Deg) |
Lat_Range
(Deg_N) |
Lon_Range
(Deg_W) |
Length
(Scanlines) |
Altitude
(Meters) |
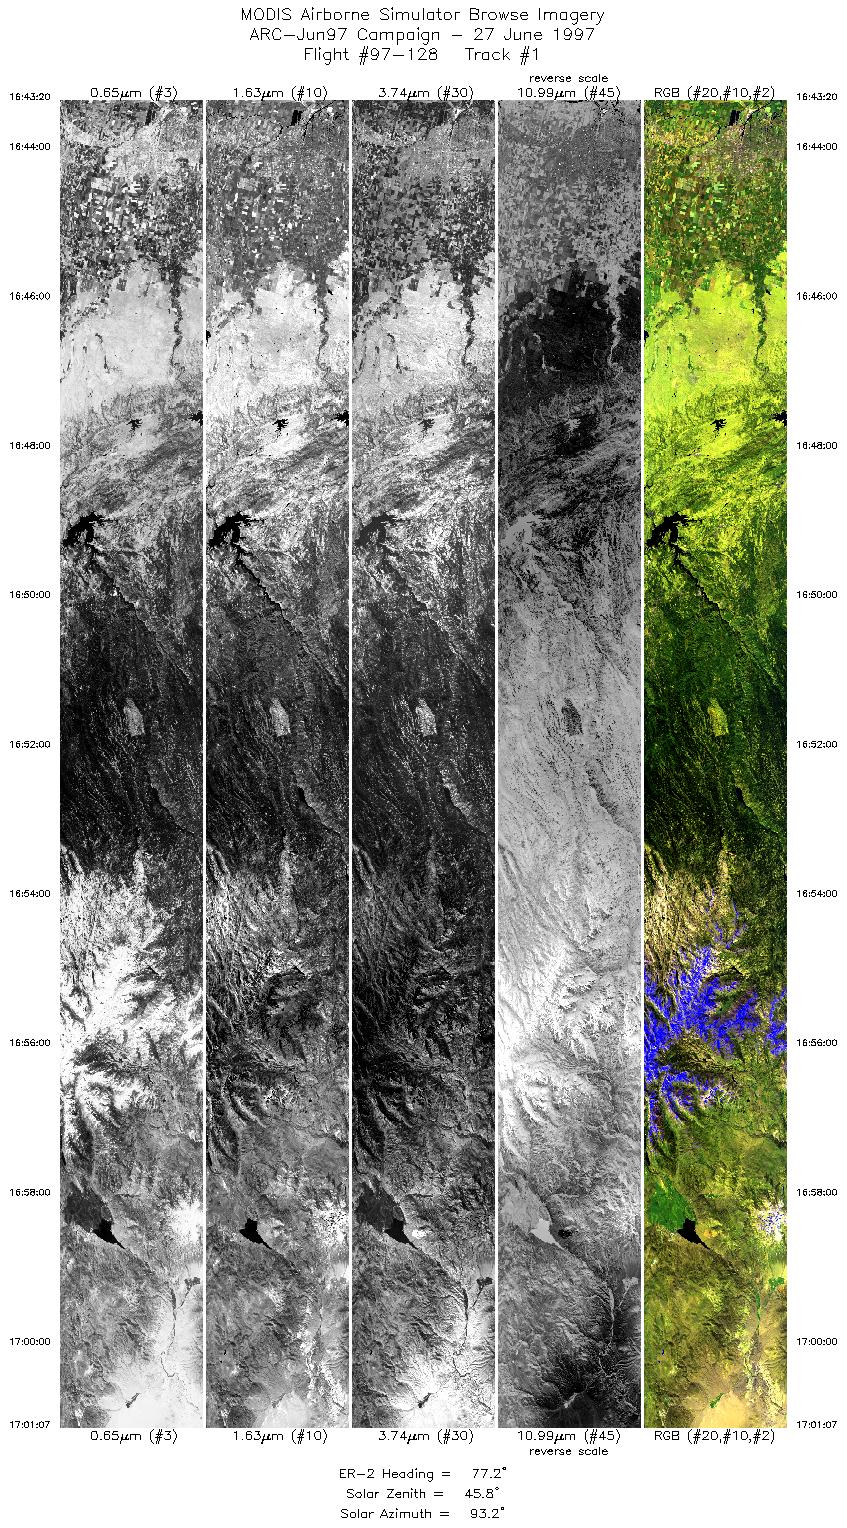
| 1 |
16:43-17:01 |
77 |
37.91-38.41 |
121.36-118.87 |
6644 |
~20000 |
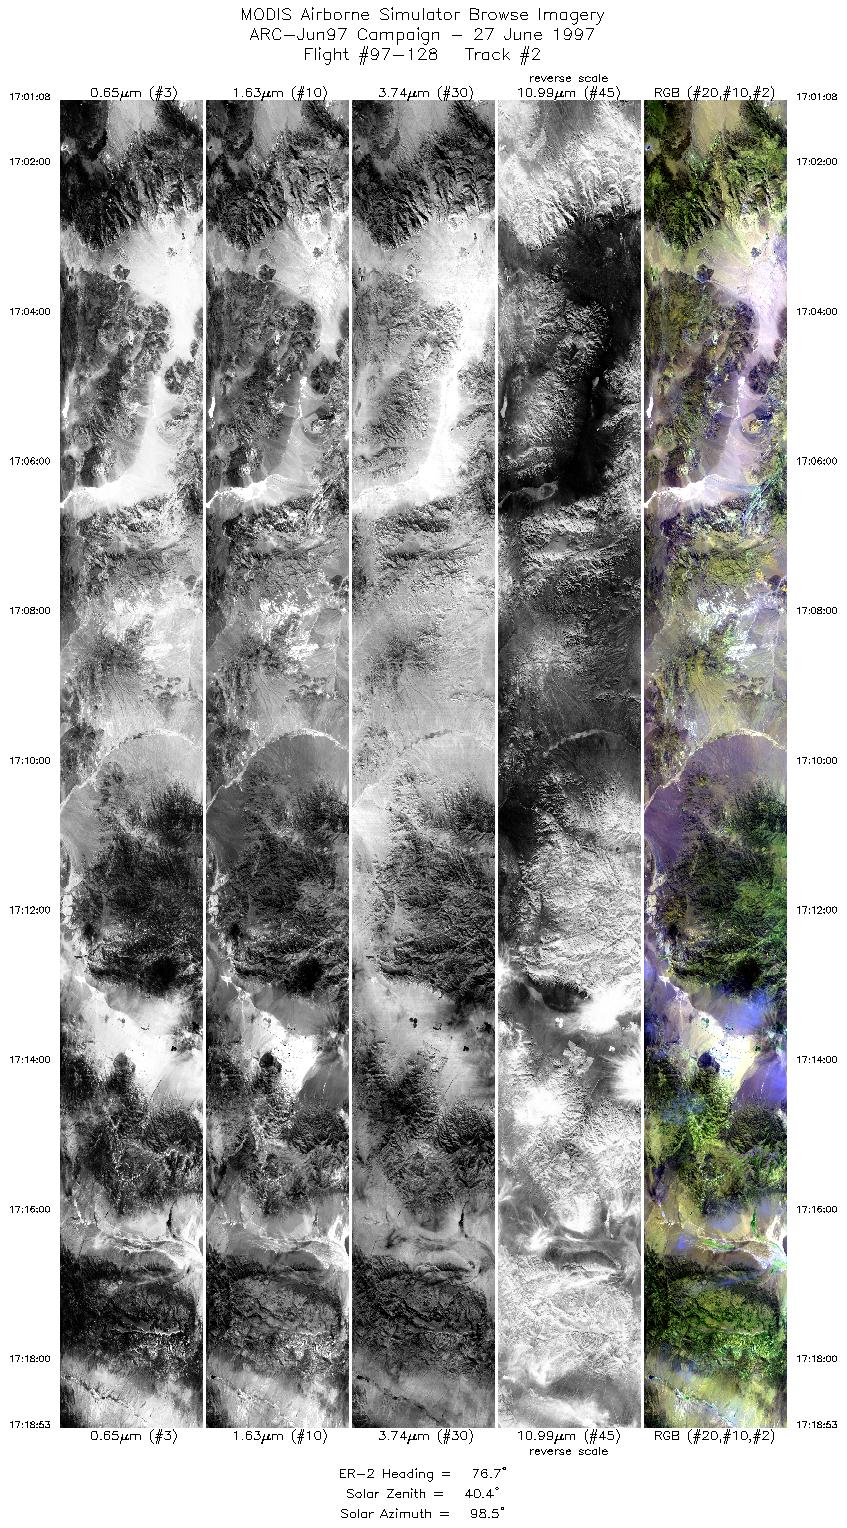
| 2 |
17:01-17:18 |
77 |
38.43-38.79 |
118.89-116.40 |
6643 |
~20000 |
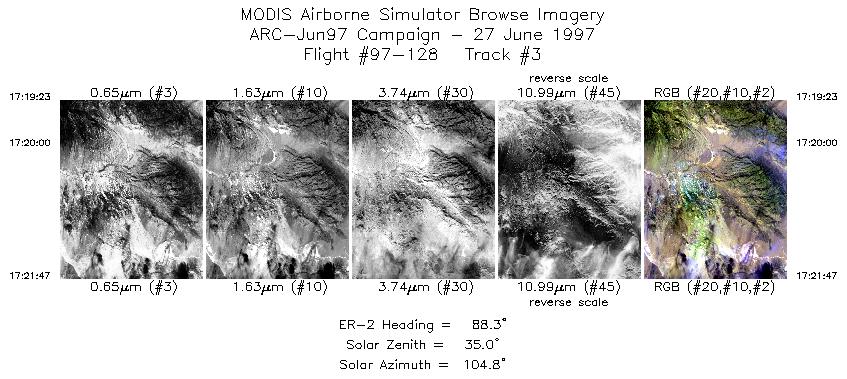
| 3 |
17:19-17:21 |
88 |
38.78-38.80 |
116.32-115.98 |
899 |
~20000 |
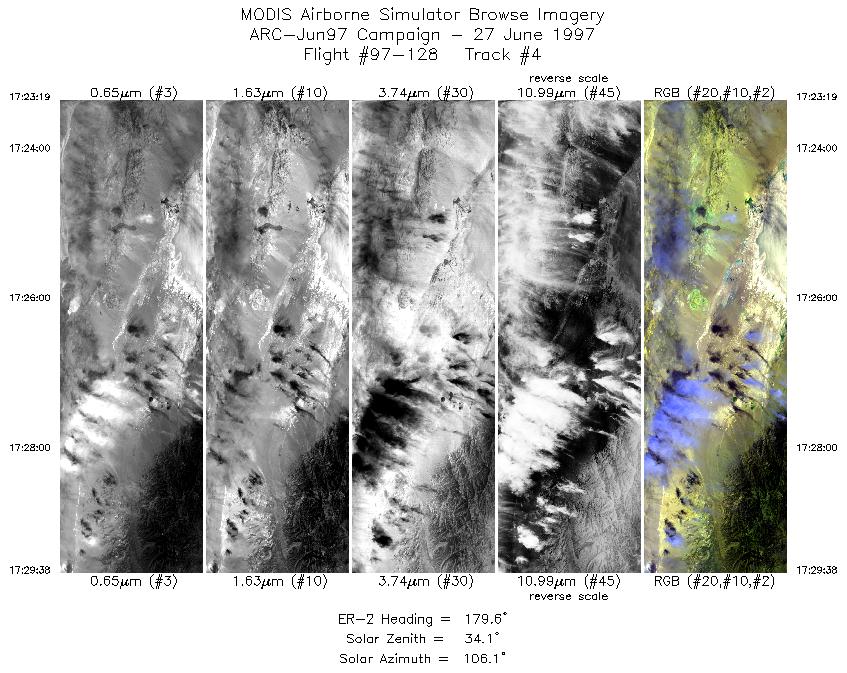
| 4 |
17:23-17:29 |
180 |
38.70-38.00 |
115.83-115.83 |
2366 |
~20000 |
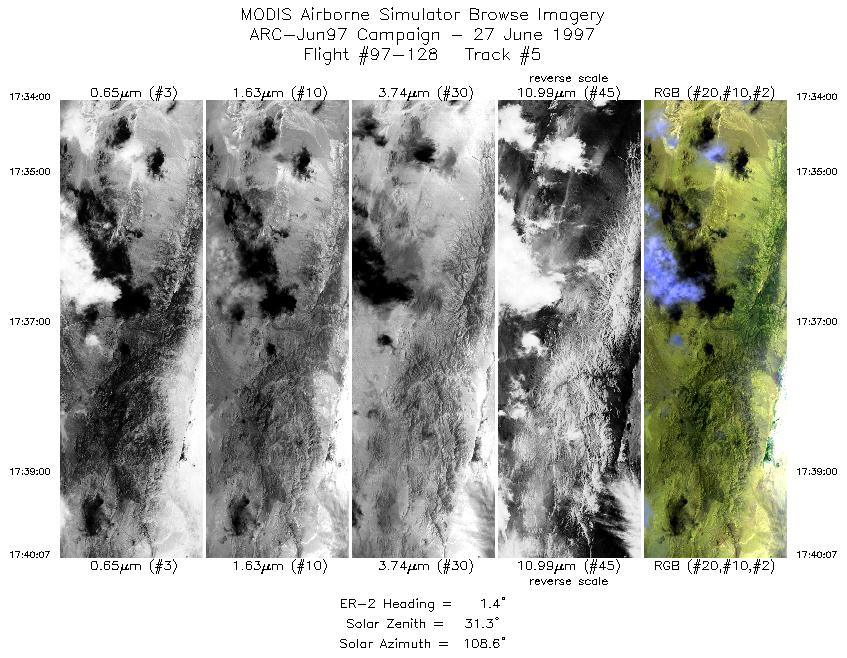
| 5 |
17:34-17:40 |
1 |
38.03-38.73 |
115.42-115.42 |
2291 |
~20000 |
| 6 |
17:43-17:49 |
181 |
38.74-38.00 |
115.12-115.12 |
2472 |
~20000 |
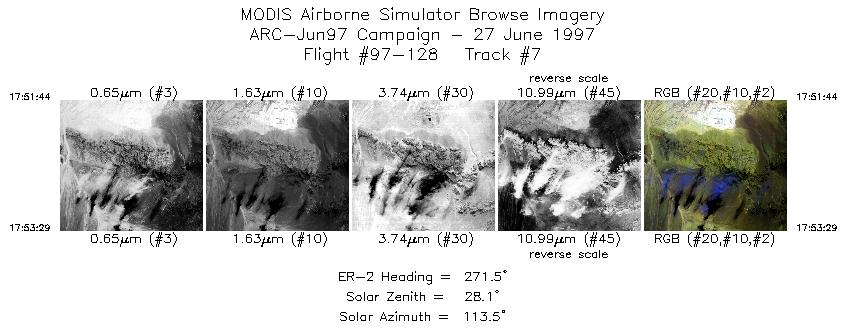
| 7 |
17:51-17:53 |
272 |
37.88-37.89 |
115.31-115.56 |
657 |
~20000 |
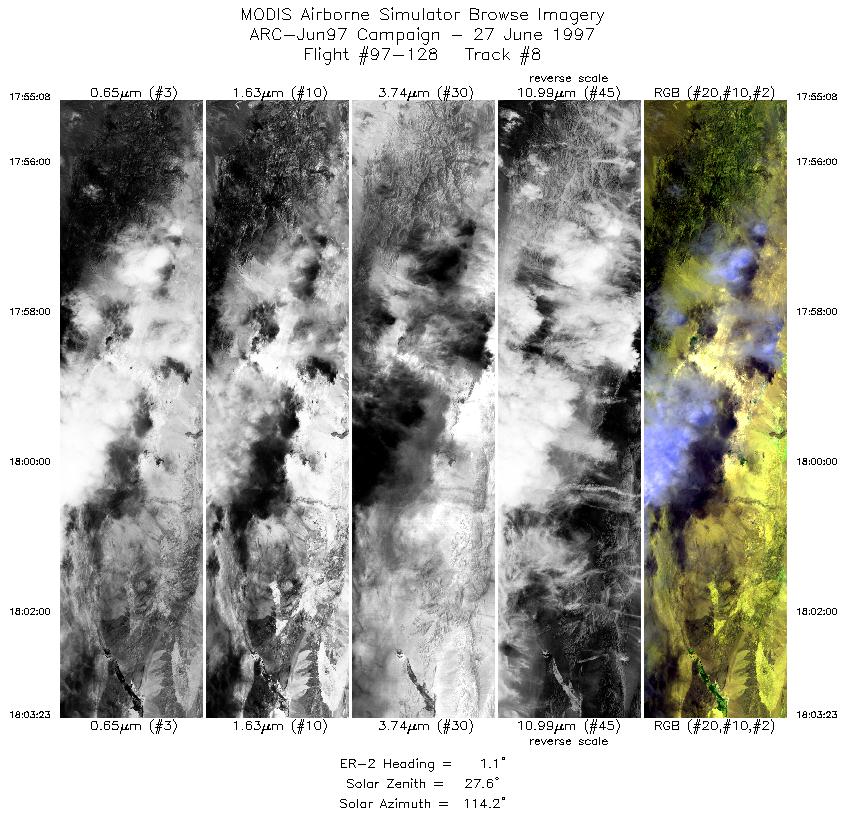
| 8 |
17:55-18:03 |
1 |
38.01-38.94 |
115.71-115.71 |
3091 |
~20000 |
| 9 |
18:07-18:13 |
158 |
38.99-38.36 |
115.95-115.64 |
2311 |
~20000 |
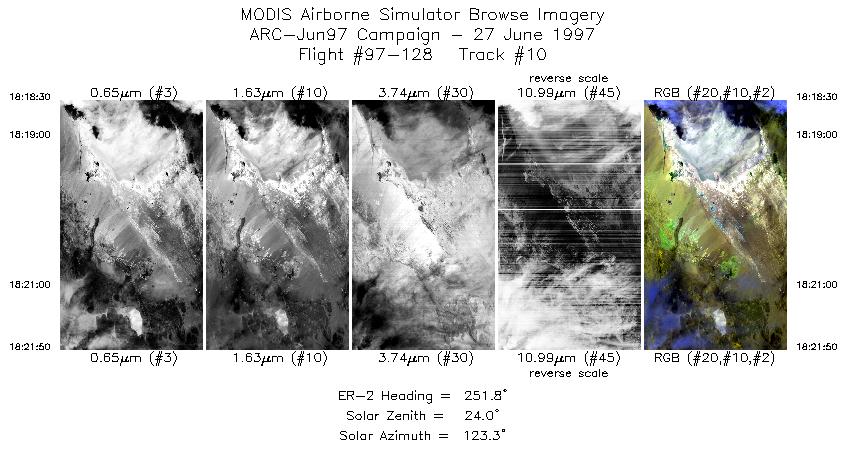
| 10 |
18:18-18:21 |
252 |
38.50-38.38 |
115.59-116.05 |
1250 |
~20000 |
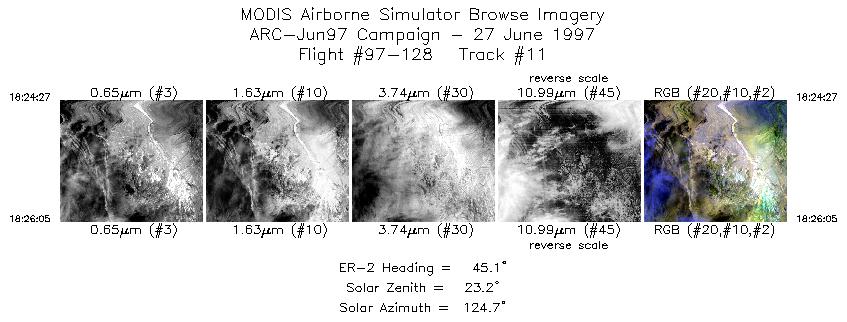
| 11 |
18:24-18:26 |
45 |
38.56-38.70 |
116.20-116.04 |
613 |
~20000 |
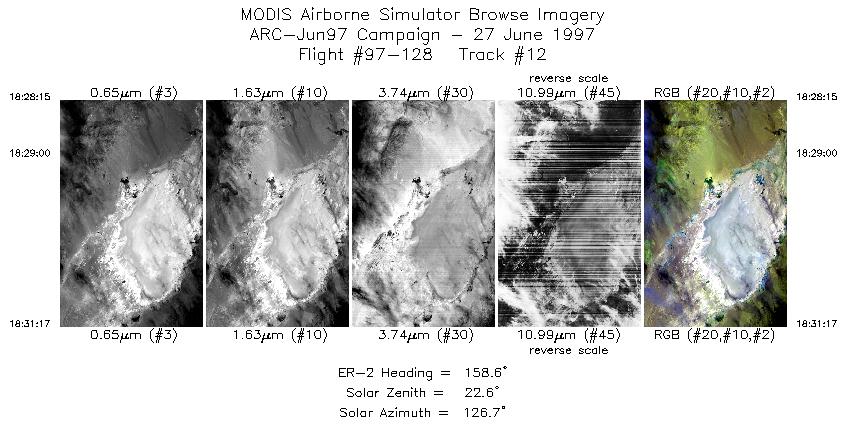
| 12 |
18:28-18:31 |
159 |
38.67-38.35 |
115.80-115.64 |
1136 |
~20000 |
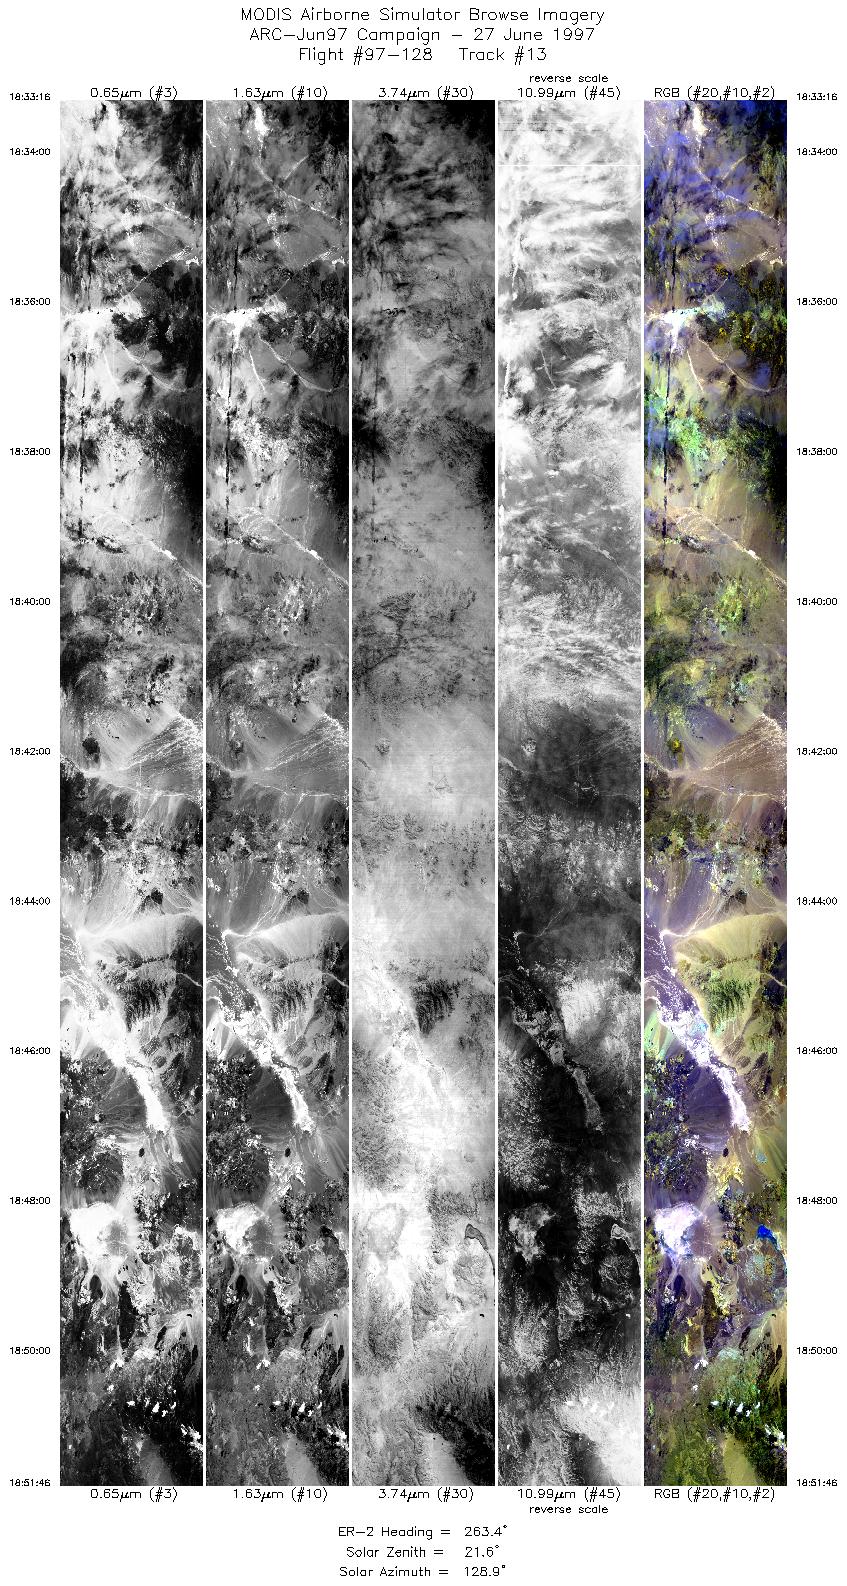
| 13 |
18:33-18:51 |
263 |
38.21-37.94 |
115.78-118.45 |
6932 |
~20000 |
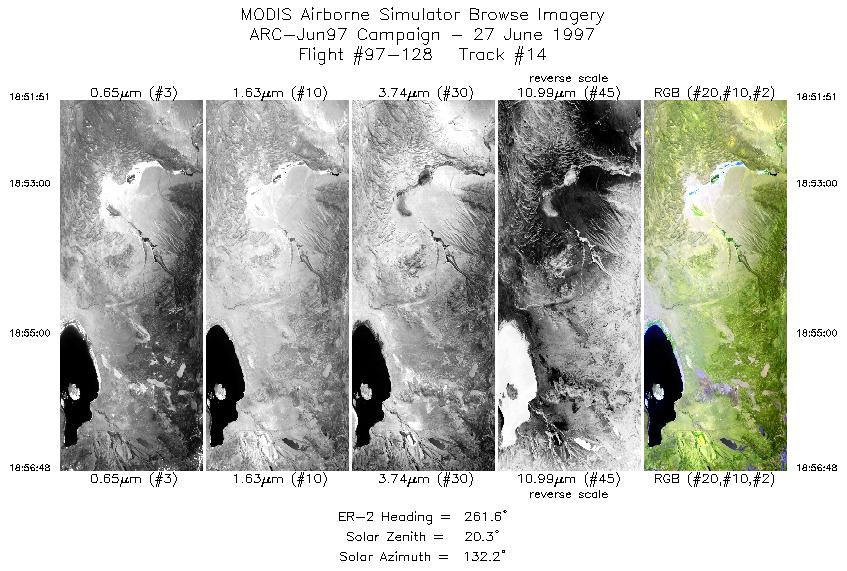
| 14 |
18:51-18:56 |
262 |
37.94-37.86 |
118.46-119.17 |
1855 |
~20000 |
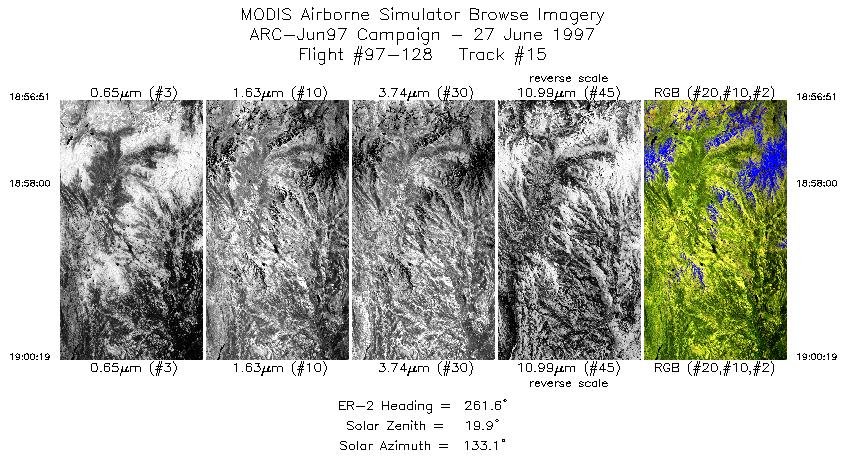
| 15 |
18:56-19:00 |
262 |
37.86-37.80 |
119.18-119.67 |
1300 |
~20000 |
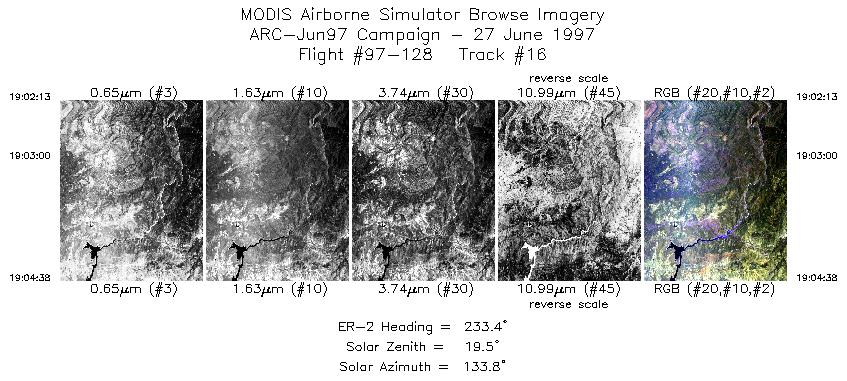
| 16 |
19:02-19:04 |
233 |
37.74-37.58 |
119.94-120.22 |
907 |
~20000 |
|
Images 01 through 16 in sequence |
Data Evalutation
Most port 3 and port 4 channels in Track 1 noisy data. Data quality is good
in middle flight tracks. In track 16, channel 12 has faint black bands and
white snow noise; channels 44-50 have thin black stripes across data.
Spectral Summary
Spectral Band Configuration (preliminary)
Spectral Response Files (preliminary)
Level-1B Data Distribution
NASA Goddard Space Flight Center DAAC
Related Web Sites
NASA ER-2 1997 Flight Summary Reports
JPL AVIRIS Web Page
Airborne Sensors Facility Page
NASA ER-2 Aircraft Program
|
|
