
|
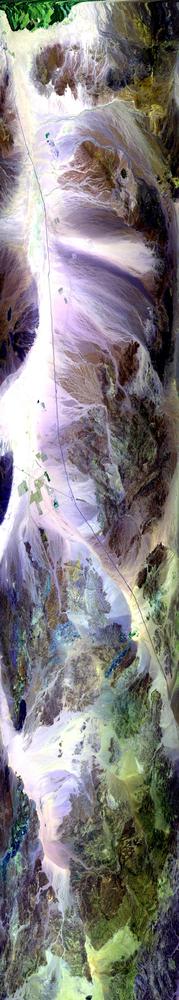
Sample Image

26 June 1997
Track 07
scanlines 1-4000 of 9605

|
|
Mission Summary
Date: Jun 26, 1997
ER-2 Flight Number: 97-127
Deployment: ARC-Jun97
Flight Location: Blythe, CA
Principal Investigator: Dr. Stephen Sandor (TRW)
Additional Sensors: 12" RC-10 (CIR), AVIRIS
Objective:
Level-1B Processing Information
Level-1B Data processed by: Ames Research Center
Level-1B Data Version: #09
Level-1B Configuration: (sample file not available)
Calibration Type: Final
Calibration Version: 1.0
Temperature Adjustment: No
Status: Completed with final calibration
|
|
Flight Track Map

|
Level-1B Browse Imagery
Straight Line Flight Tracks: 08
Scanlines Processed: 39480
Solar Azimuth and Zenith Angles
|
Browse Images
|
Click on the Flight Track number to load images.
Lat/Lon ranges are for the BEG-END scanline nadir pixels.
|
Flight
Track |
Time_Span
(GMT) |
Heading
(Deg) |
Lat_Range
(Deg_N) |
Lon_Range
(Deg_W) |
Length
(Scanlines) |
Altitude
(Meters) |
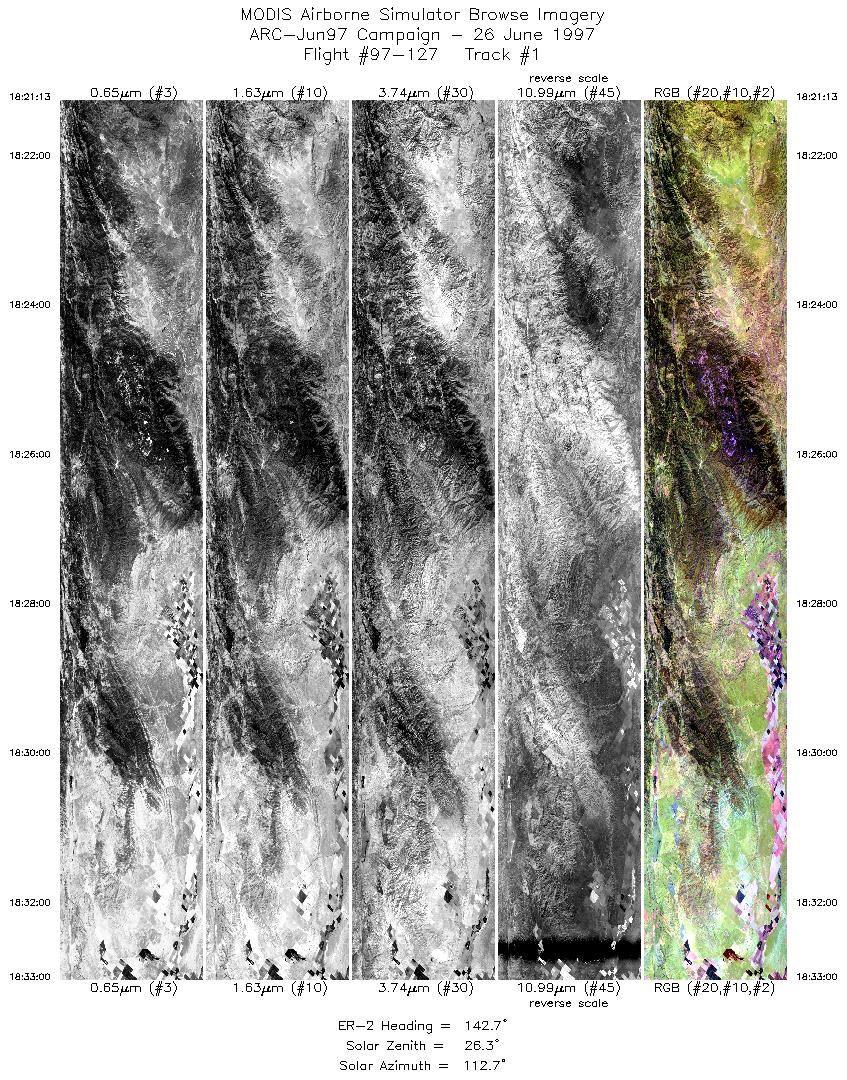
| 1 |
18:21-18:33 |
143 |
36.70-35.67 |
120.99-120.00 |
4404 |
~20000 |
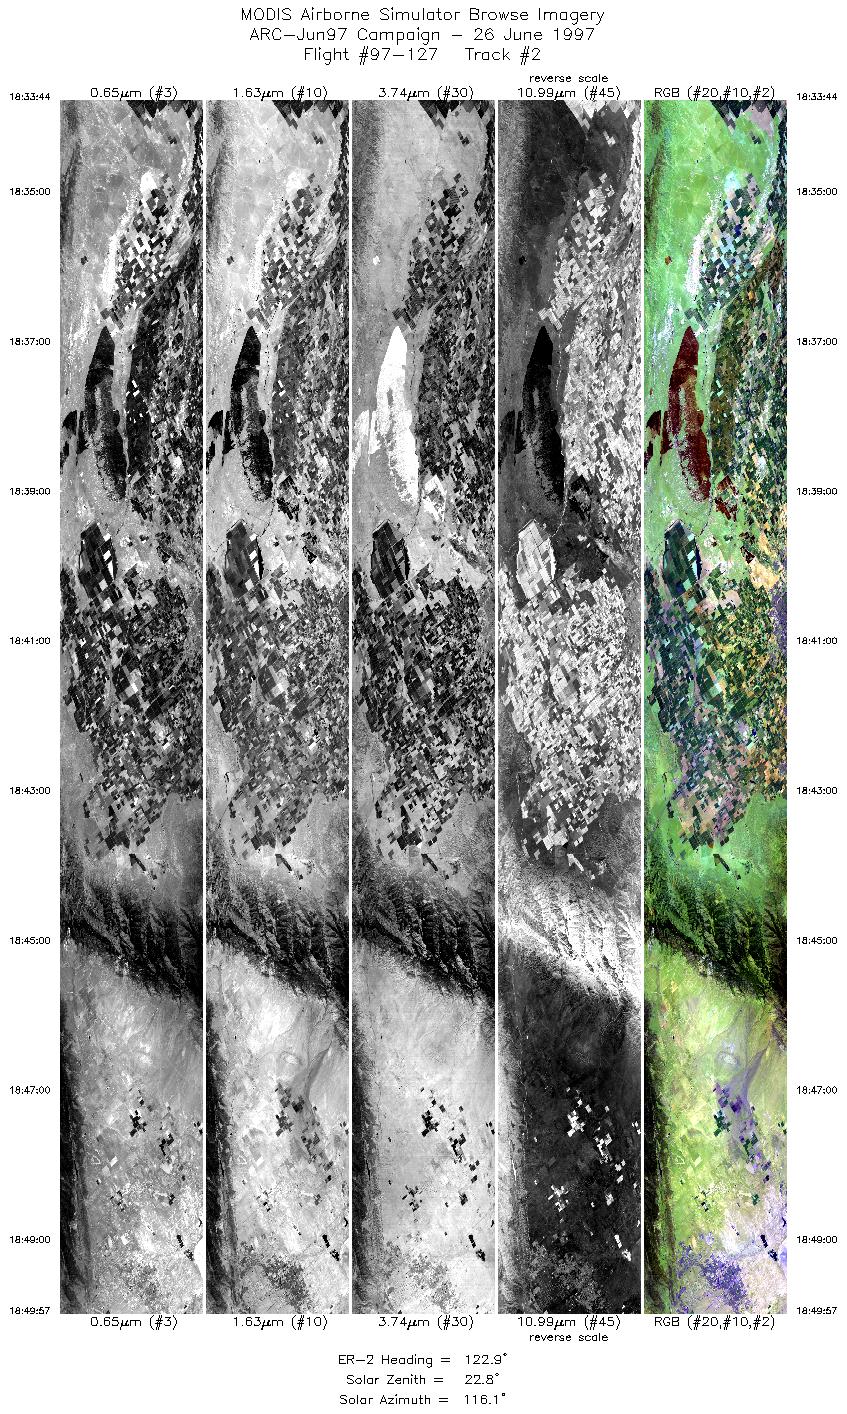
| 2 |
18:33-18:49 |
123 |
35.62-34.65 |
119.93-118.09 |
6071 |
~20000 |
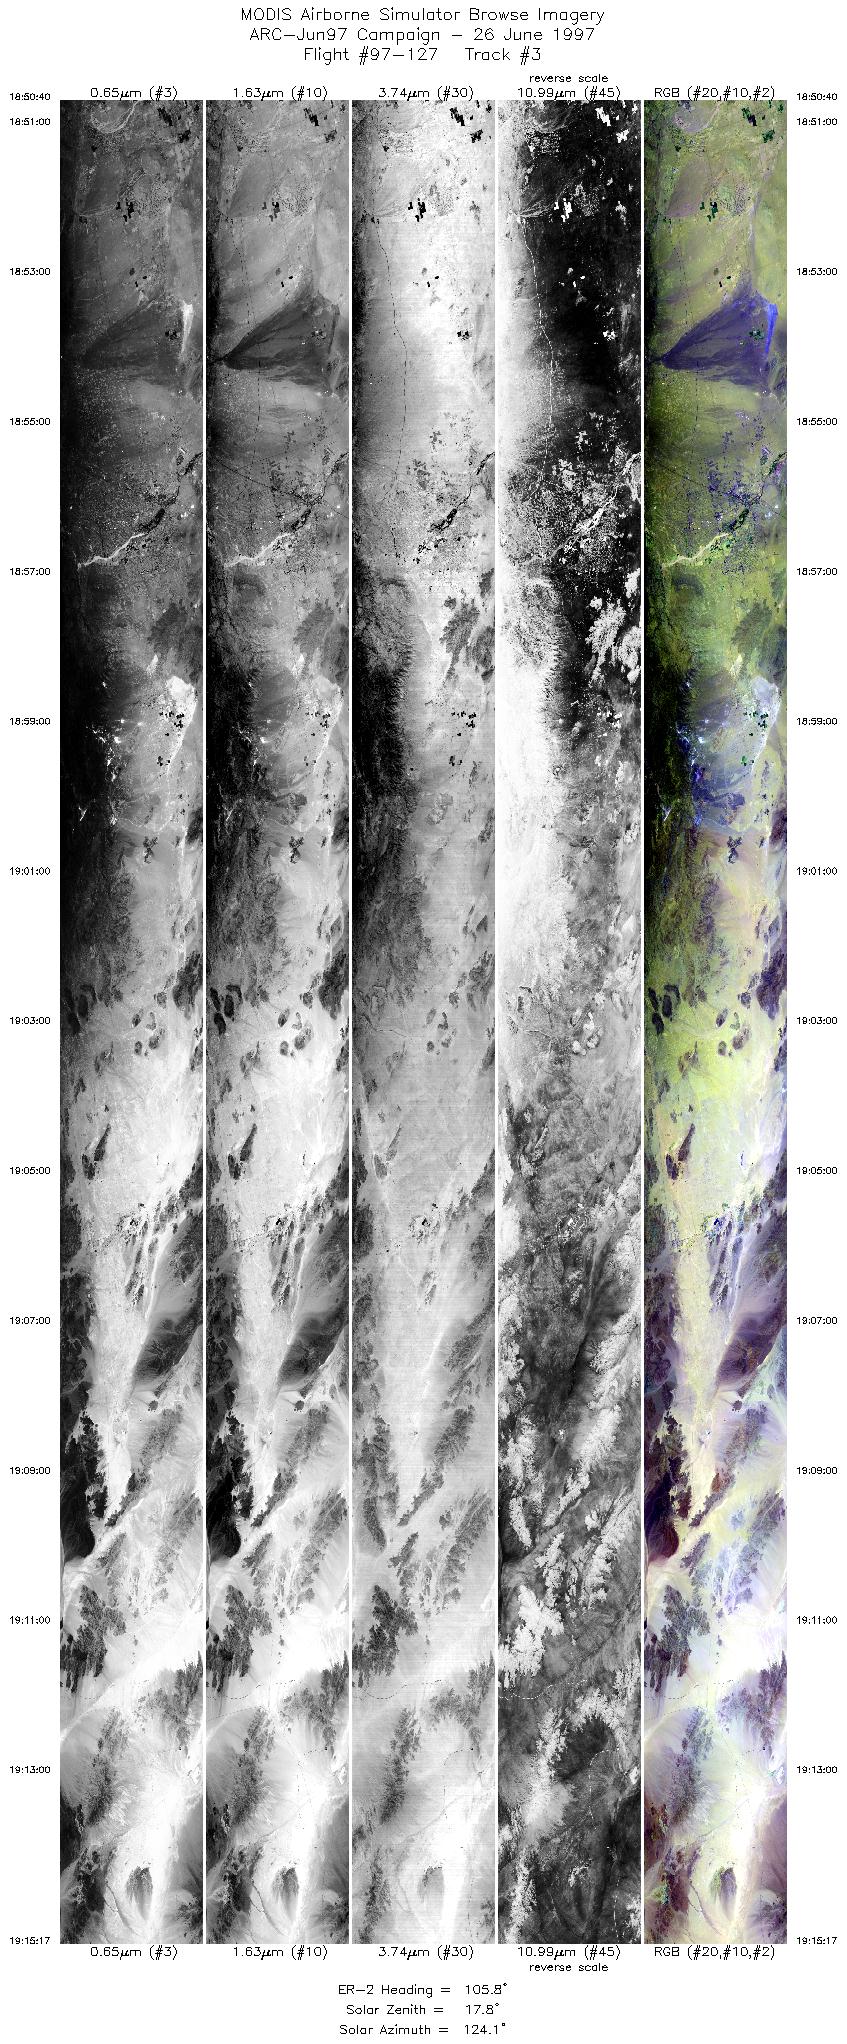
| 3 |
18:50-19:15 |
106 |
34.62-33.99 |
118.01-114.80 |
9221 |
~20000 |
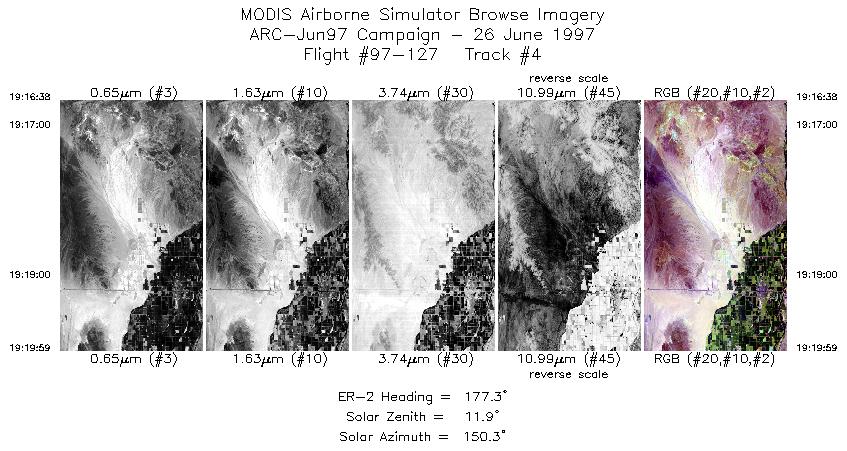
| 4 |
19:16-19:19 |
177 |
33.89-33.52 |
114.70-114.70 |
1255 |
~20000 |
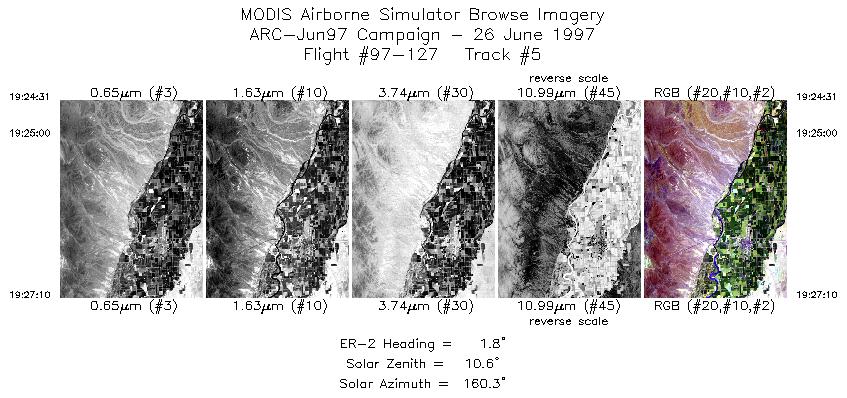
| 5 |
19:24-19:27 |
2 |
33.39-33.70 |
114.54-114.54 |
994 |
~20000 |
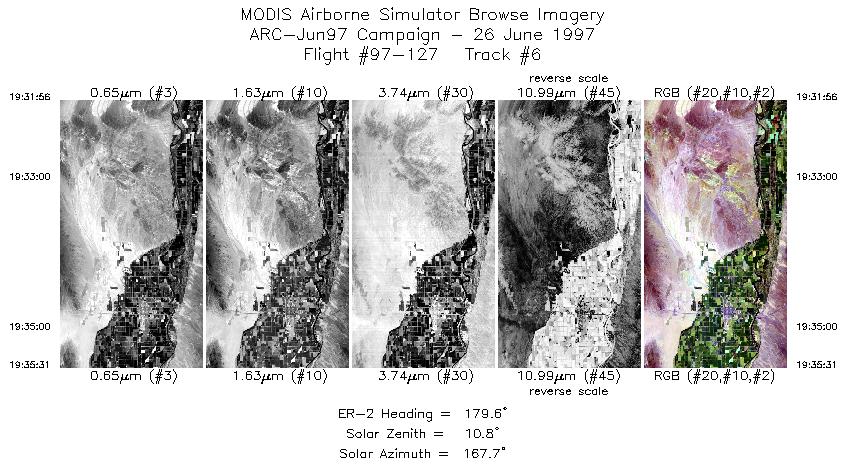
| 6 |
19:31-19:35 |
180 |
33.92-33.52 |
114.61-114.62 |
1342 |
~20000 |
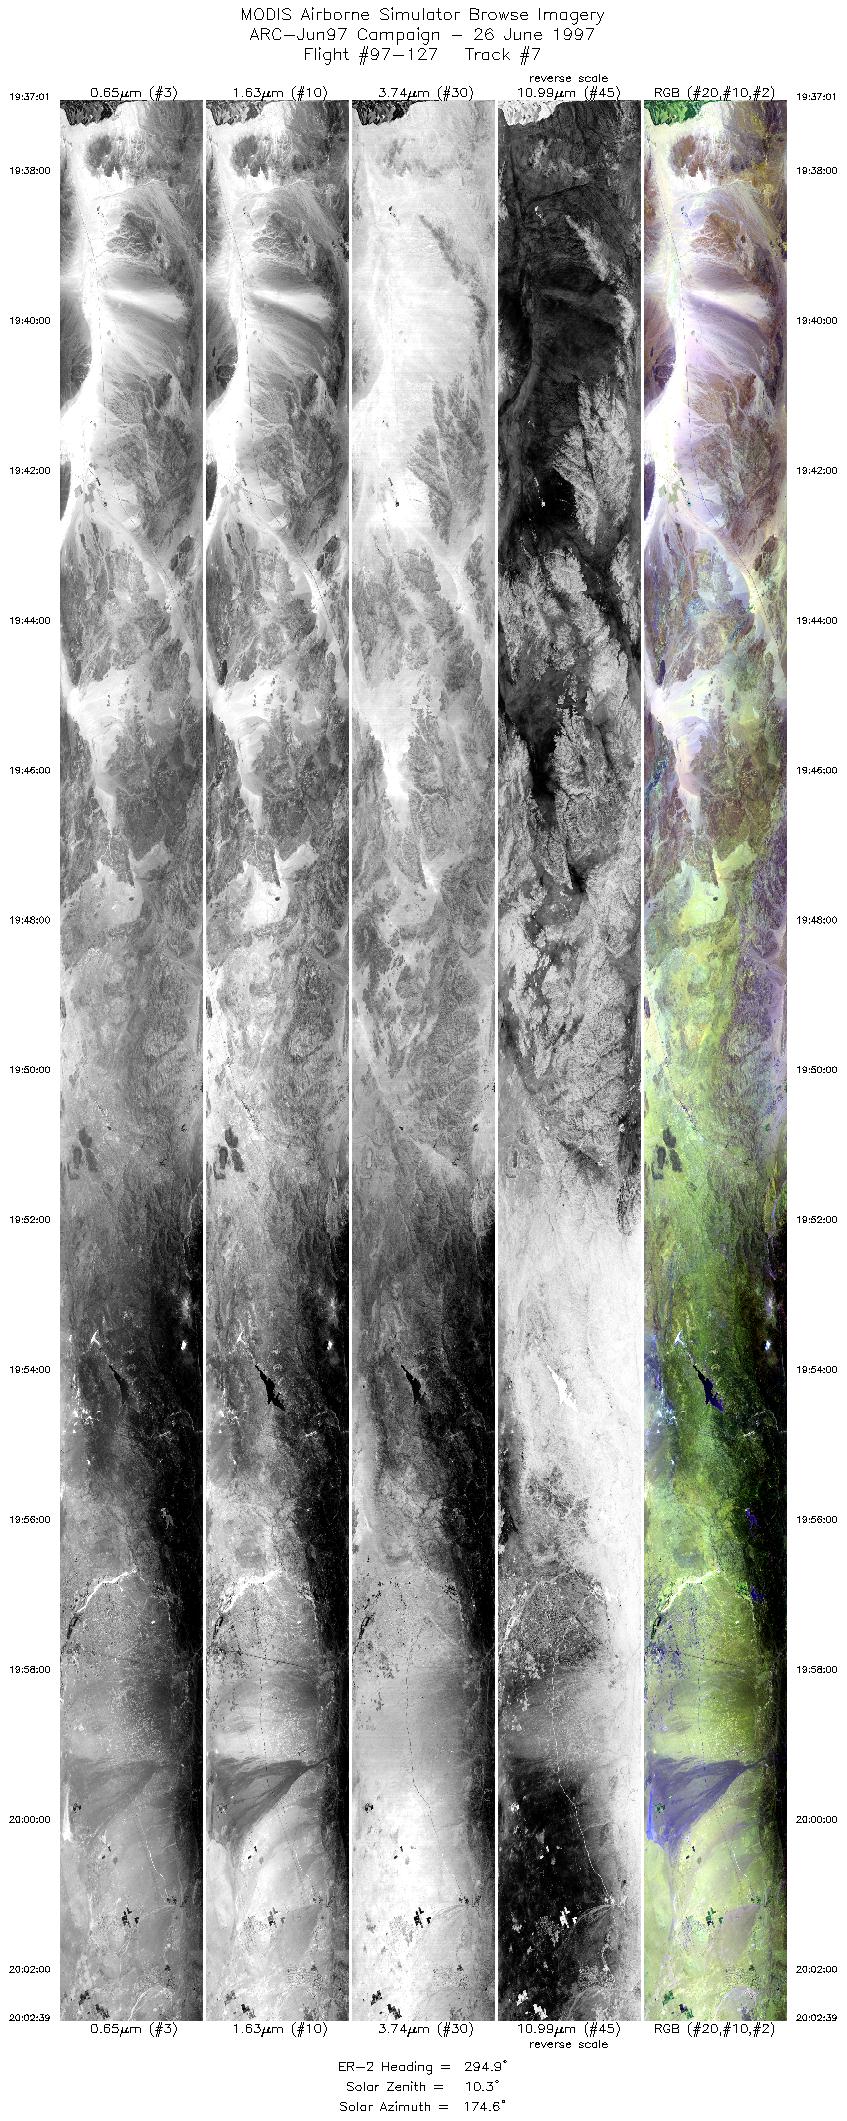
| 7 |
19:37-20:02 |
295 |
33.44-34.62 |
114.74-118.01 |
9605 |
~20000 |
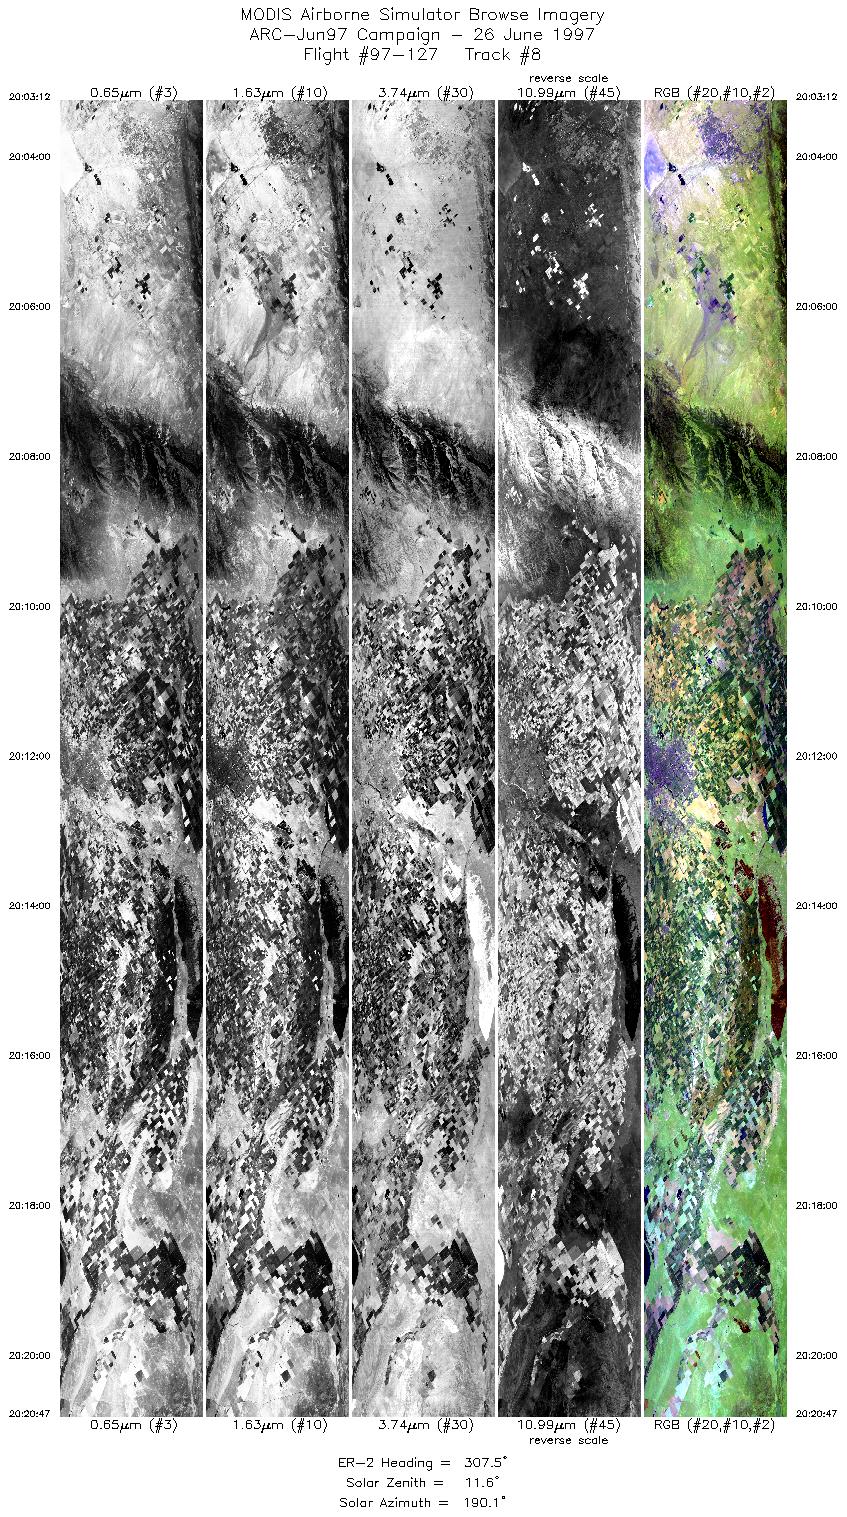
| 8 |
20:03-20:20 |
307 |
34.65-35.85 |
118.09-120.12 |
6588 |
~20000 |
|
Images 01 through 08 in sequence |
Data Evalutation
Data quality is excellent.
Spectral Summary
Spectral Band Configuration
Spectral Response Files
Level-1B Data Distribution
NASA Goddard Space Flight Center DAAC
Related Web Sites
NASA ER-2 1997 Flight Summary Reports
JPL AVIRIS Web Page
Airborne Sensors Facility Page
NASA ER-2 Aircraft Program
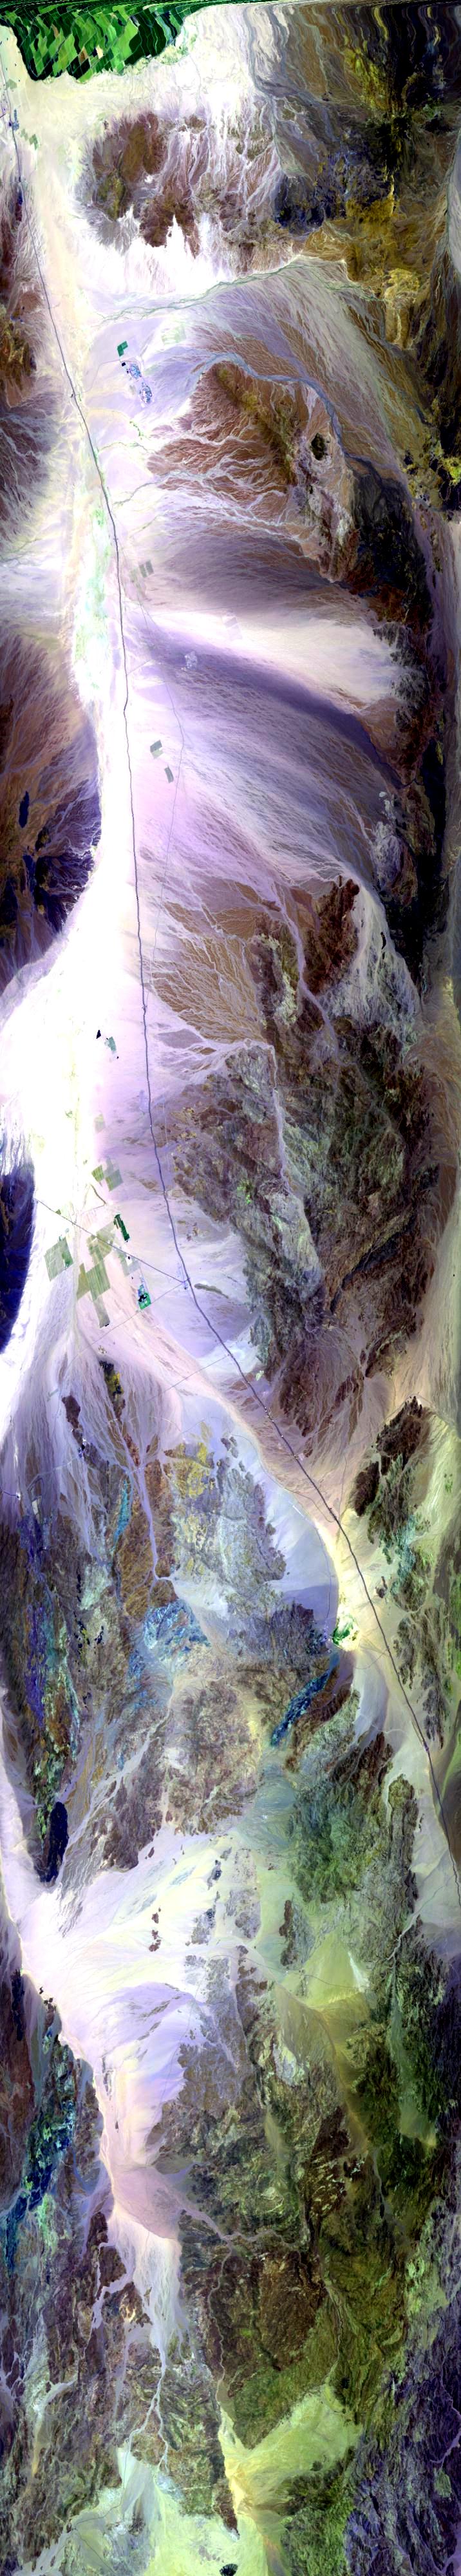
Sample Image
The flightline image to the left follows Interstate 10 through Chuckwalla Valley, west of Blythe, California. The Chuckwalla Mountains, south of Chuckwalla Valley, are to the right in this image.
R: 2.14 microns
G: 1.63 microns
B: 0.55 microns
|
|