
|
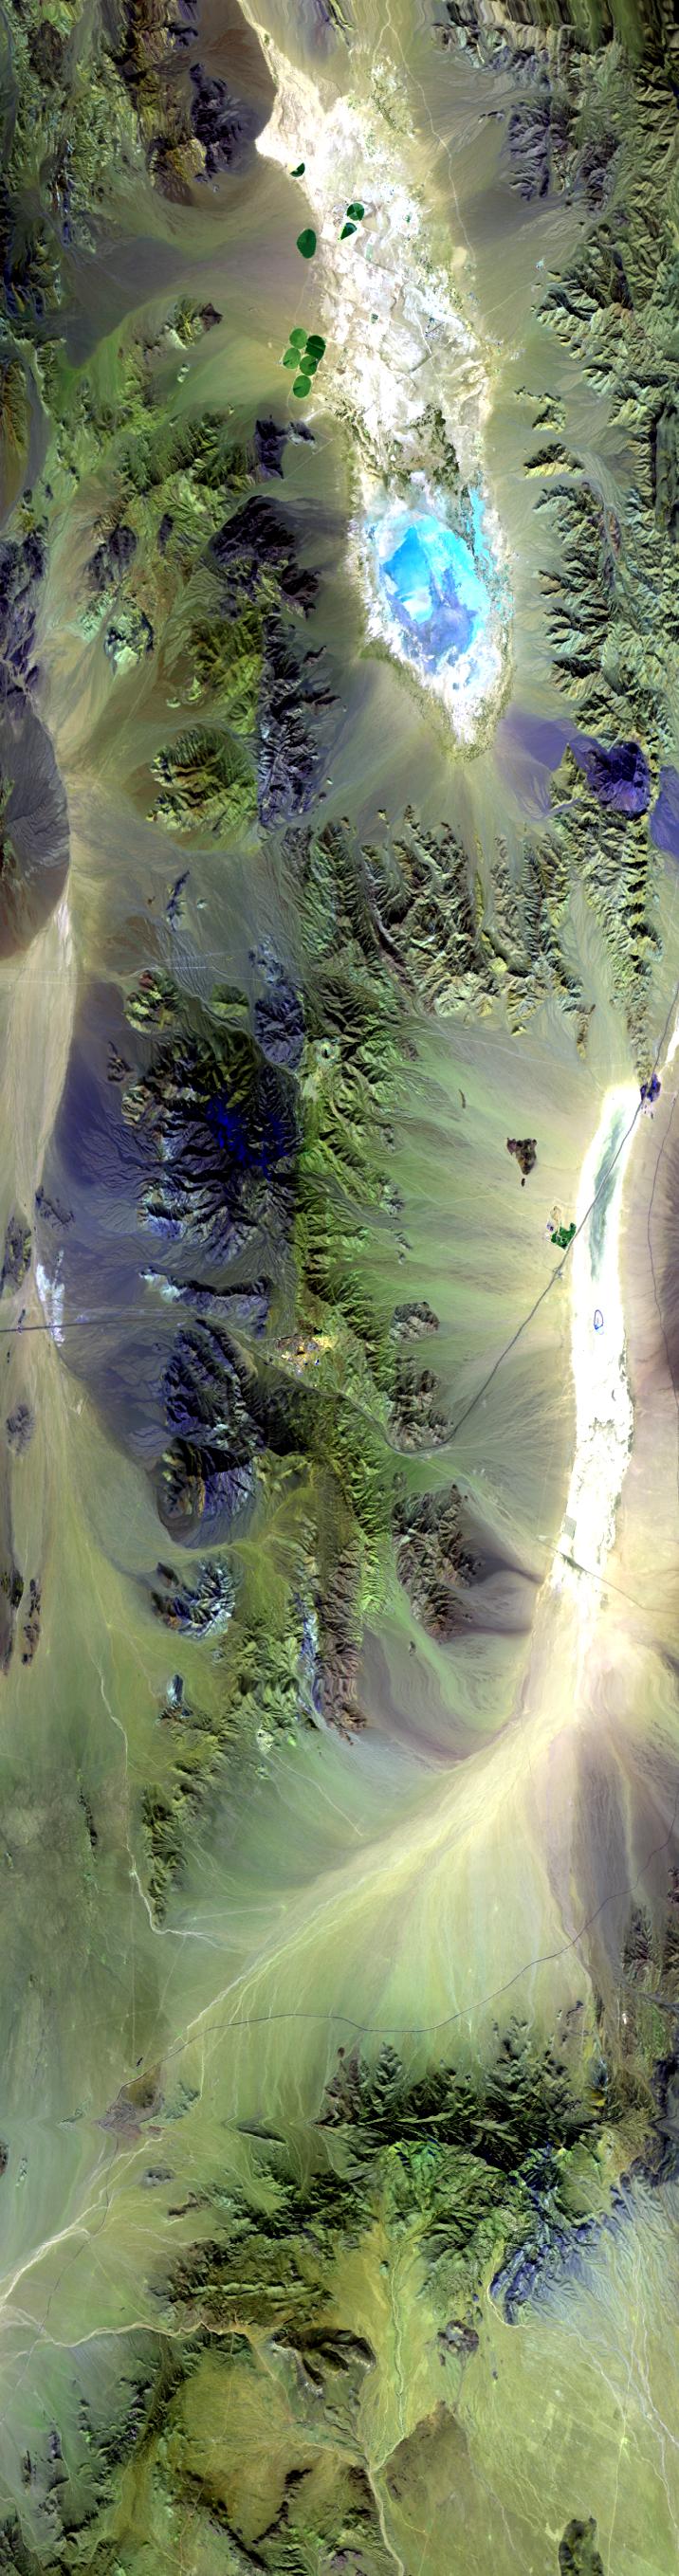
Sample Image

04 March 1997
Track 06


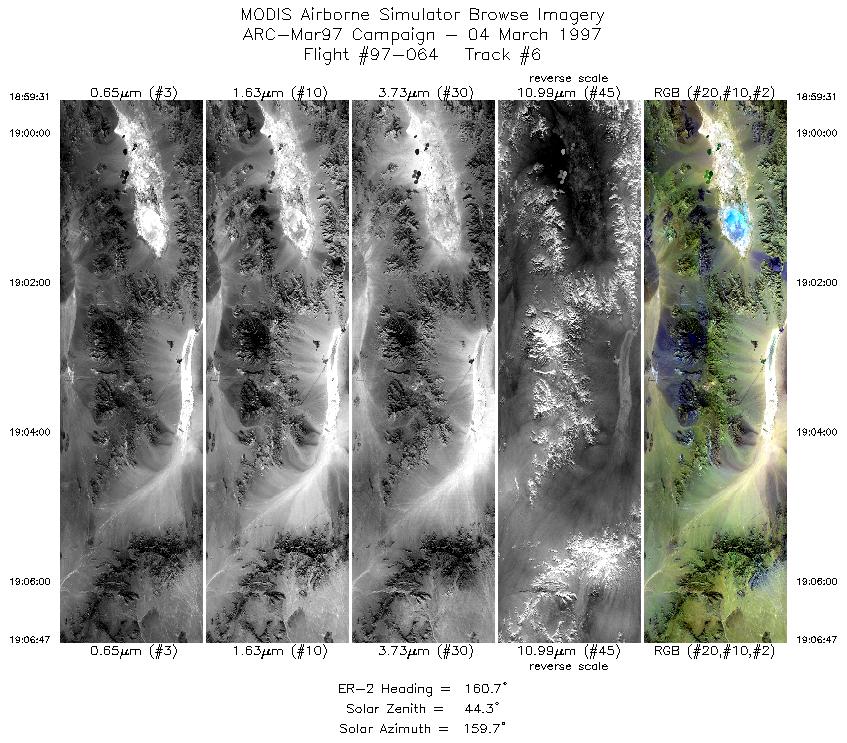
Flightline begins over Mesquite Valley and the nearly dry lakebed of Mesquite Lake. The valley is boarded by the Mesquite Mountians to the left (west) and the Spring Mountains to the right (east). Proceeding southeast, the flight moves over the Clark Mountain Range and into the Ivanpah Valley. The distinctive shape of Ivanpah Lake bed, bisected by Interstate 15, is clearly visible. Flight track ends over the New York Mountains.
R: 2.14 microns
G: 1.63 microns
B: 0.55 microns
|
|
Mission Summary
Date: Mar 04, 1997
ER-2 Flight Number: 97-064
Deployment: ARC-Mar97
Flight Location: Ivanpah; Southern California
Principal Investigator: Dr. Robert Green (JPL)
Additional Sensors: 12" RC-10 (CIR), AVIRIS
Objective: MAS and AVIRIS data used to validate and monitor the on-orbit spectral and radiometric calibration of the HSI sensor onboard the Lewis satellite.
Level-1B Processing Information
Level-1B Data processed by: Ames Research Center
Level-1B Data Version: #09
Level-1B Configuration: (sample file)
Calibration Type: Final
Calibration Version: 1.0
Temperature Adjustment: No
Status: Completed with final calibration, no changes from preliminary calibration.
|
|
Flight Track Map

|
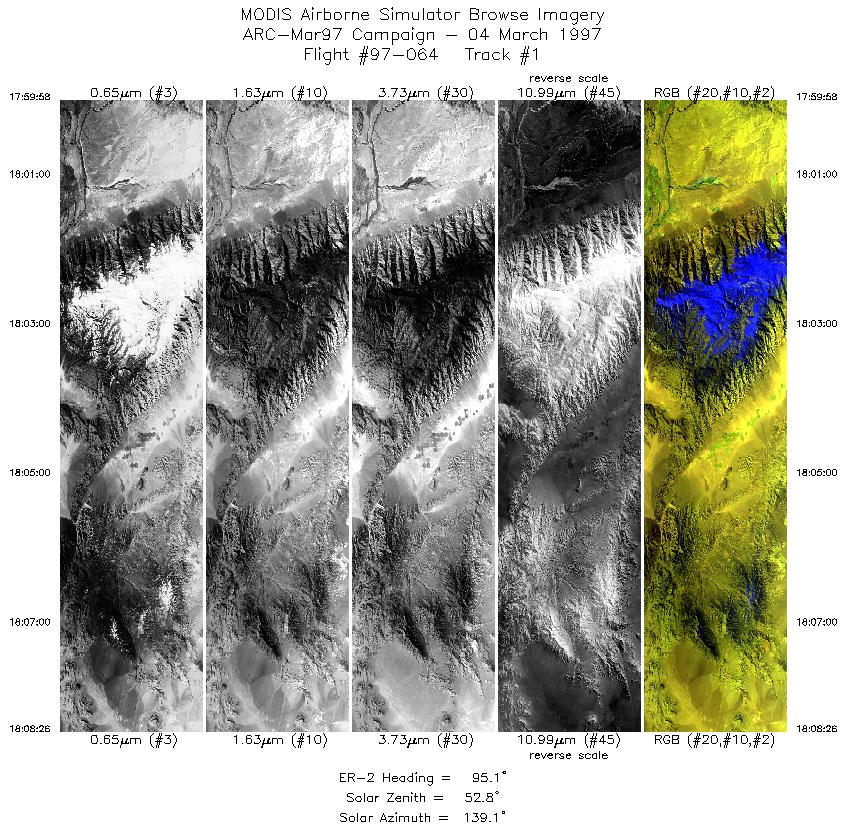
Level-1B Browse Imagery
Straight Line Flight Tracks: 12
Scanlines Processed: 37039
Solar Azimuth and Zenith Angles
|
Browse Images
|
Click on the Flight Track number to load images.
Lat/Lon ranges are for the BEG-END scanline nadir pixels.
|
Flight
Track |
Time_Span
(GMT) |
Heading
(Deg) |
Lat_Range
(Deg_N) |
Lon_Range
(Deg_W) |
Length
(Scanlines) |
Altitude
(Meters) |
| 1 |
17:59-18:08 |
95 |
37.53-37.44 |
118.56-117.36 |
3163 |
~20000 |
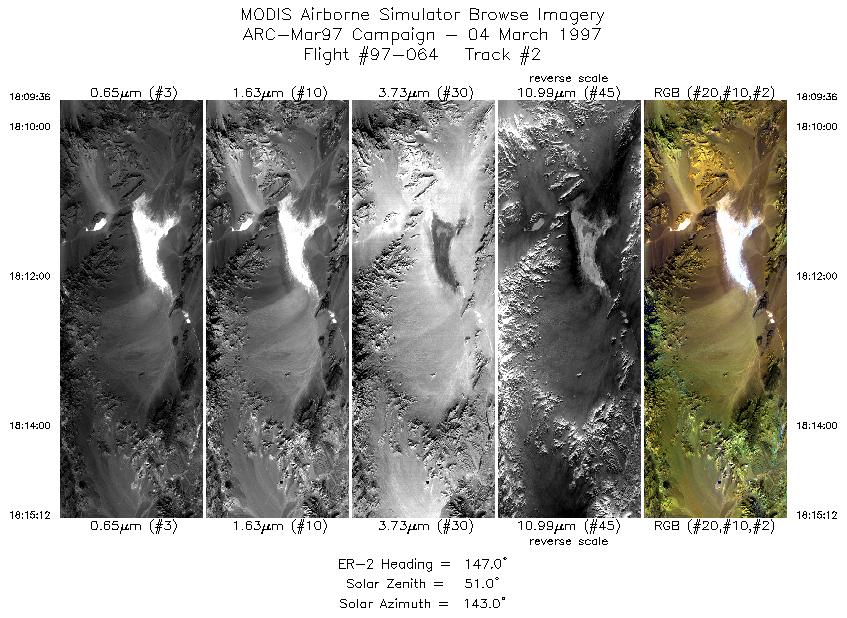
| 2 |
18:09-18:15 |
147 |
37.37-36.83 |
117.22-116.78 |
2094 |
~20000 |
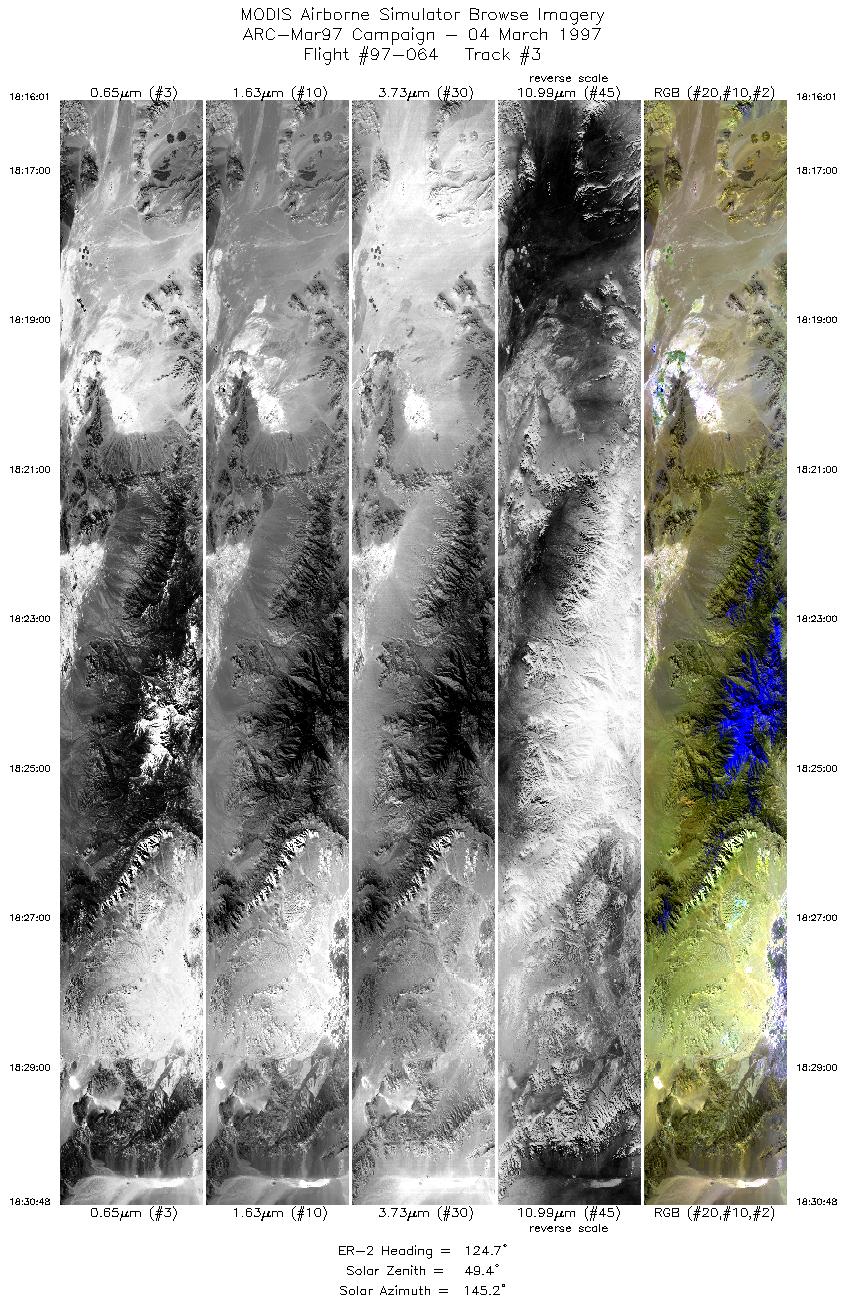
| 3 |
18:16-18:30 |
125 |
36.77-35.79 |
116.68-114.96 |
5526 |
~20000 |
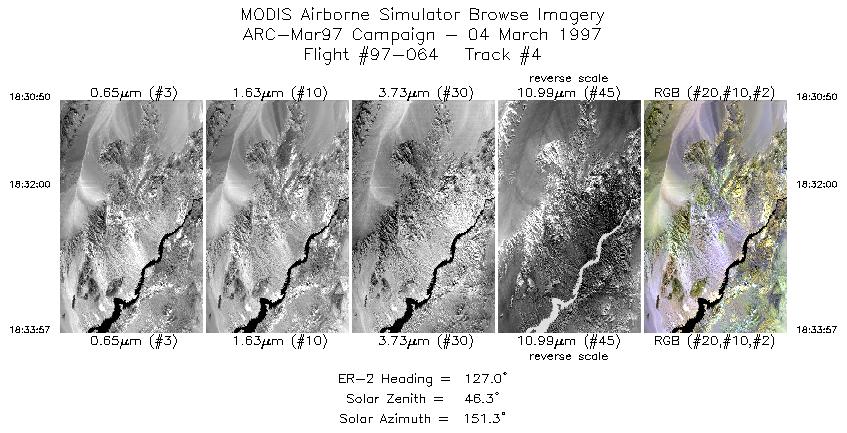
| 4 |
18:30-18:33 |
127 |
35.79-35.58 |
114.96-114.61 |
1166 |
~20000 |
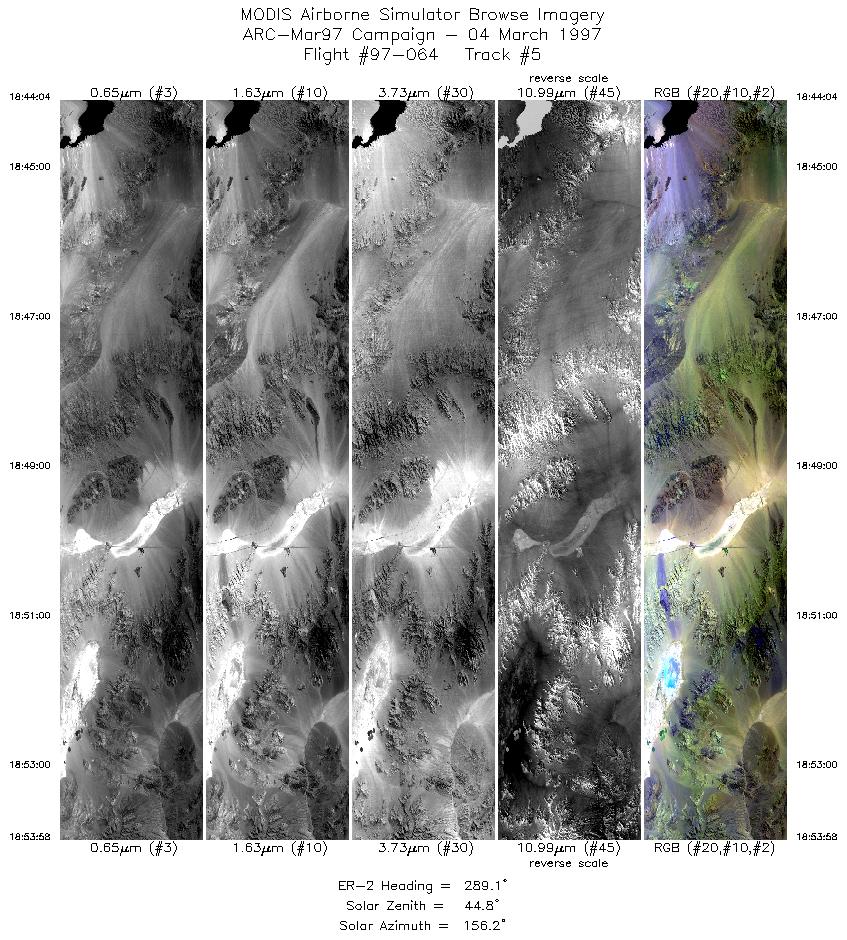
| 5 |
18:44-18:53 |
289 |
35.34-35.70 |
114.66-115.91 |
3701 |
~20000 |
| 6 |
18:59-19:06 |
161 |
35.89-35.12 |
115.71-115.32 |
2717 |
~20000 |
| 7 |
19:13-19:22 |
337 |
34.88-35.76 |
115.25-115.71 |
3252 |
~20000 |
| 8 |
19:24-19:33 |
206 |
35.77-34.87 |
115.97-116.45 |
3271 |
~20000 |
| 9 |
19:33-19:39 |
216 |
34.83-34.32 |
116.47-116.88 |
1988 |
~20000 |
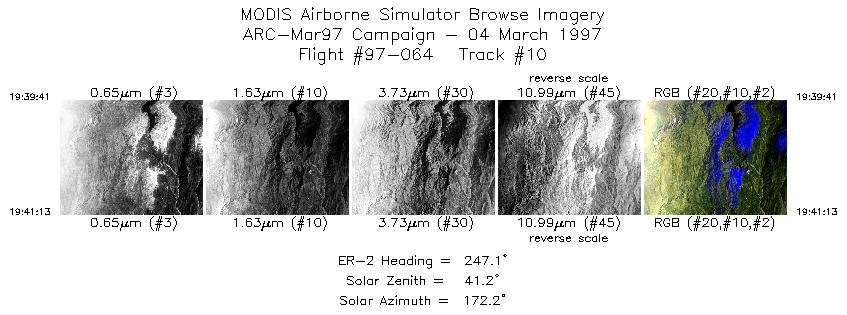
| 10 |
19:39-19:41 |
247 |
34.28-34.21 |
116.93-117.12 |
575 |
~20000 |
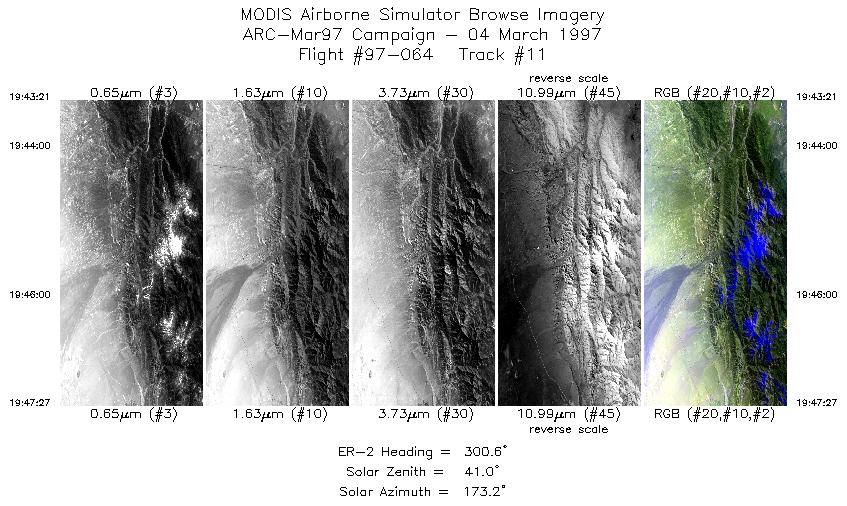
| 11 |
19:43-19:47 |
301 |
34.24-34.47 |
117.38-117.85 |
1533 |
~20000 |
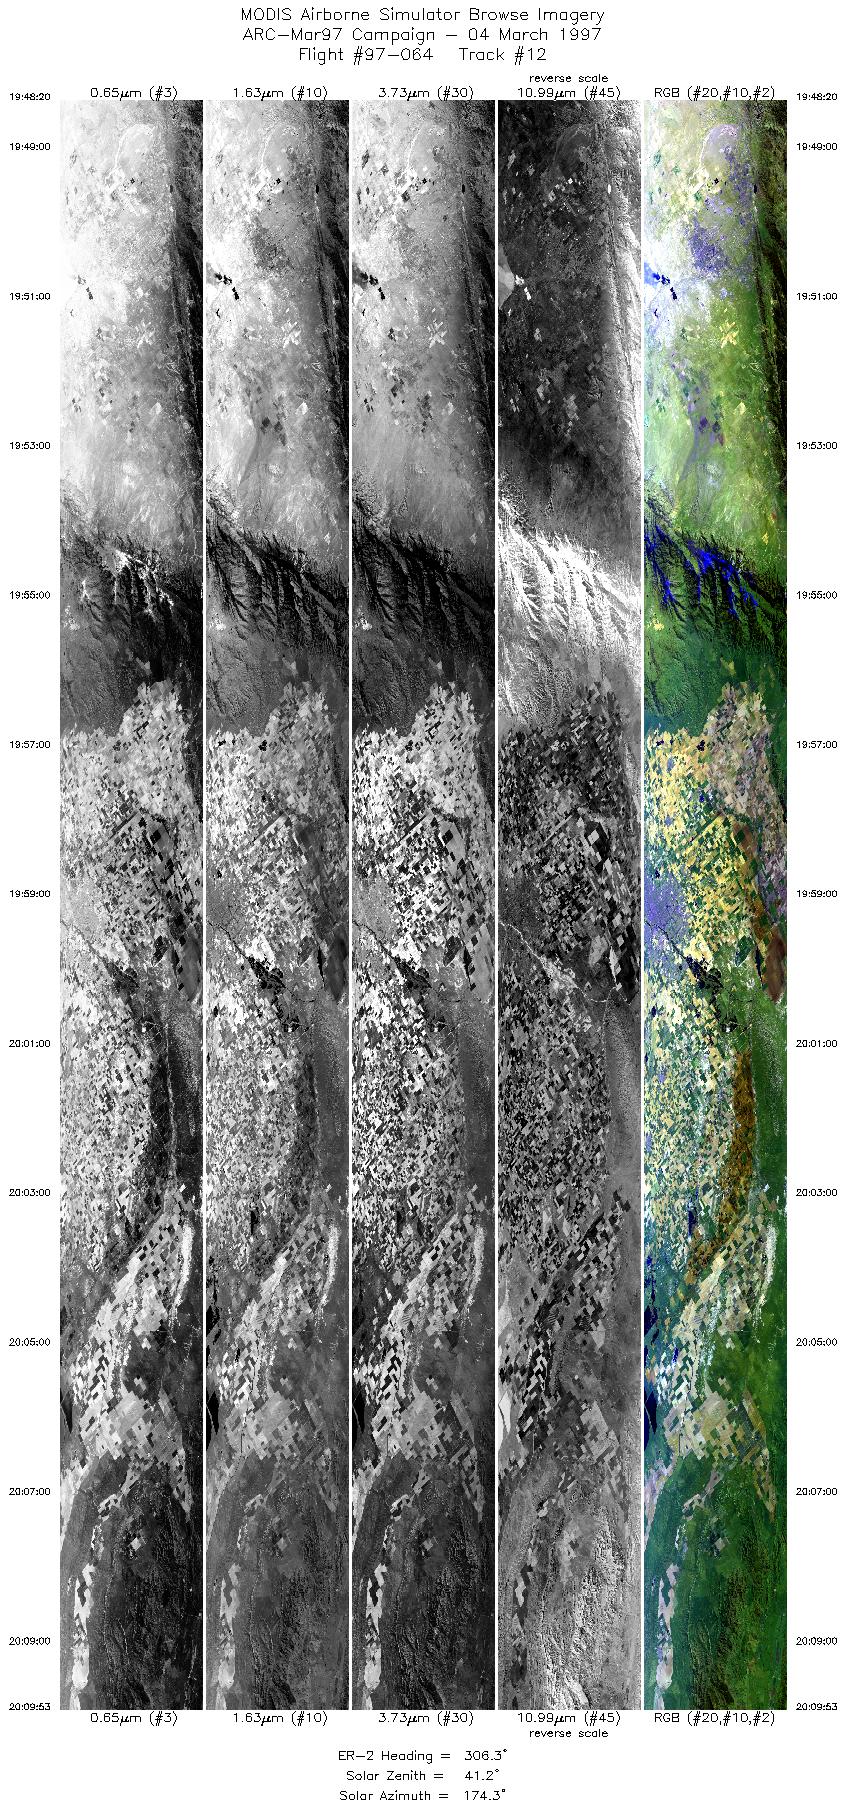
| 12 |
19:48-20:09 |
306 |
34.53-35.94 |
117.93-120.31 |
8053 |
~20000 |
|
Images 01 through 12 in sequence |
Data Evalutation
Data quality is excellent.
Spectral Summary
Spectral Band Configuration (preliminary)
Spectral Response Files (preliminary)
Level-1B Data Distribution
NASA Goddard Space Flight Center DAAC
Related Web Sites
NASA ER-2 1997 Flight Summary Reports
JPL AVIRIS Web Page
Airborne Sensors Facility Page
NASA ER-2 Aircraft Program
|
|