
|
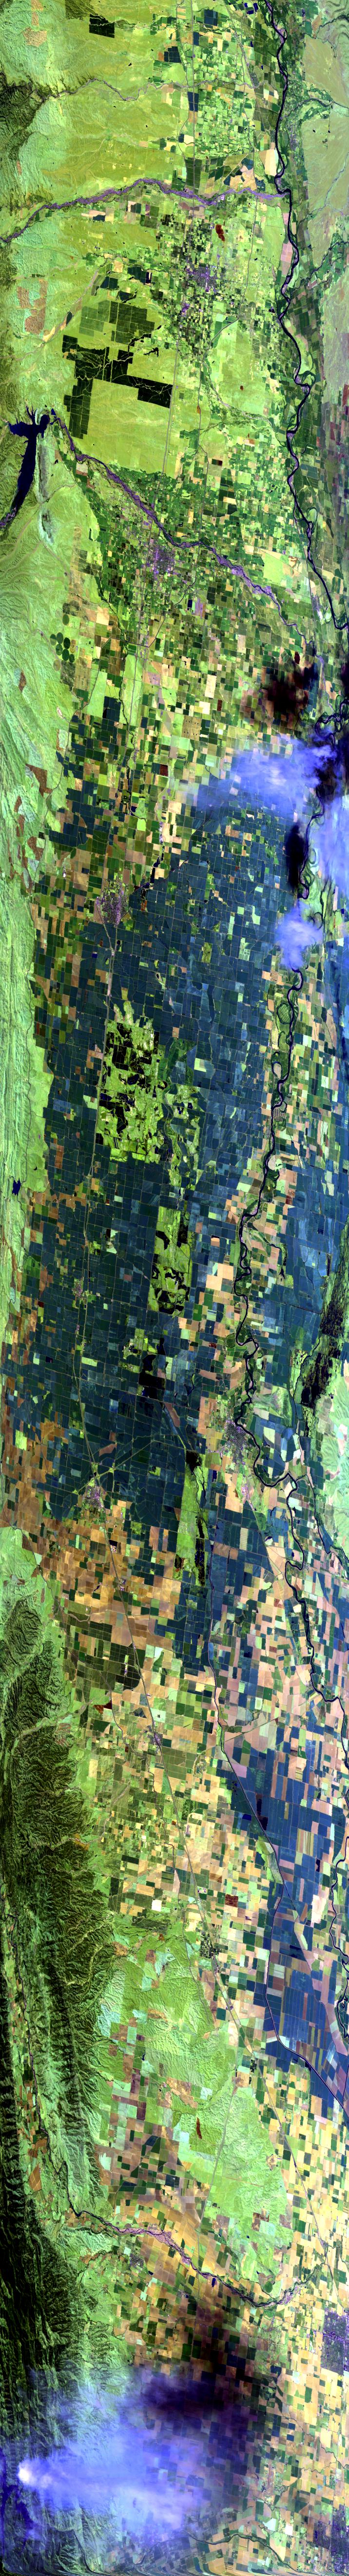
Sample Image

10 September 1996
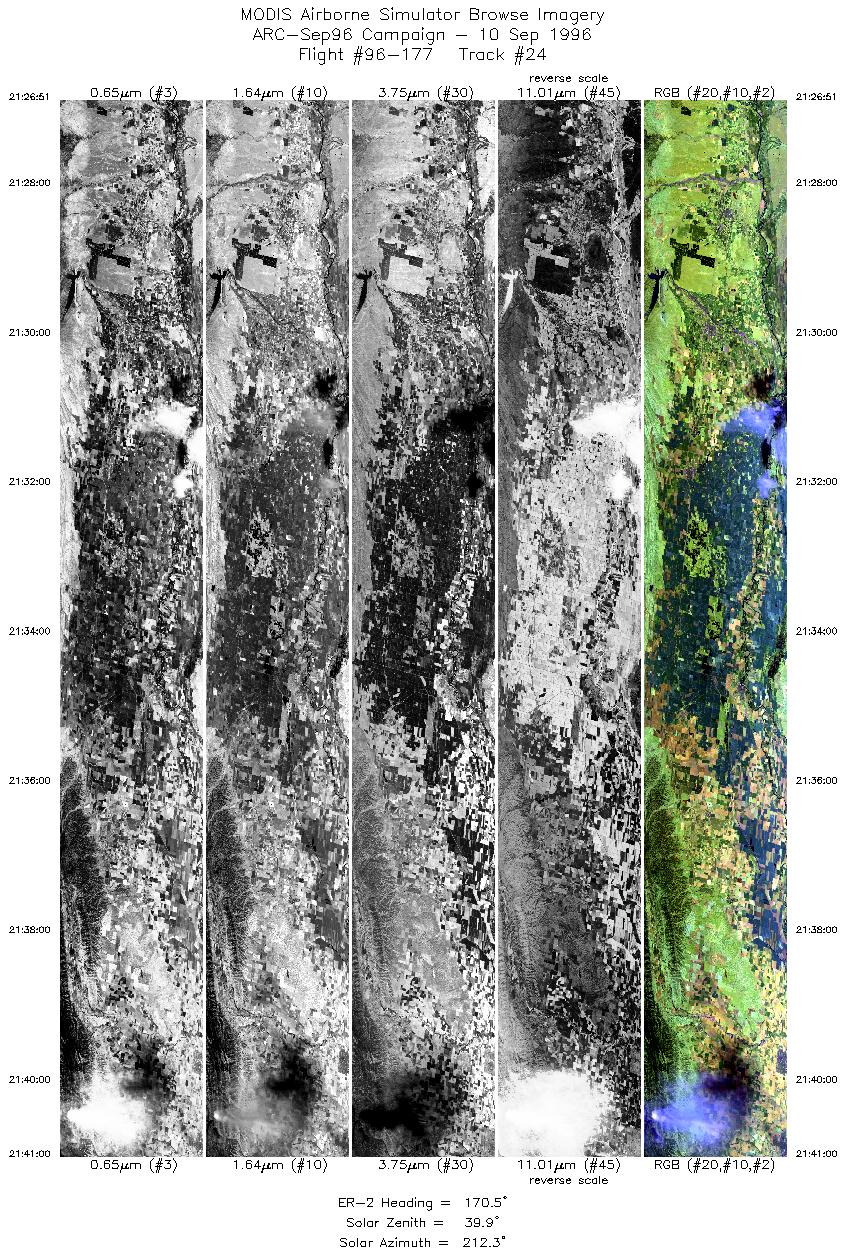
Track #24
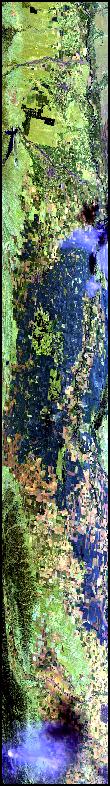
Flightline following the Sacramento River and the Interstate Five Freeway through the Colusa Basin, north of Sacramento, California. South is toward the bottom of the image.
R: 2.15 microns
G: 1.65 microns
B: 0.55 microns
|
|
Mission Summary
Date: Sept 10, 1996
ER-2 Flight Number: 96-177
Deployment: ARC-Sep96
Flight Location: Cascade Mtns of WA, OR, CA; San Francisco Bay Area
Principal Investigator: Dr. James Crowley (USGS)
Additional Sensors: 12" RC-10 (CIR), AVIRIS (failed)
Objective: Data used with ground based observations to study debris flows and other mass-wasting geologic events associated with hydorthermally-altered rocks at selected volcanos. Will improve hazard mitigation planing.
Level-1B Processing Information
Level-1B Data processed by: Ames Research Center
Level-1B Data Version: #09
Level-1B Configuration: (sample file)
Calibration Type: Final
Calibration Version: 1.0
Temperature Adjustment: No
Status: Completed with final calibration
|
|
Flight Track Map

|
Level-1B Browse Imagery
Straight Line Flight Tracks: 27
Scanlines Processed: 63320
Solar Azimuth and Zenith Angles
|
Browse Images
|
Click on the Flight Track number to load images.
Lat/Lon ranges are for the BEG-END scanline nadir pixels.
|
Flight
Track |
Time_Span
(GMT) |
Heading
(Deg) |
Lat_Range
(Deg_N) |
Lon_Range
(Deg_W) |
Length
(Scanlines) |
Altitude
(Meters) |
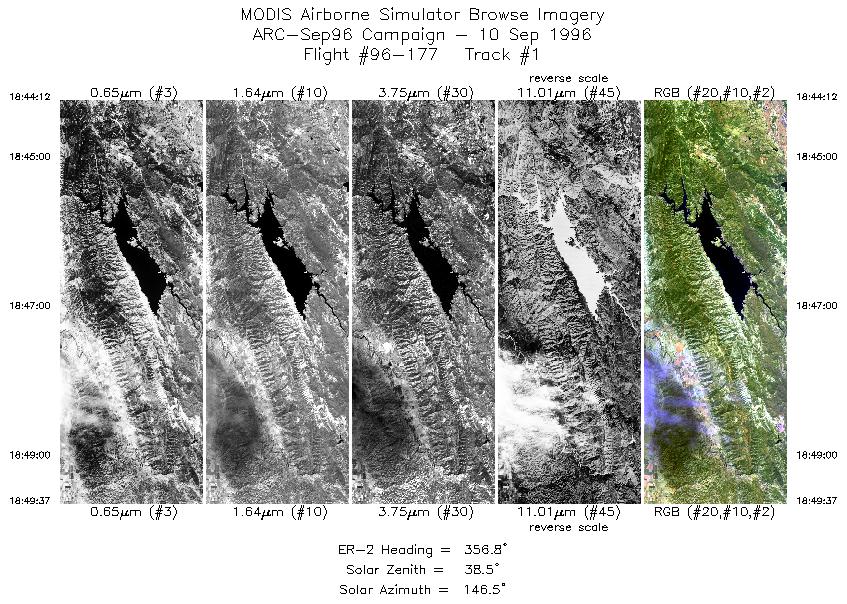
| 1 |
18:44-18:49 |
357 |
38.37-38.95 |
122.23-122.23 |
2023 |
~20000 |
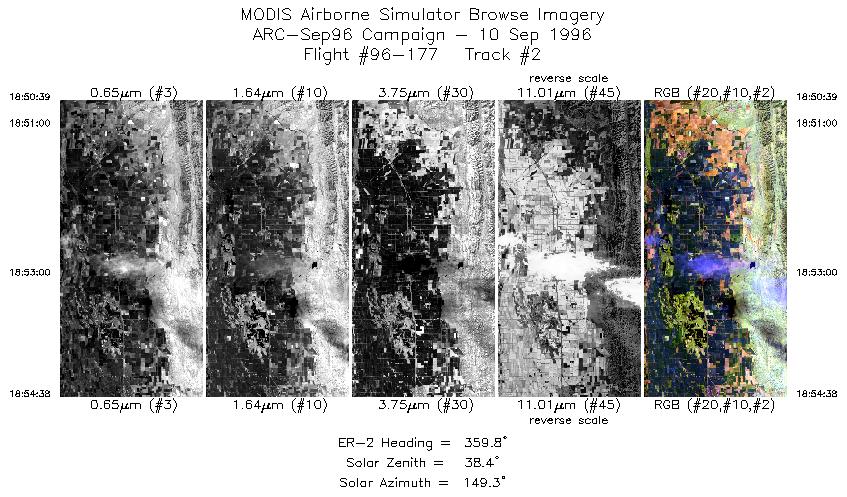
| 2 |
18:50-18:54 |
360 |
39.07-39.53 |
122.23-122.22 |
1487 |
~20000 |
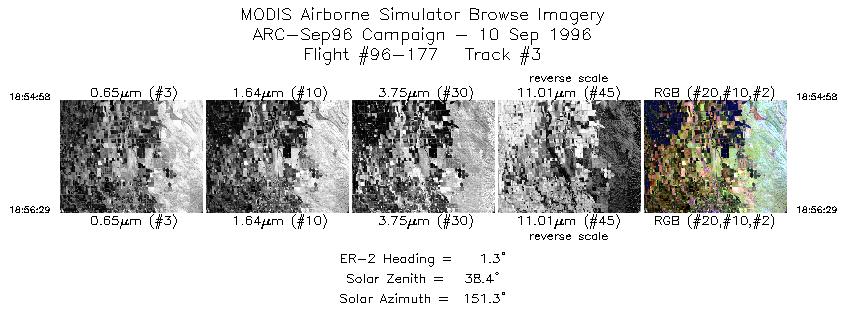
| 3 |
18:54-18:56 |
1 |
39.56-39.74 |
122.21-122.21 |
567 |
~20000 |
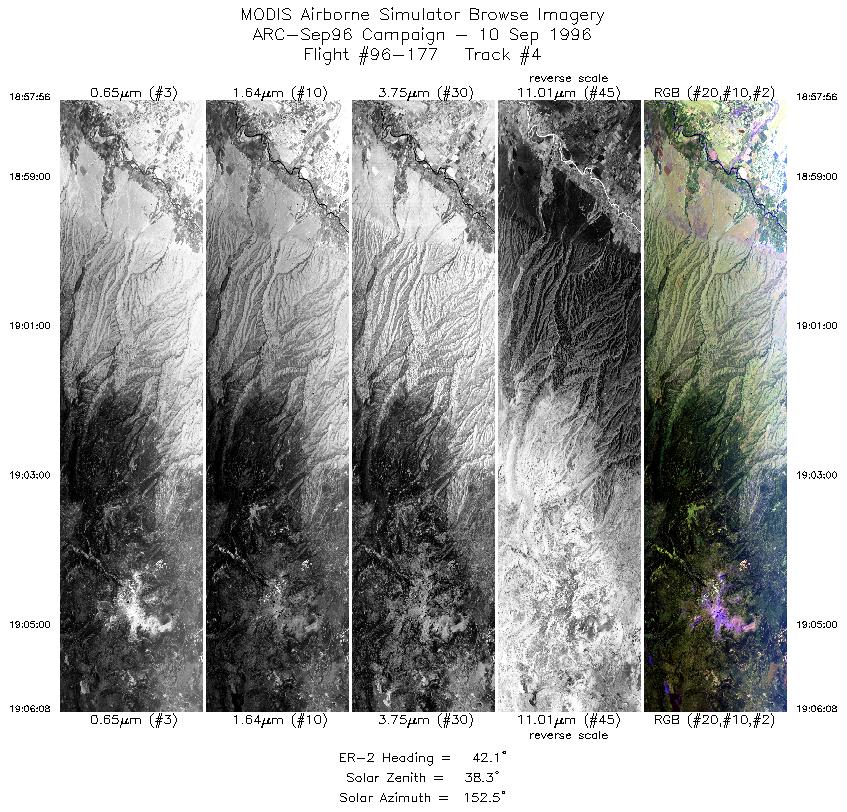
| 4 |
18:57-19:06 |
42 |
39.89-40.60 |
122.18-121.38 |
3063 |
~20000 |
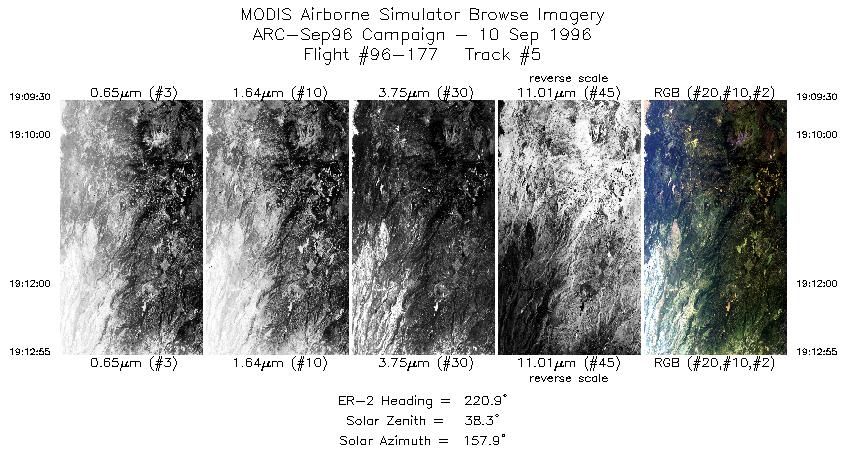
| 5 |
19:09-19:12 |
221 |
40.76-40.47 |
121.60-121.92 |
1276 |
~20000 |
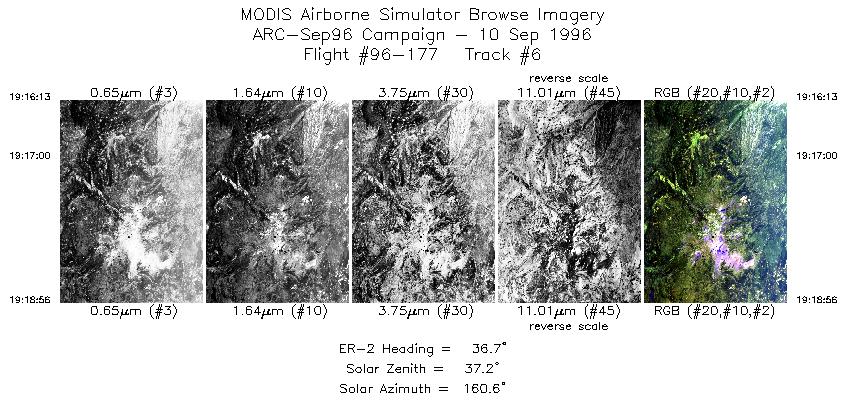
| 6 |
19:16-19:18 |
37 |
40.31-40.55 |
121.70-121.44 |
1016 |
~20000 |
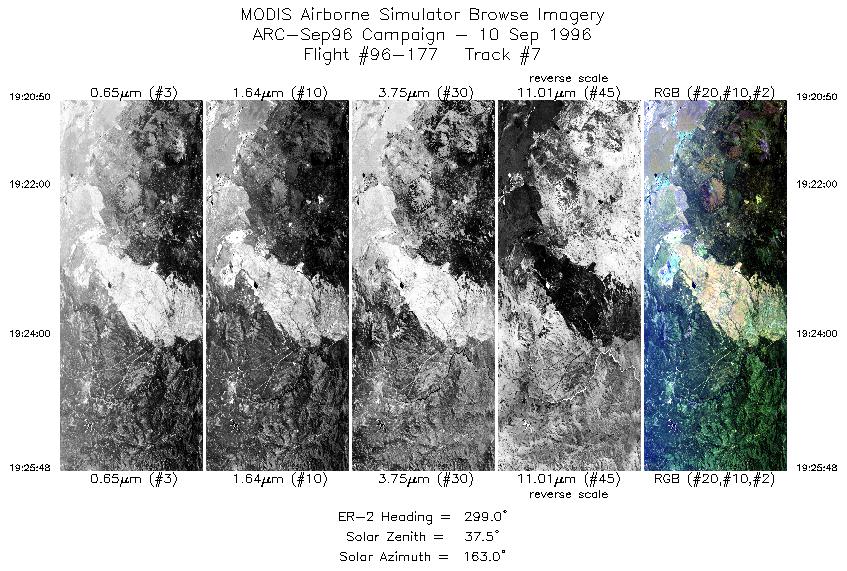
| 7 |
19:20-19:25 |
299 |
40.73-41.01 |
121.48-122.12 |
1855 |
~20000 |
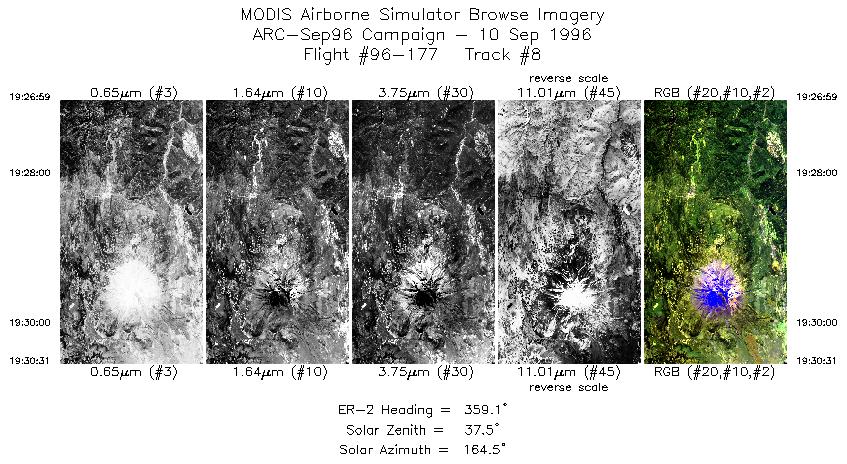
| 8 |
19:26-19:30 |
359 |
41.12-41.51 |
122.20-122.20 |
1321 |
~20000 |
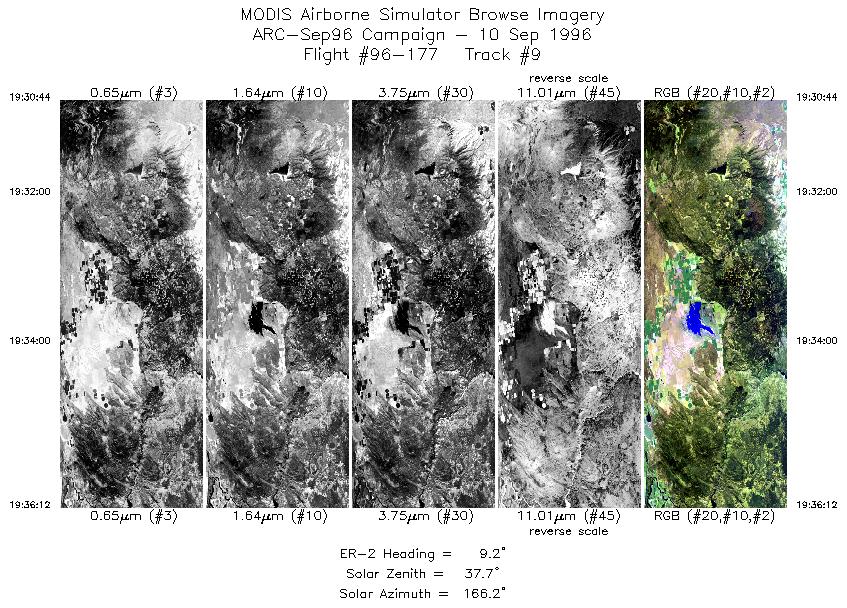
| 9 |
19:30-19:49 |
9 |
41.54-43.64 |
122.20-121.67 |
7043 |
~20000 |
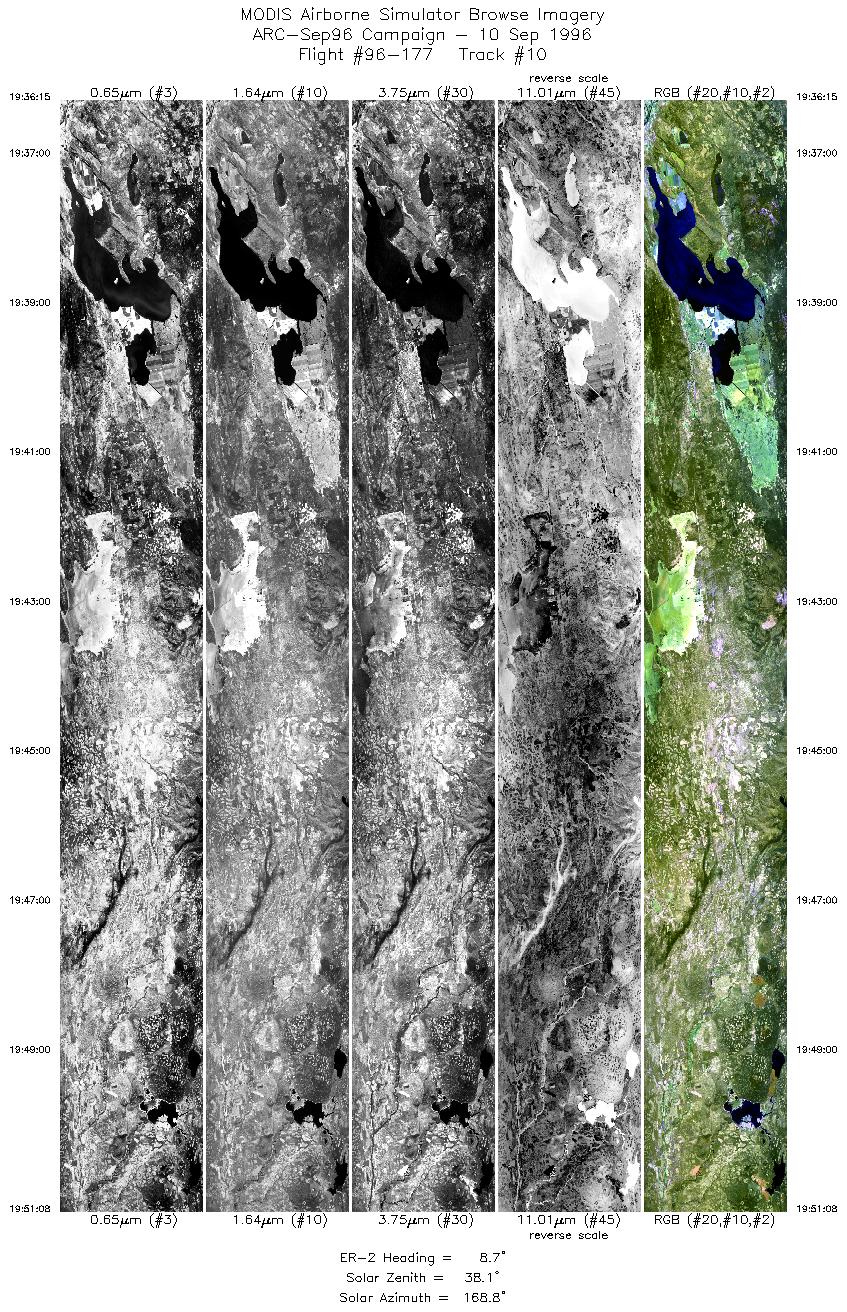
| 10 |
19:49-19:51 |
10 |
43.65-43.82 |
121.66-121.62 |
561 |
~20000 |
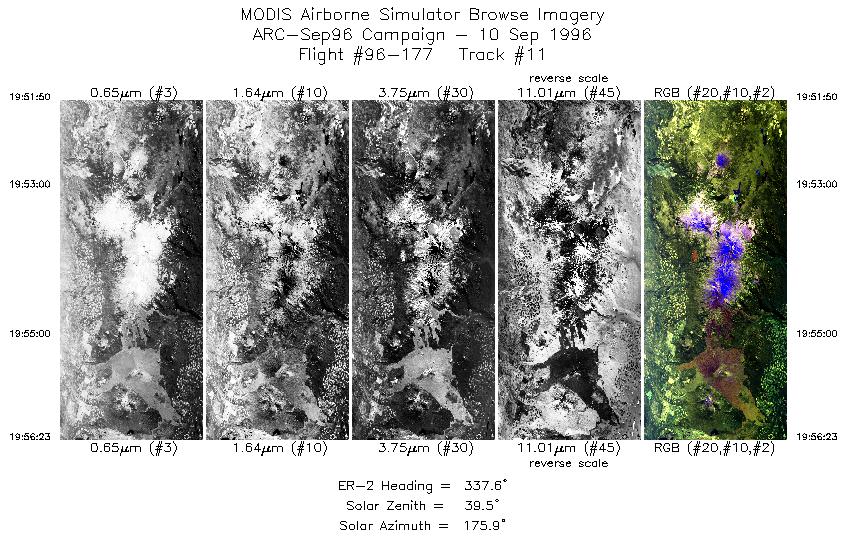
| 11 |
19:51-19:56 |
338 |
43.89-44.38 |
121.63-121.89 |
1700 |
~20000 |
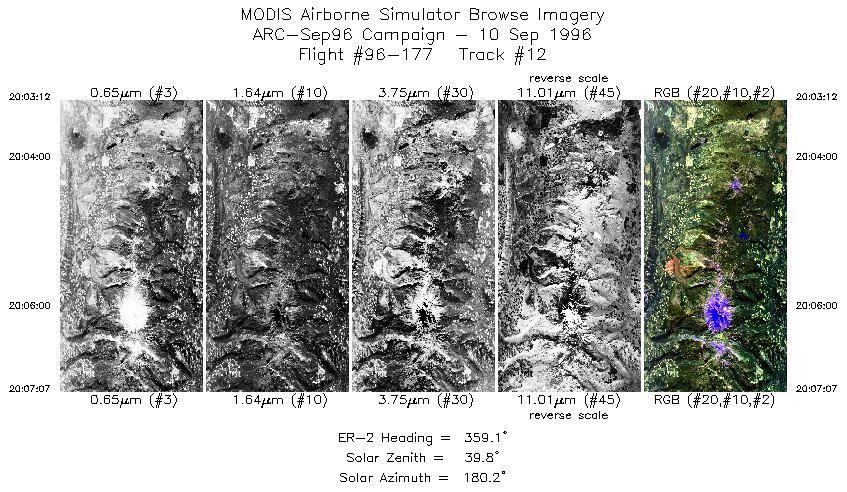
| 12 |
20:03-20:07 |
359 |
44.35-44.80 |
121.80-121.80 |
1464 |
~20000 |
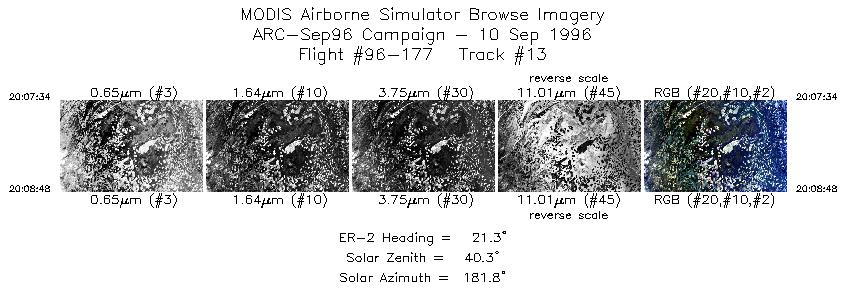
| 13 |
20:07-20:08 |
21 |
44.85-44.98 |
121.79-121.71 |
461 |
~20000 |
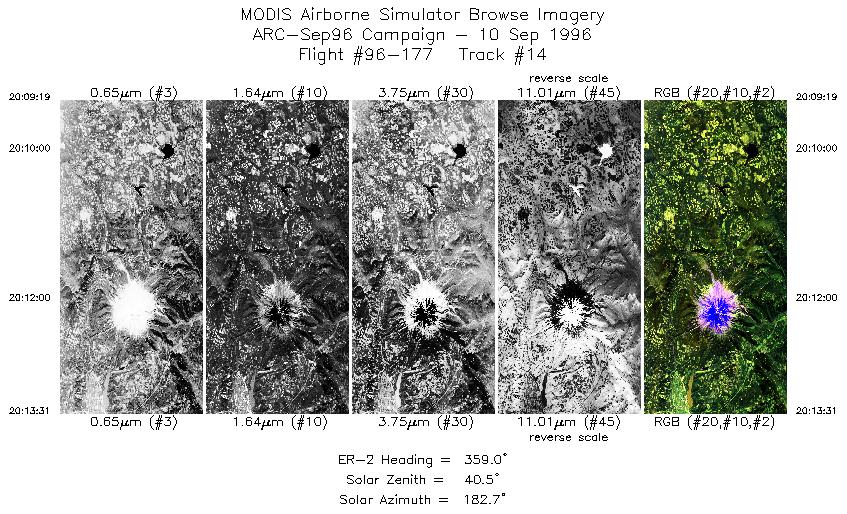
| 14 |
20:09-20:13 |
359 |
45.04-45.53 |
121.70-121.70 |
1570 |
~20000 |
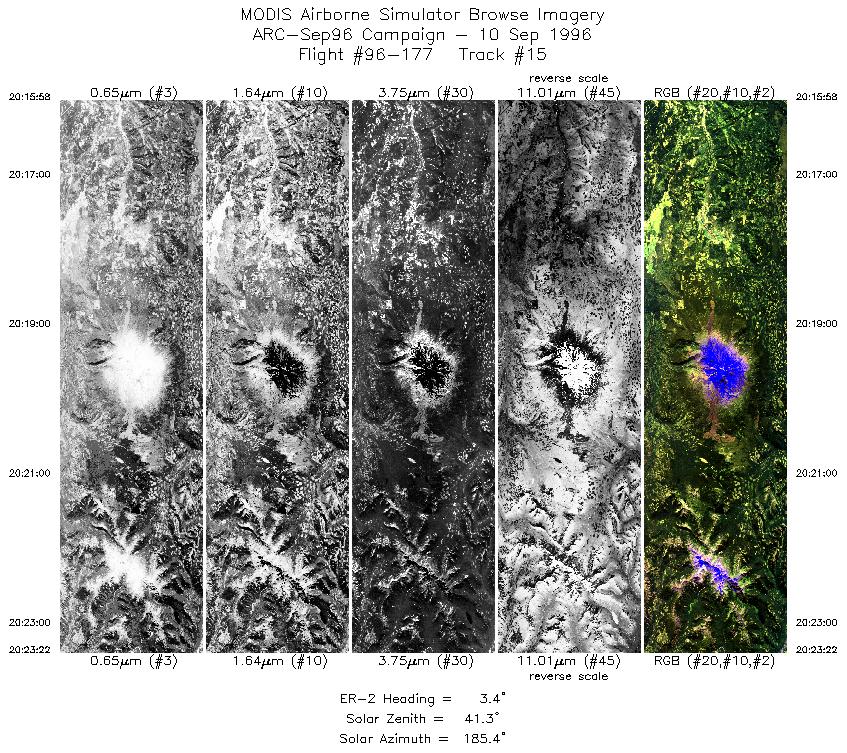
| 15 |
20:15-20:23 |
3 |
45.79-46.63 |
121.54-121.43 |
2765 |
~20000 |
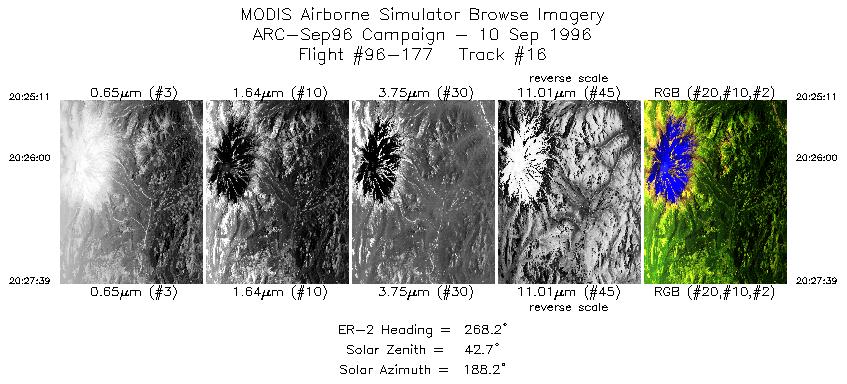
| 16 |
20:25-20:27 |
268 |
46.76-46.76 |
121.61-122.02 |
923 |
~20000 |
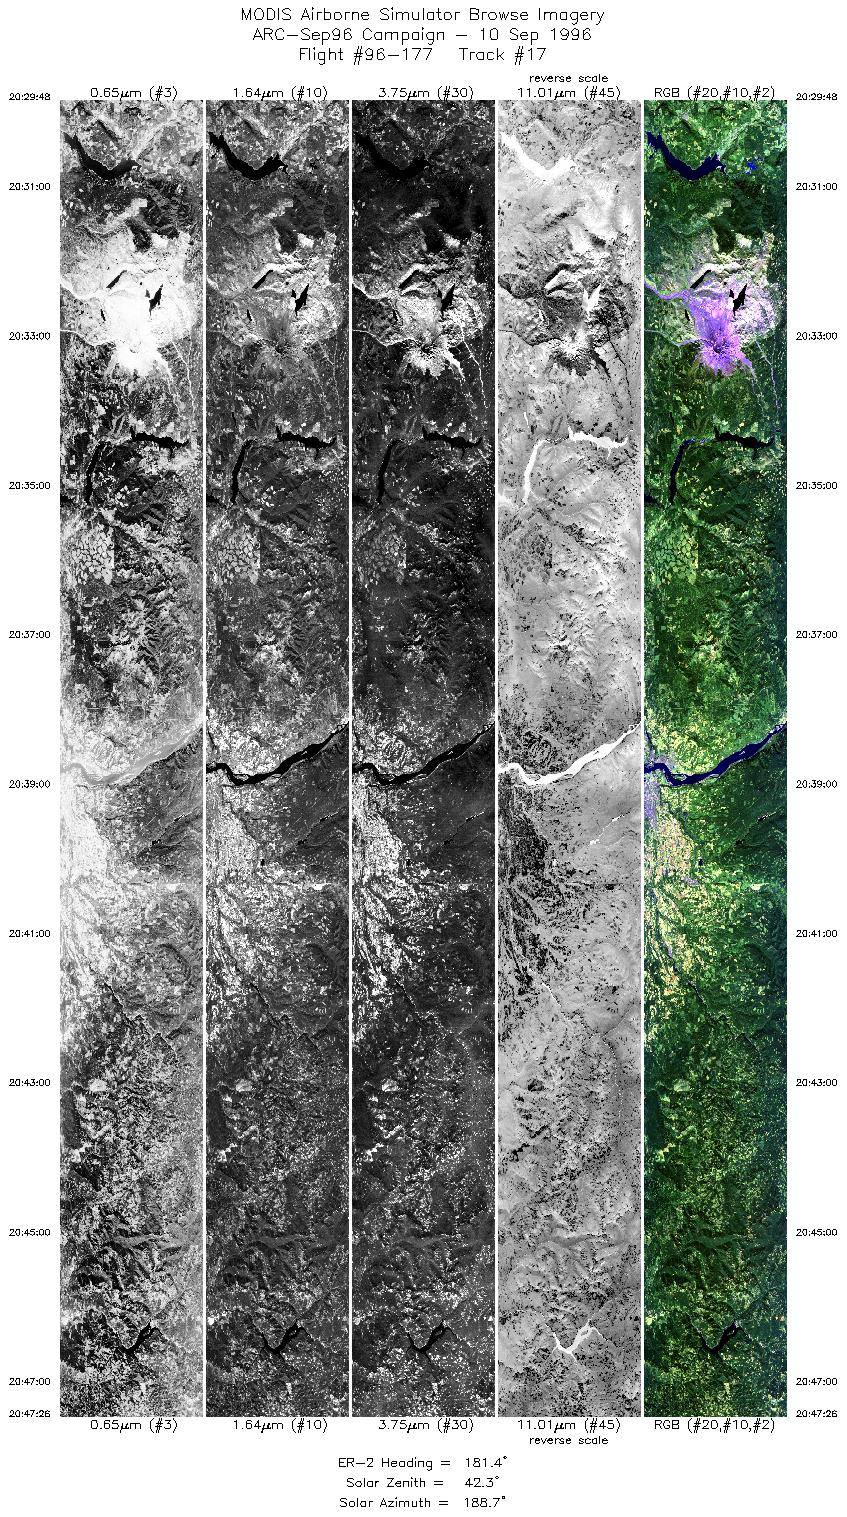
| 17 |
20:29-20:47 |
181 |
46.61-44.59 |
122.19-122.20 |
6717 |
~20000 |
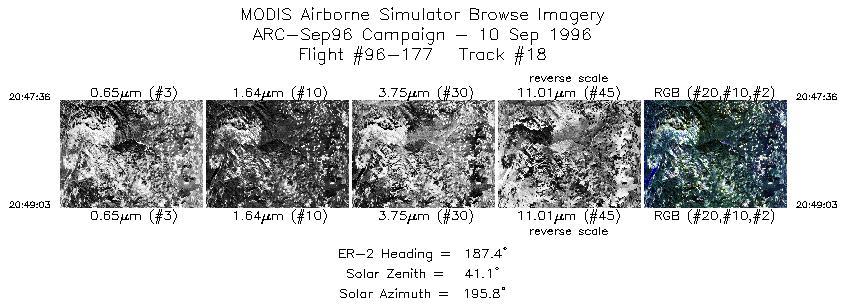
| 18 |
20:47-20:49 |
187 |
44.58-44.42 |
122.20-122.23 |
542 |
~20000 |
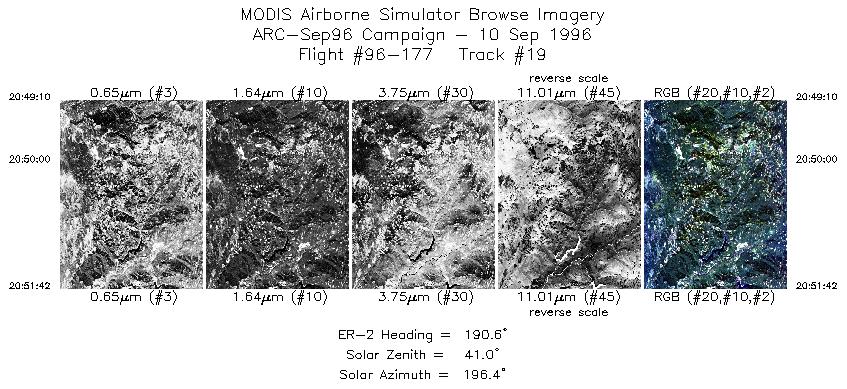
| 19 |
20:49-20:51 |
191 |
44.40-44.12 |
122.23-122.30 |
947 |
~20000 |
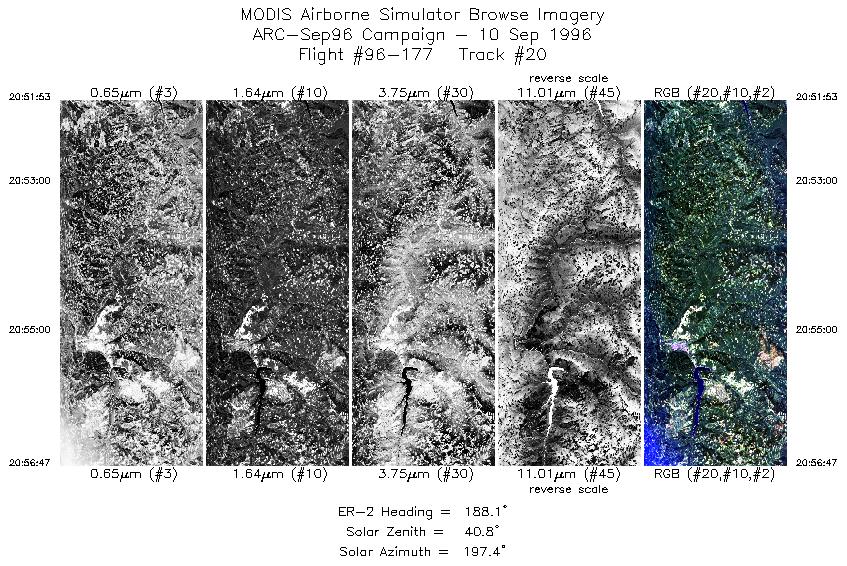
| 20 |
20:51-20:56 |
188 |
44.10-43.59 |
122.30-122.39 |
1730 |
~20000 |
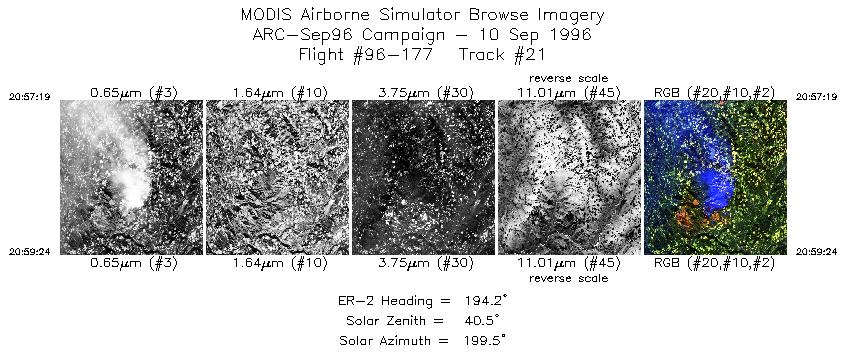
| 21 |
20:57-20:59 |
194 |
43.49-43.26 |
122.41-122.48 |
778 |
~20000 |
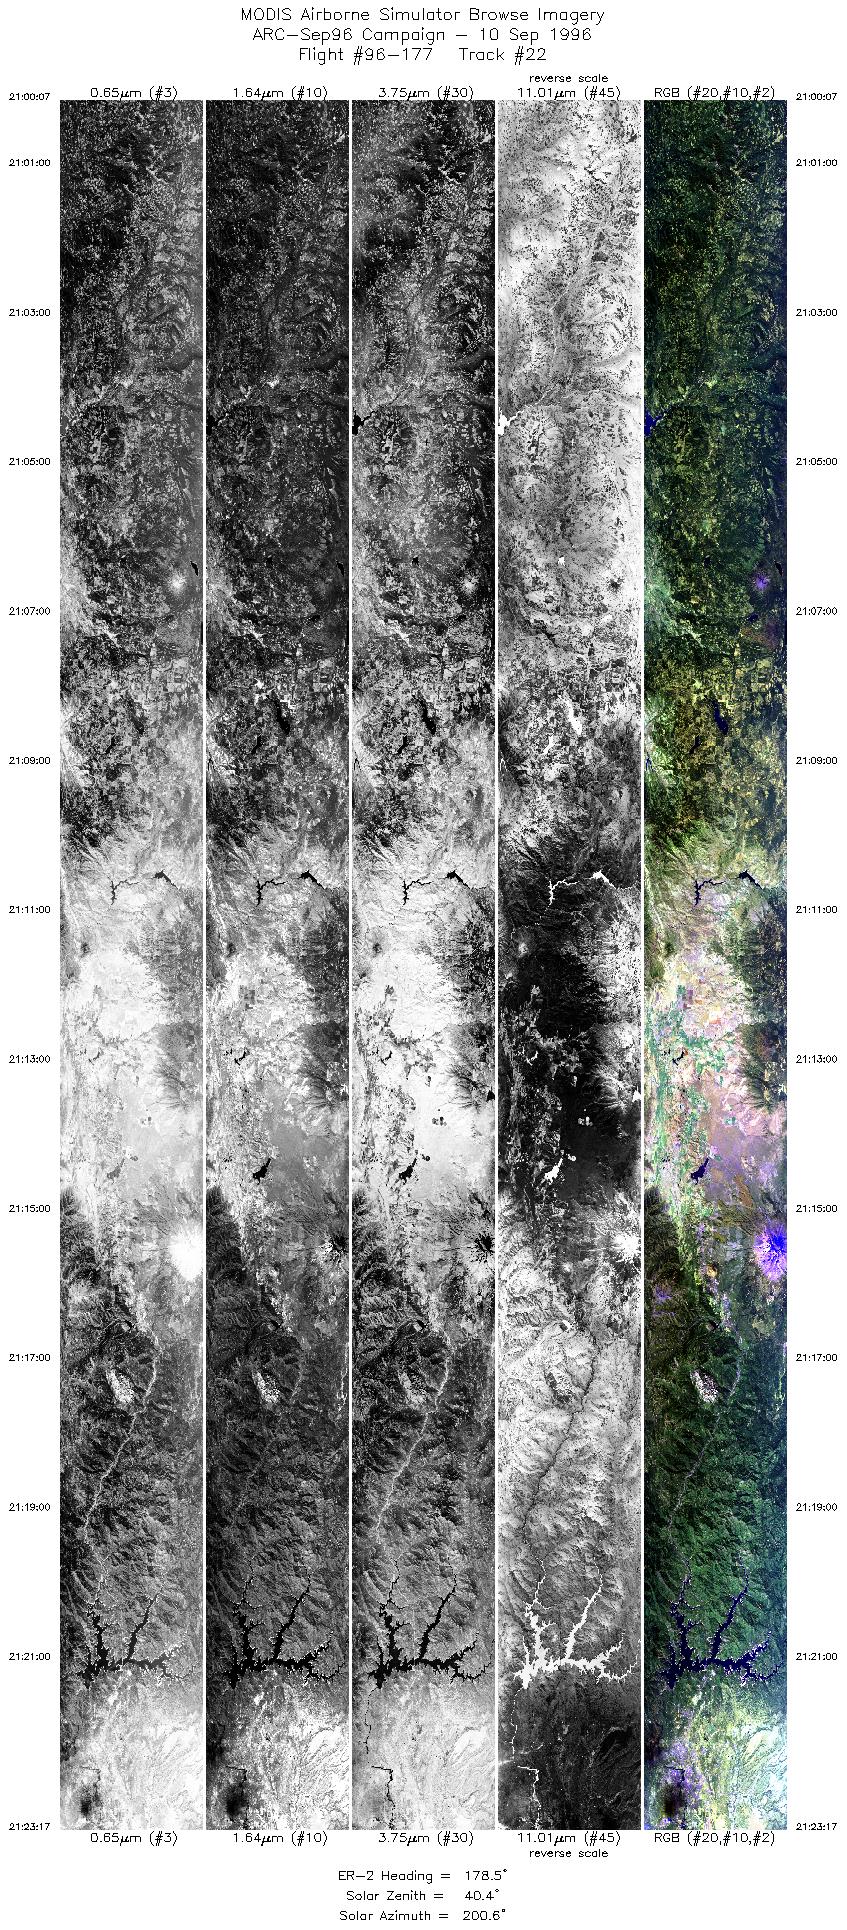
| 22 |
21:00-21:26 |
179 |
43.19-40.13 |
122.48-122.24 |
9867 |
~20000 |
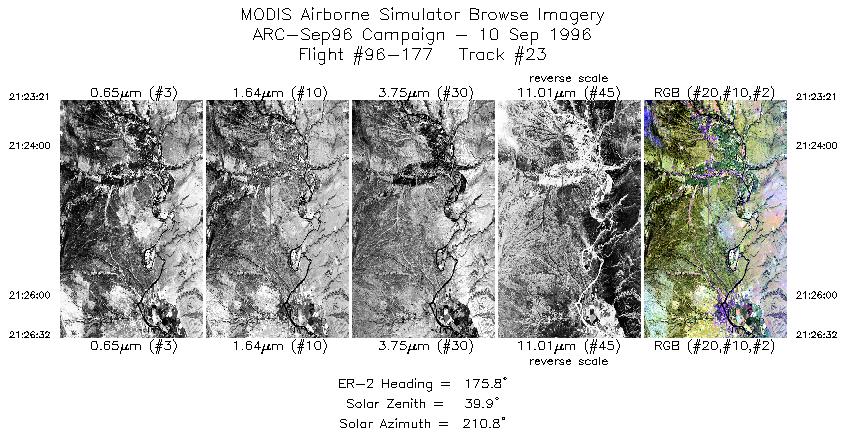
| 23 |
21:26-21:41 |
170 |
40.10-38.51 |
122.24-121.94 |
5286 |
~20000 |
| 24 |
21:42-21:46 |
224 |
38.36-38.02 |
122.04-122.48 |
1557 |
~20000 |
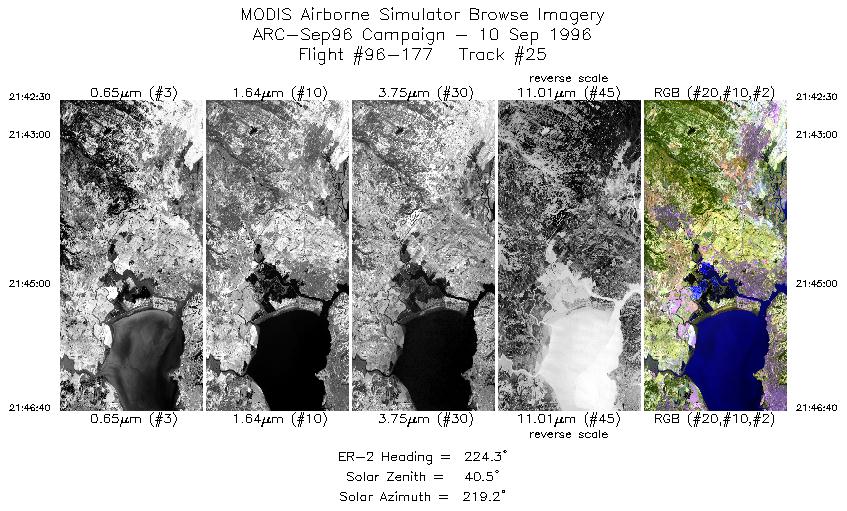
| 25 |
21:48-21:52 |
144 |
37.88-37.51 |
122.50-122.18 |
1539 |
~20000 |
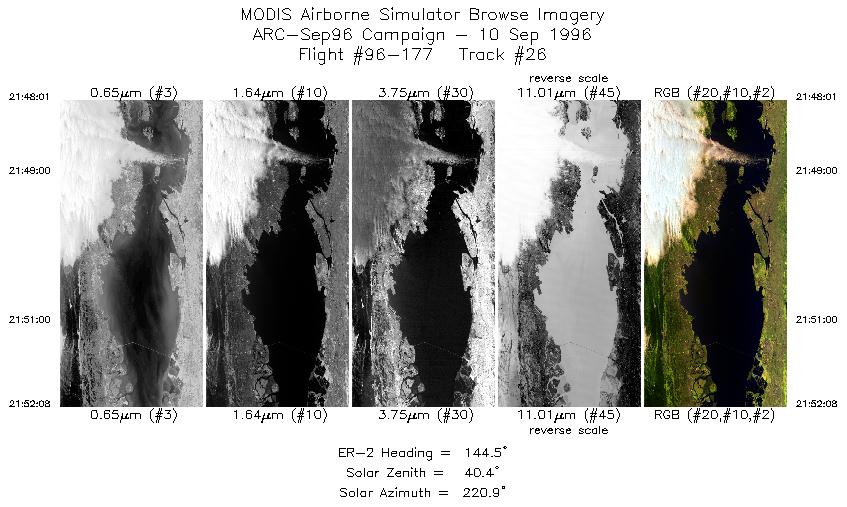
| 26 |
21:52-21:59 |
150 |
37.50-36.80 |
122.17-121.67 |
2759 |
~20000 |
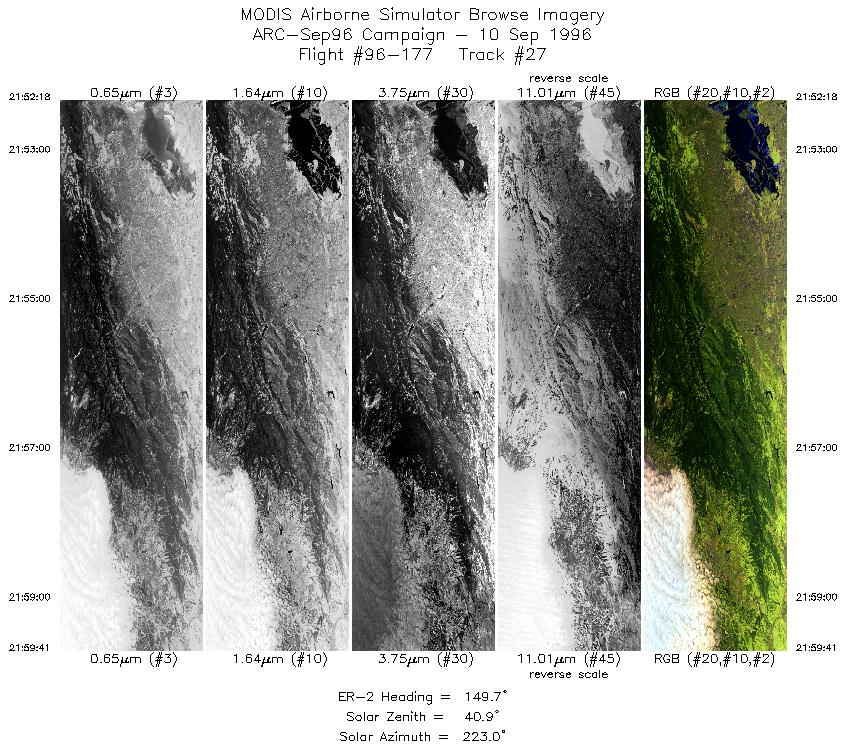
| 27 |
22:04-22:11 |
110 |
36.34-36.09 |
121.58-120.72 |
2503 |
~20000 |
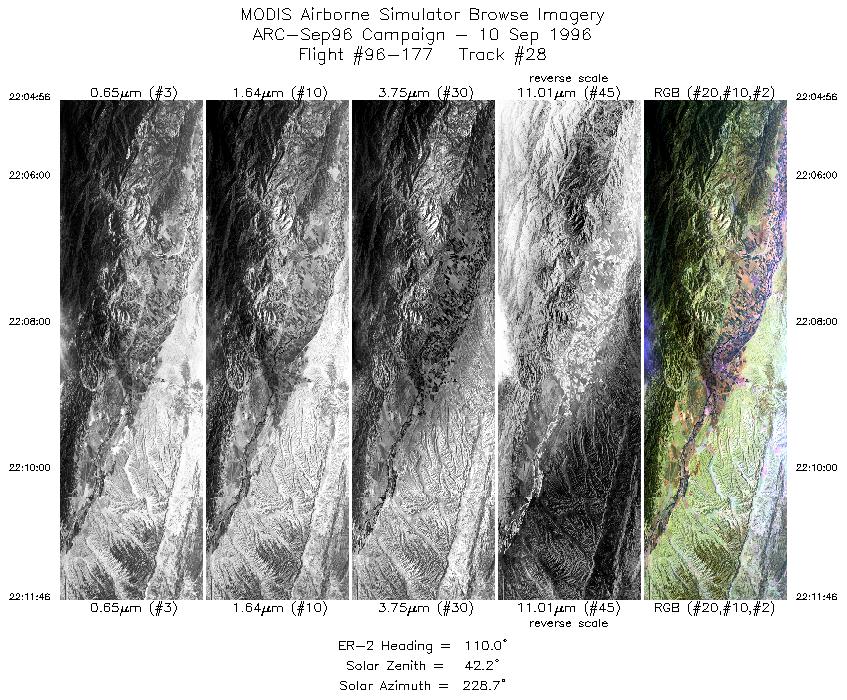
| 28 |
22:04-22:11 |
110 |
36.34-36.09 |
121.58-120.72 |
2503 |
~20000 |
|
Images 01 through 28 in sequence |
Data Evalutation
Some bad scanlines in channel 44. Most tracks smeared at start of flightline.
Otherwise data quality is excellent.
Spectral Summary
Spectral Band Configuration
Spectral Response Files
Level-1B Data Distribution
NASA Goddard Space Flight Center DAAC
Related Web Sites
JPL AVIRIS Web Page
Airborne Sensors Facility Page
NASA ER-2 Aircraft Program
|
|