
|
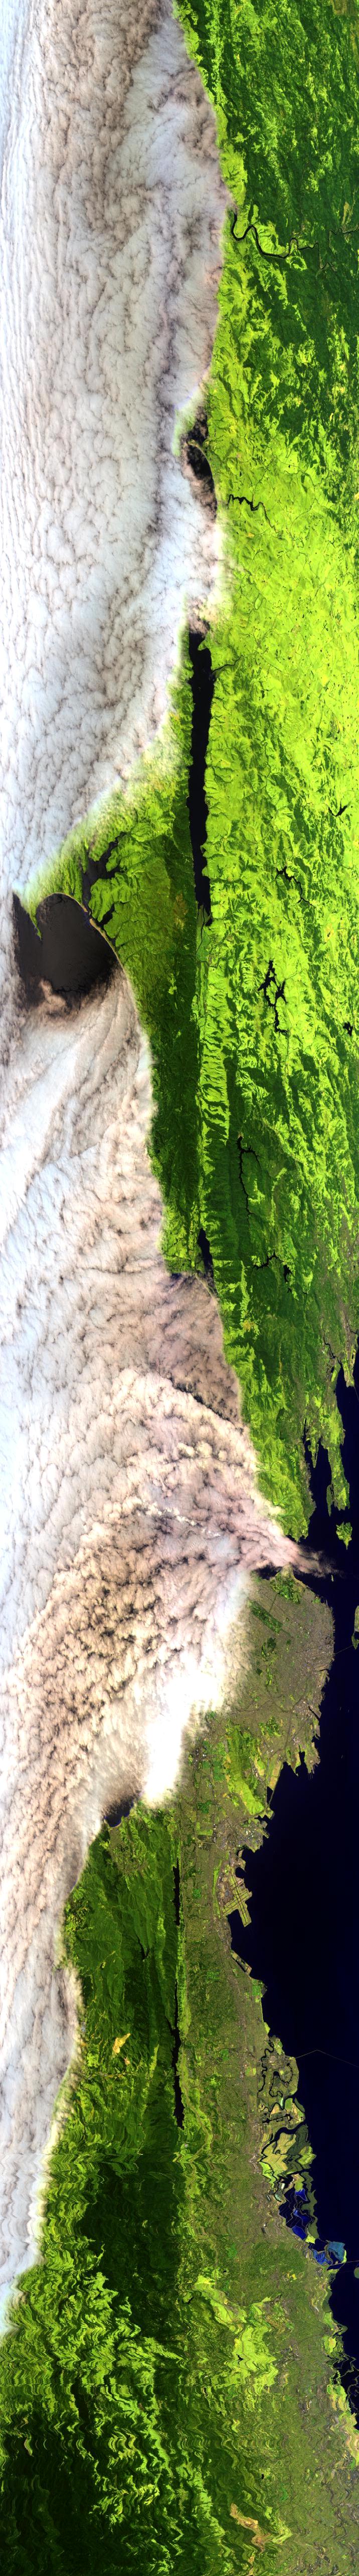
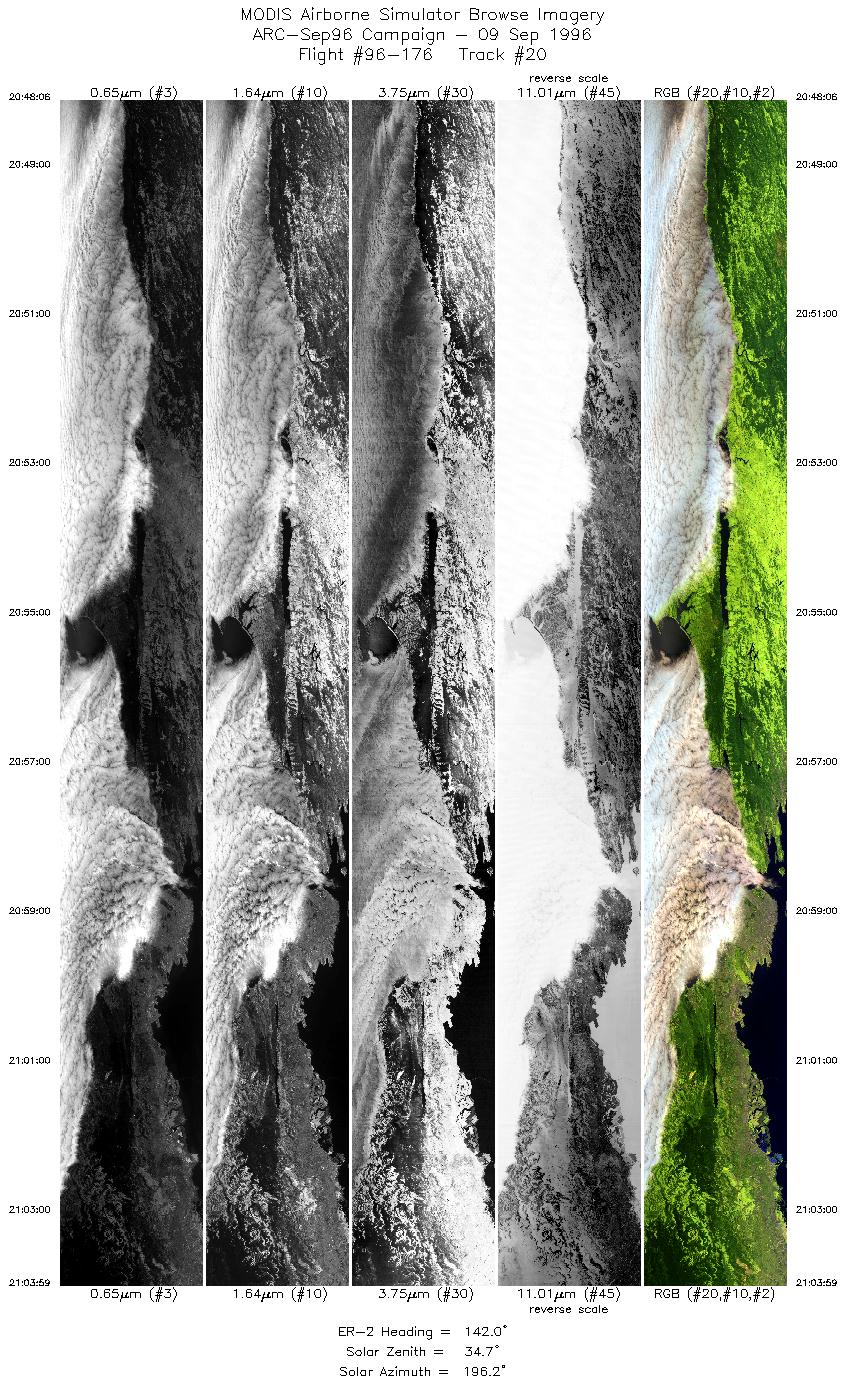
Sample Image

09 September 1996
Track #20
scanlines 800-5932 of 5932
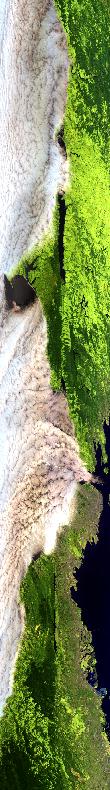
Cloud bank off the Northern California coast, near Point Reyes and the San Francisco Bay peninsulas. North is to the top of the image.
R: 2.15 microns
G: 1.65 microns
B: 0.47 microns
|
|
Mission Summary
Date: Sept 09, 1996
ER-2 Flight Number: 96-176
Deployment: ARC-Sep96
Flight Location: Sutter Buttes and Mammoth Mtn, California
Principal Investigators: Dr. Daivd Pieri (JPL), Dr. Paul Ishikawa (USFS)
Additional Sensors: 12" RC-10 (CIR), AVIRIS (failed)
Objective: Continued AVIRIS monitoring of tree kills related to active volcanism.
Level-1B Processing Information
Level-1B Data processed by: Ames Research Center
Level-1B Data Version: #09
Level-1B Configuration: (sample file)
Calibration Type: Final
Calibration Version: 1.0
Temperature Adjustment: No
Status: Completed with final calibration
|
|
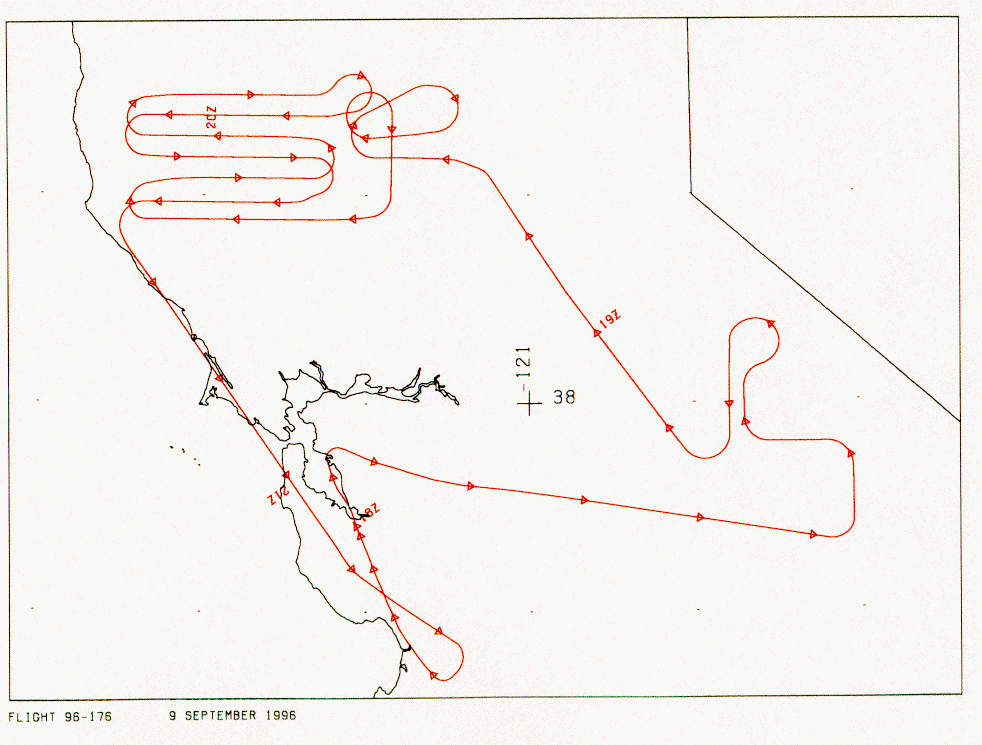
Flight Track Map
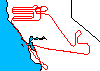

|
Level-1B Browse Imagery
Straight Line Flight Tracks: 20
Scanlines Processed: 37988
Solar Azimuth and Zenith Angles
|
Browse Images
|
Click on the Flight Track number to load images.
Lat/Lon ranges are for the BEG-END scanline nadir pixels.
|
Flight
Track |
Time_Span
(GMT) |
Heading
(Deg) |
Lat_Range
(Deg_N) |
Lon_Range
(Deg_W) |
Length
(Scanlines) |
Altitude
(Meters) |
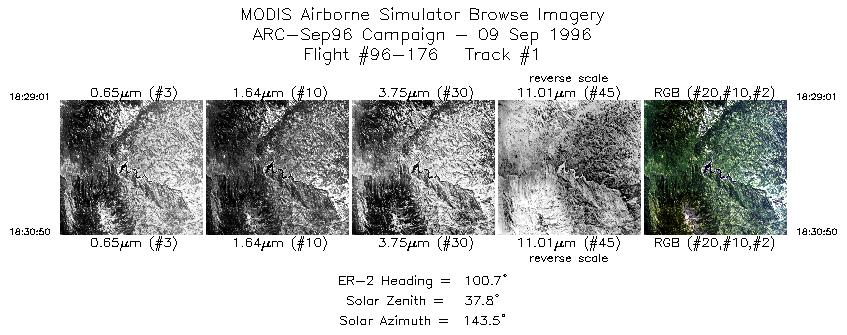
| 1 |
18:29-18:30 |
101 |
37.37-37.33 |
119.45-119.20 |
676 |
~20000 |
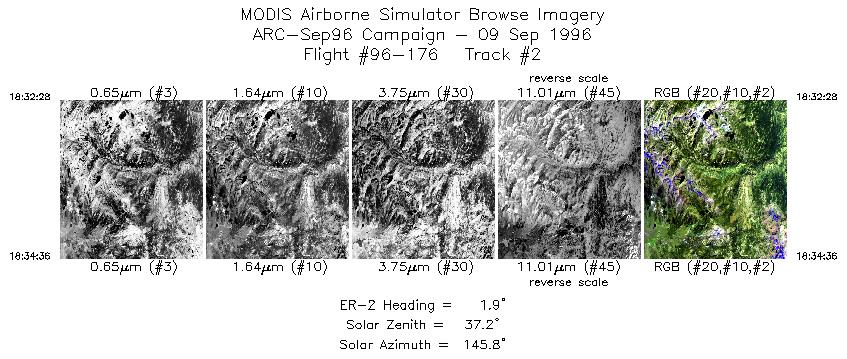
| 2 |
18:32-18:34 |
2 |
37.43-37.67 |
119.04-119.03 |
798 |
~20000 |
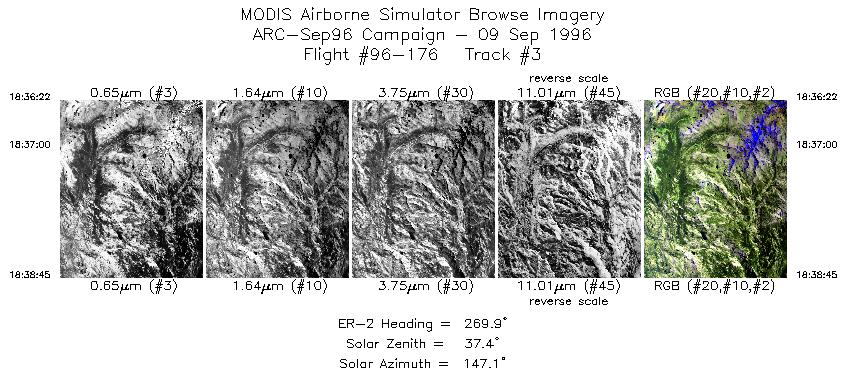
| 3 |
18:36-18:38 |
270 |
37.80-37.81 |
119.19-119.54 |
890 |
~20000 |
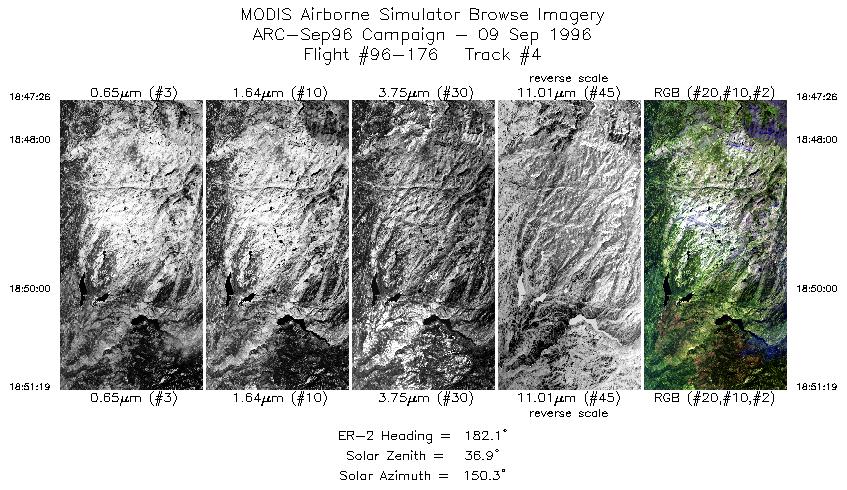
| 4 |
18:47-18:51 |
182 |
38.29-37.85 |
119.78-119.78 |
1451 |
~20000 |
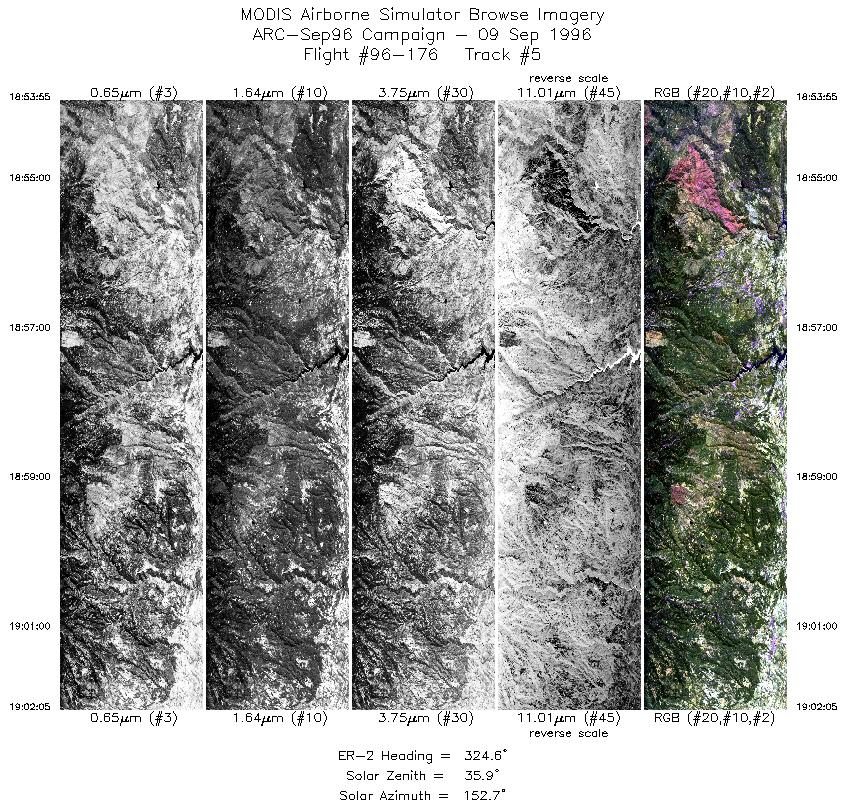
| 5 |
18:53-19:02 |
325 |
37.77-38.52 |
120.05-120.76 |
3052 |
~20000 |
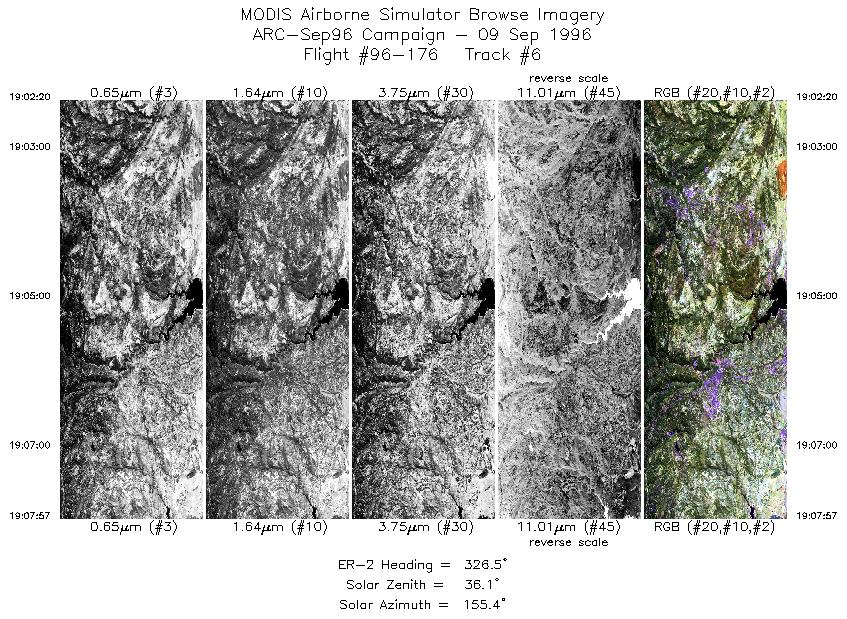
| 6 |
19:02-19:07 |
326 |
38.55-39.08 |
120.78-121.23 |
2099 |
~20000 |
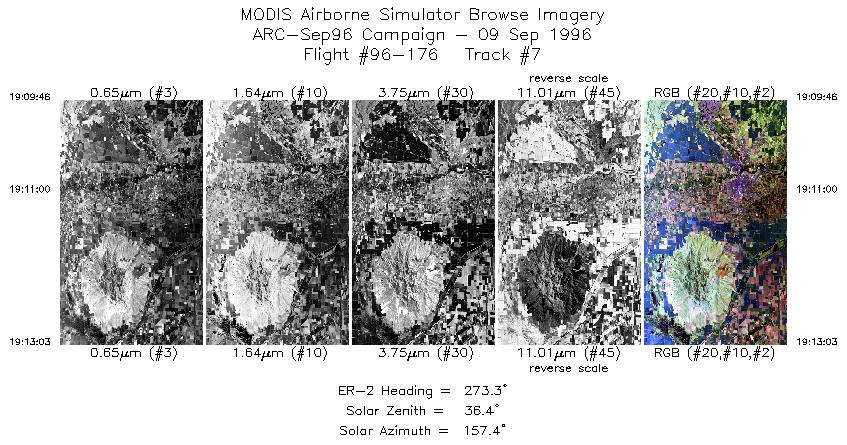
| 7 |
19:09-19:13 |
273 |
39.18-39.19 |
121.46-121.94 |
1228 |
~20000 |
| 8 |
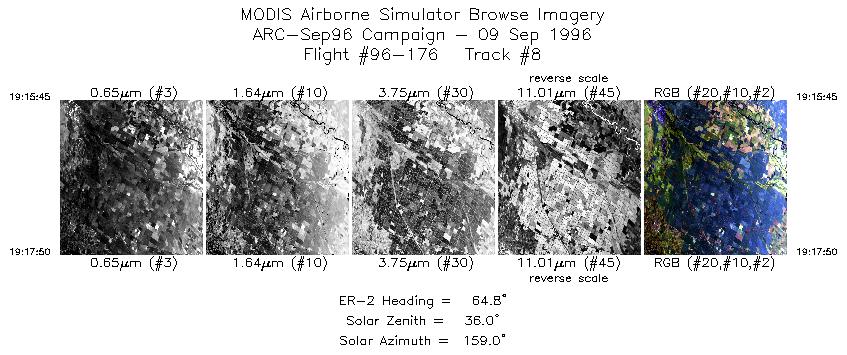
19:15-19:17 |
65 |
39.40-39.51 |
122.00-121.72 |
778 |
~20000 |
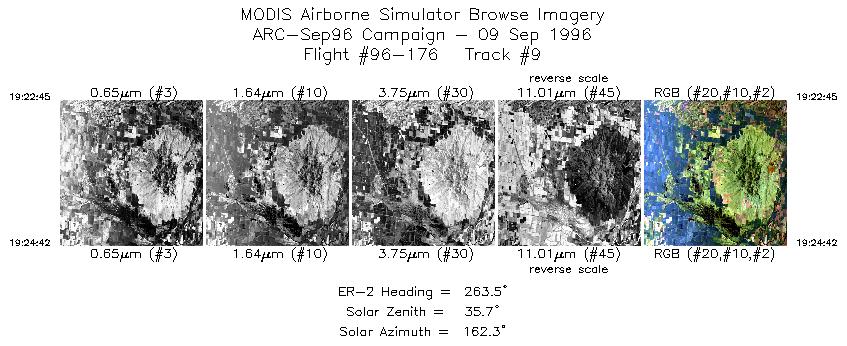
| 9 |
19:22-19:24 |
264 |
39.29-39.28 |
121.68-121.96 |
730 |
~20000 |
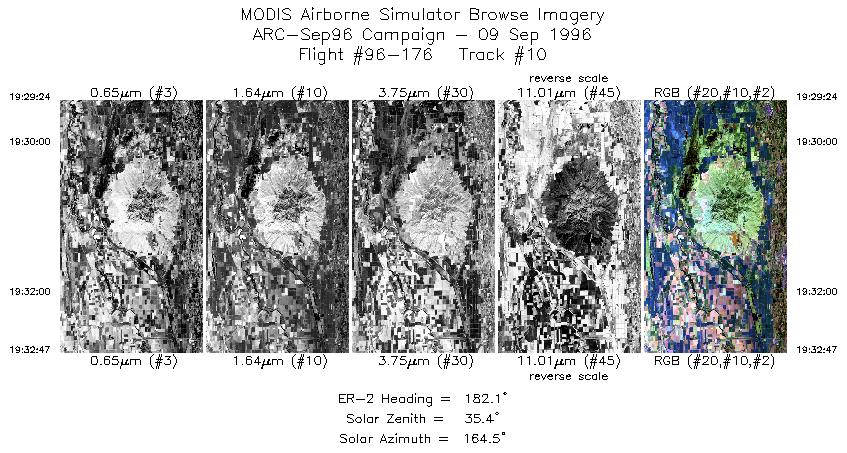
| 10 |
19:29-19:32 |
182 |
39.38-39.01 |
121.83-121.84 |
1265 |
~20000 |
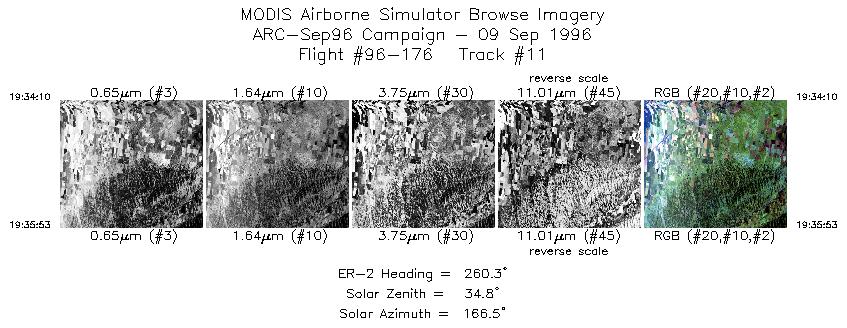
| 11 |
19:34-19:35 |
260 |
38.90-38.88 |
121.96-122.21 |
642 |
~20000 |
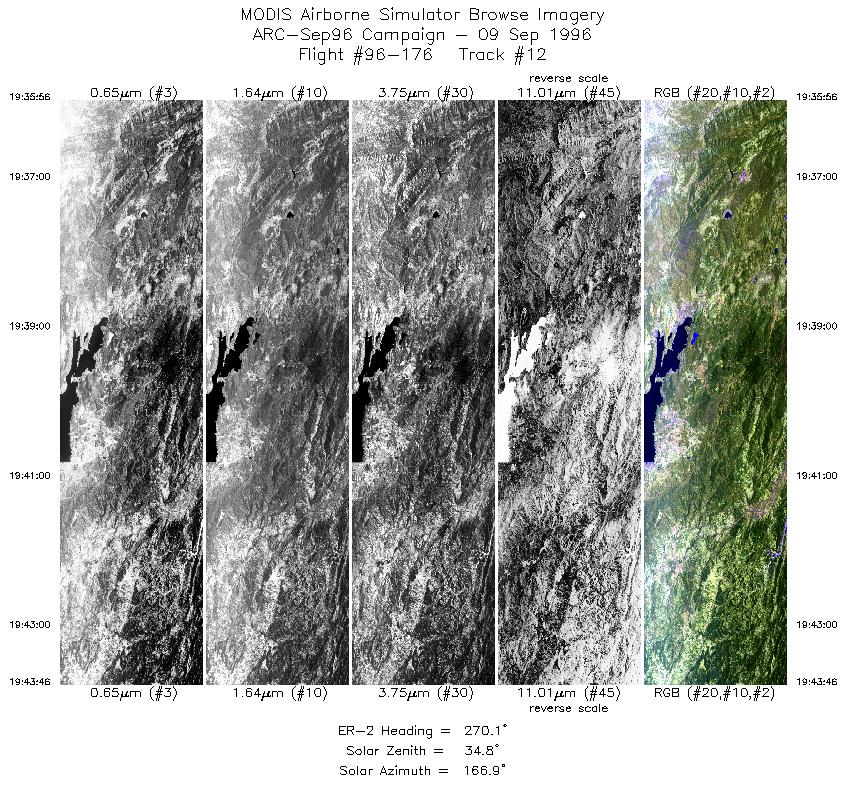
| 12 |
19:35-19:43 |
270 |
38.88-38.88 |
122.21-123.34 |
2926 |
~20000 |
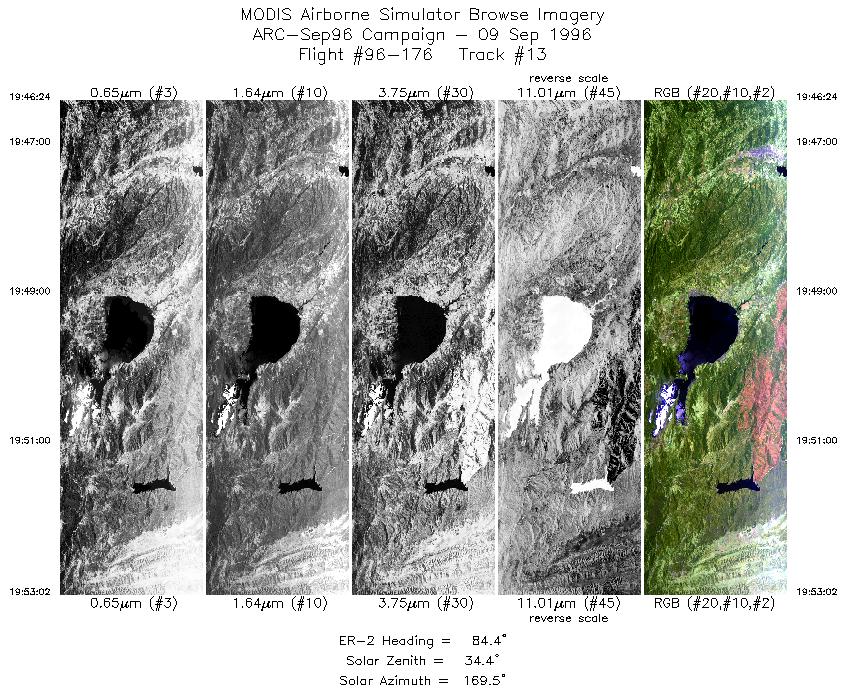
| 13 |
19:46-19:53 |
84 |
39.08-39.09 |
123.30-122.33 |
2478 |
~20000 |
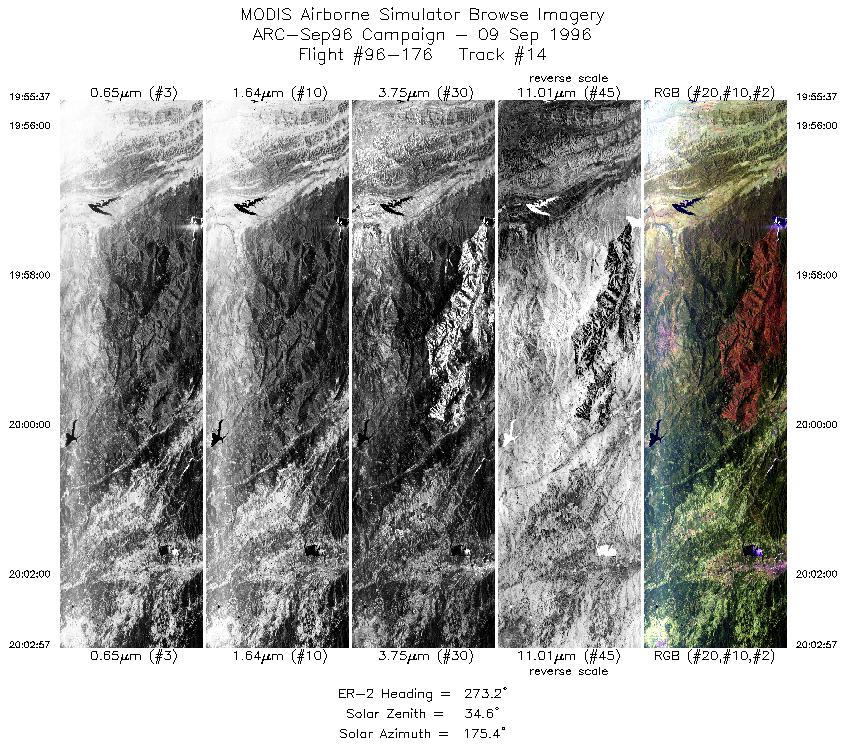
| 14 |
19:55-20:02 |
273 |
39.28-39.29 |
122.30-123.36 |
2740 |
~20000 |
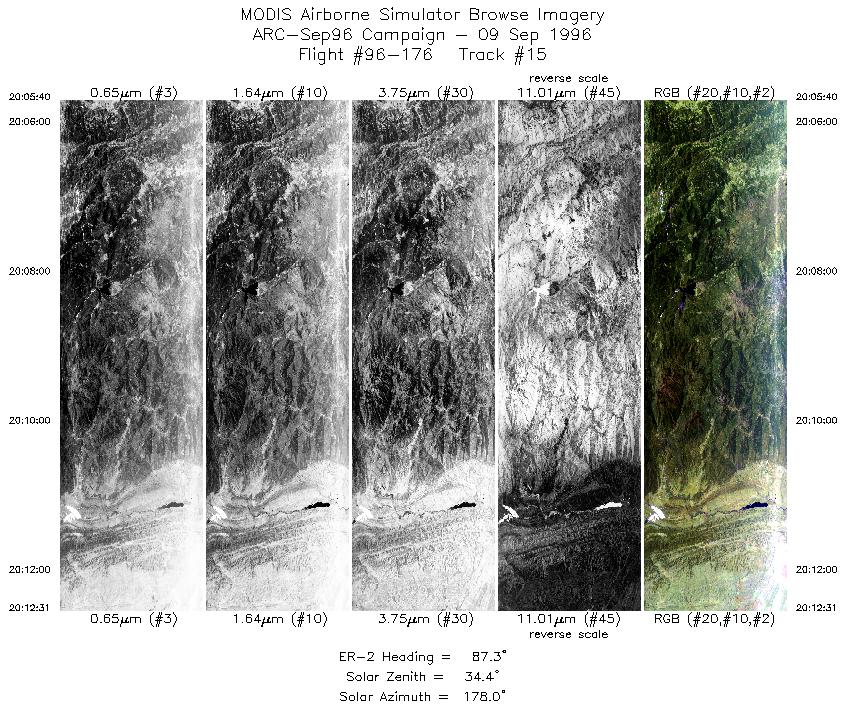
| 15 |
20:05-20:12 |
87 |
39.48-39.49 |
123.33-122.32 |
2559 |
~20000 |
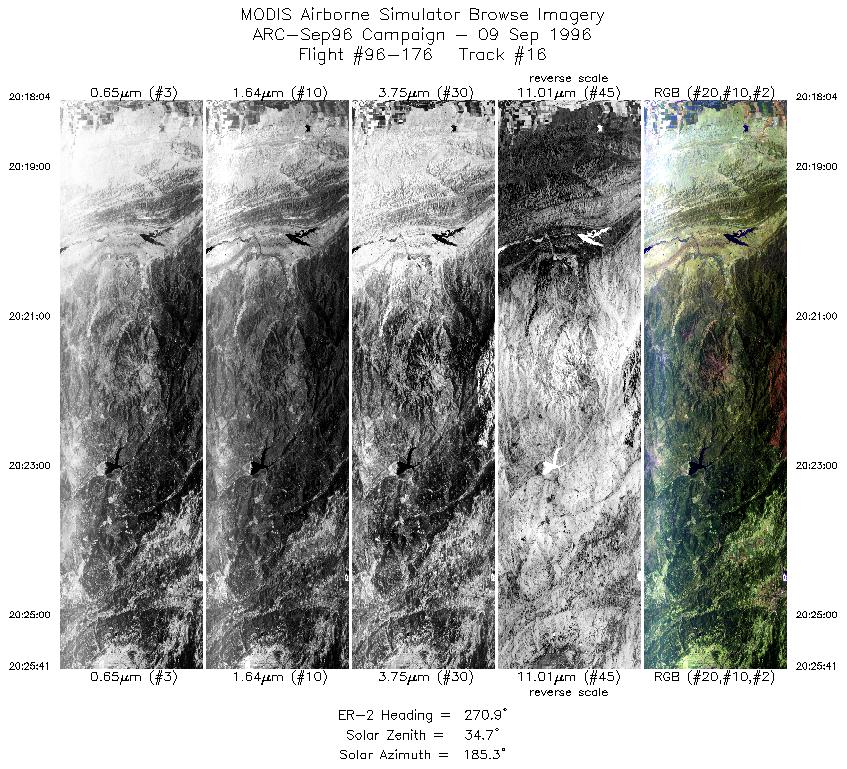
| 16 |
20:18-20:25 |
271 |
39.38-39.38 |
122.24-123.35 |
2846 |
~20000 |
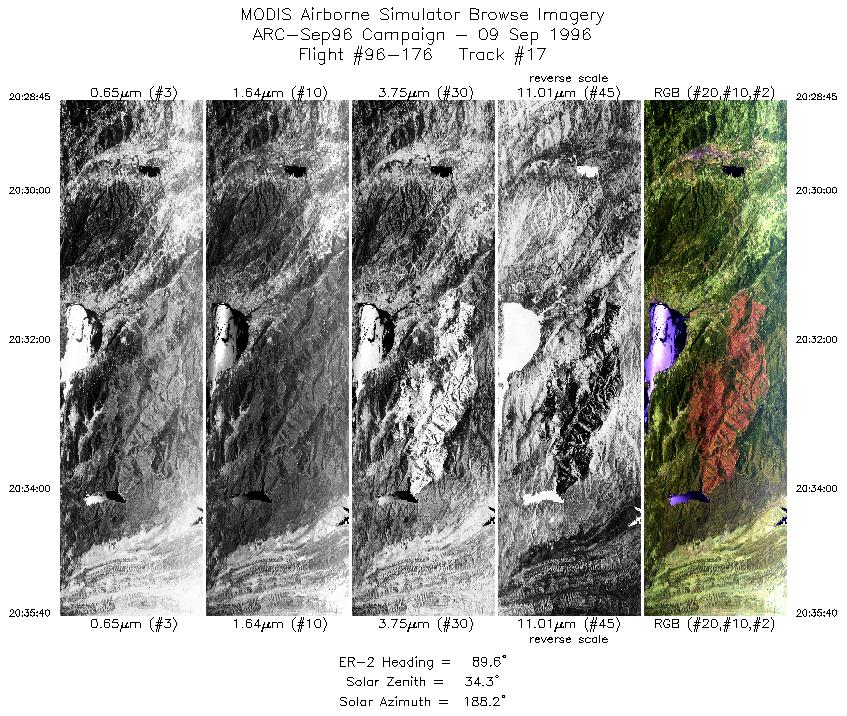
| 17 |
20:28-20:35 |
90 |
39.18-39.18 |
123.31-122.31 |
2584 |
~20000 |
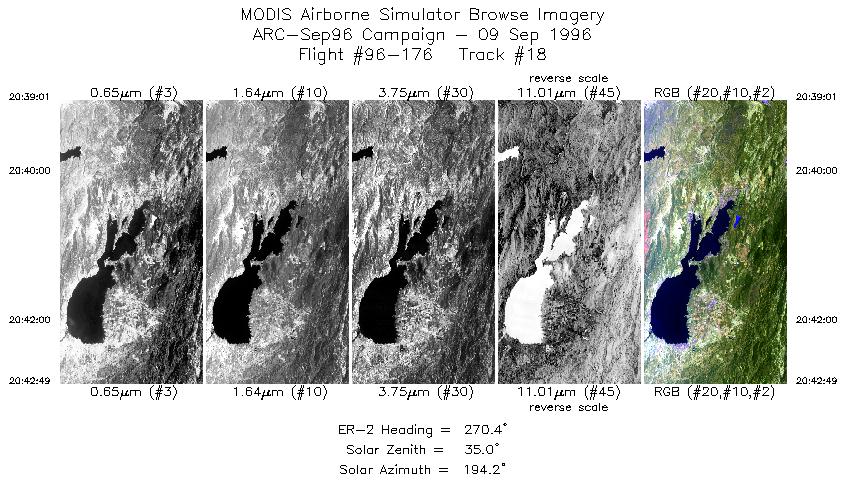
| 18 |
20:39-20:42 |
270 |
38.97-38.97 |
122.44-122.99 |
1420 |
~20000 |
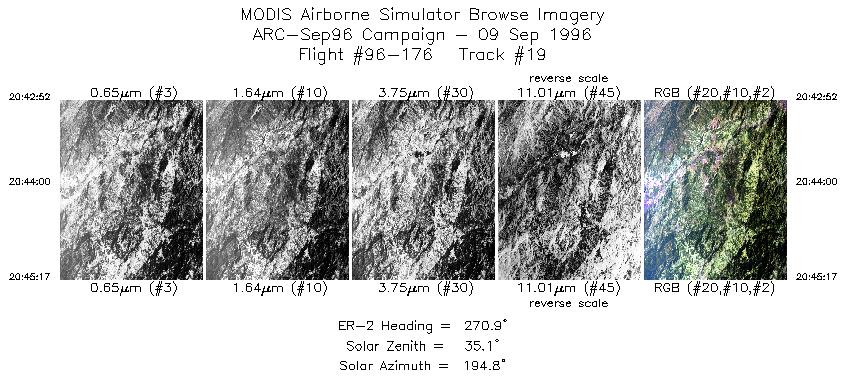
| 19 |
20:42-20:45 |
271 |
38.97-38.97 |
123.00-123.36 |
904 |
~20000 |
| 20 |
20:48-21:03 |
142 |
38.72-37.26 |
123.43-122.12 |
5932 |
~20000 |
|
Images 01 through 20 in sequence |
Data Evalutation
Data quality appears excellent.
Spectral Summary
Spectral Band Configuration
Spectral Response Files
Level-1B Data Distribution
NASA Goddard Space Flight Center DAAC
Related Web Sites
JPL AVIRIS Web Page
Airborne Sensors Facility Page
NASA ER-2 Aircraft Program
|
|