
|
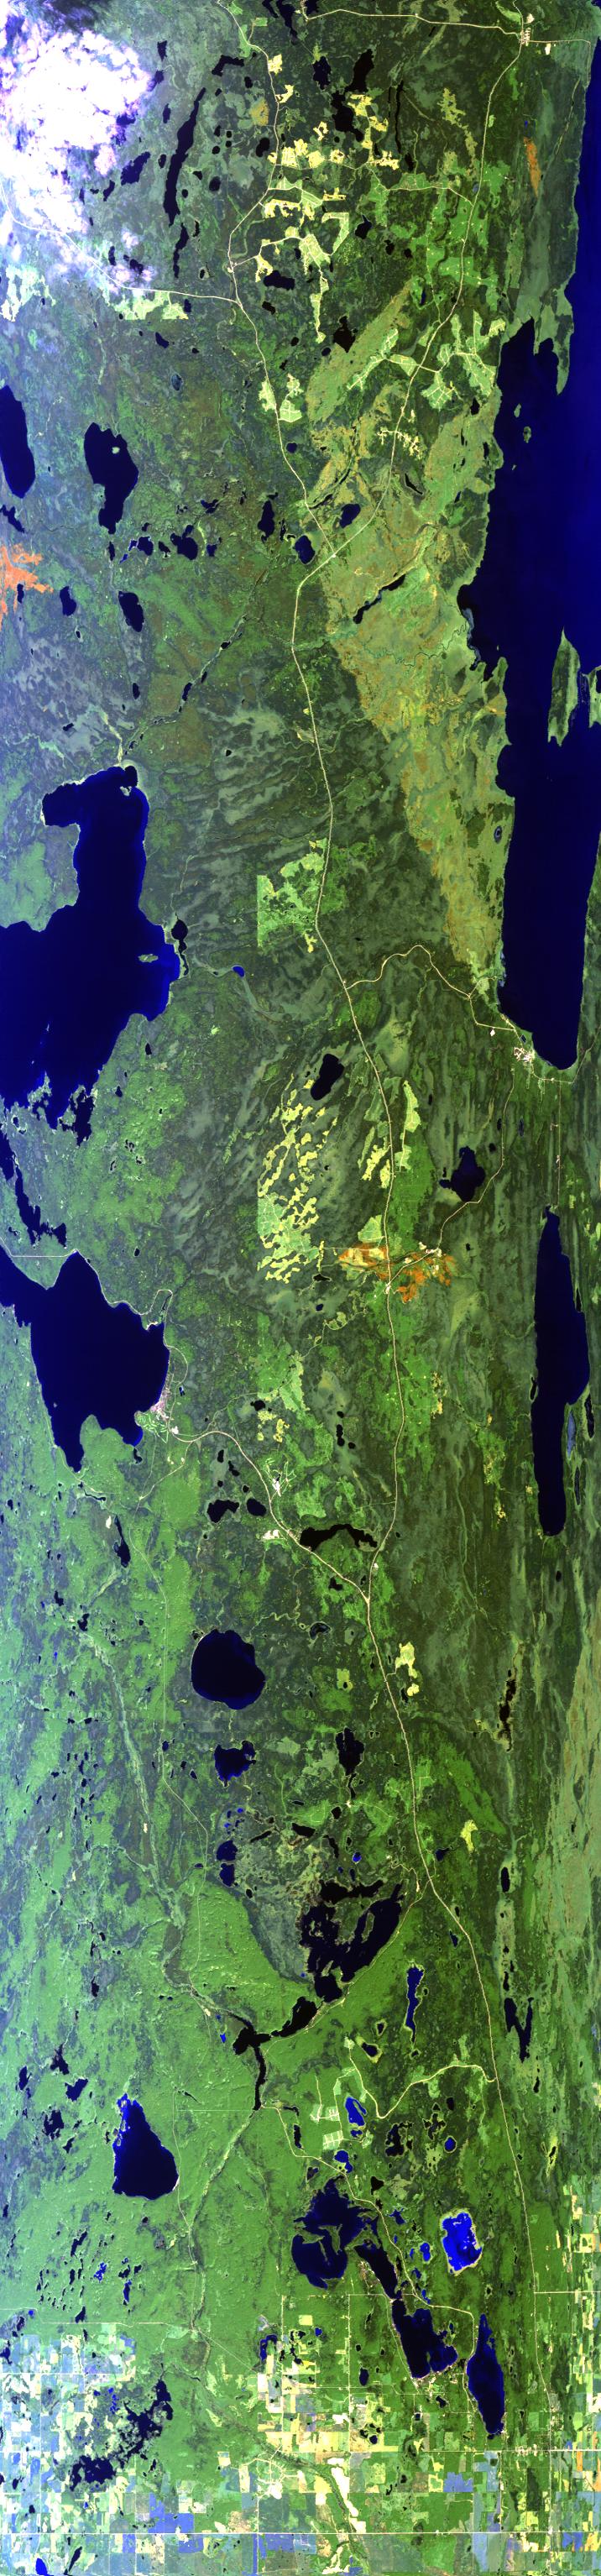
Sample Image

14 August 1996
Track #01
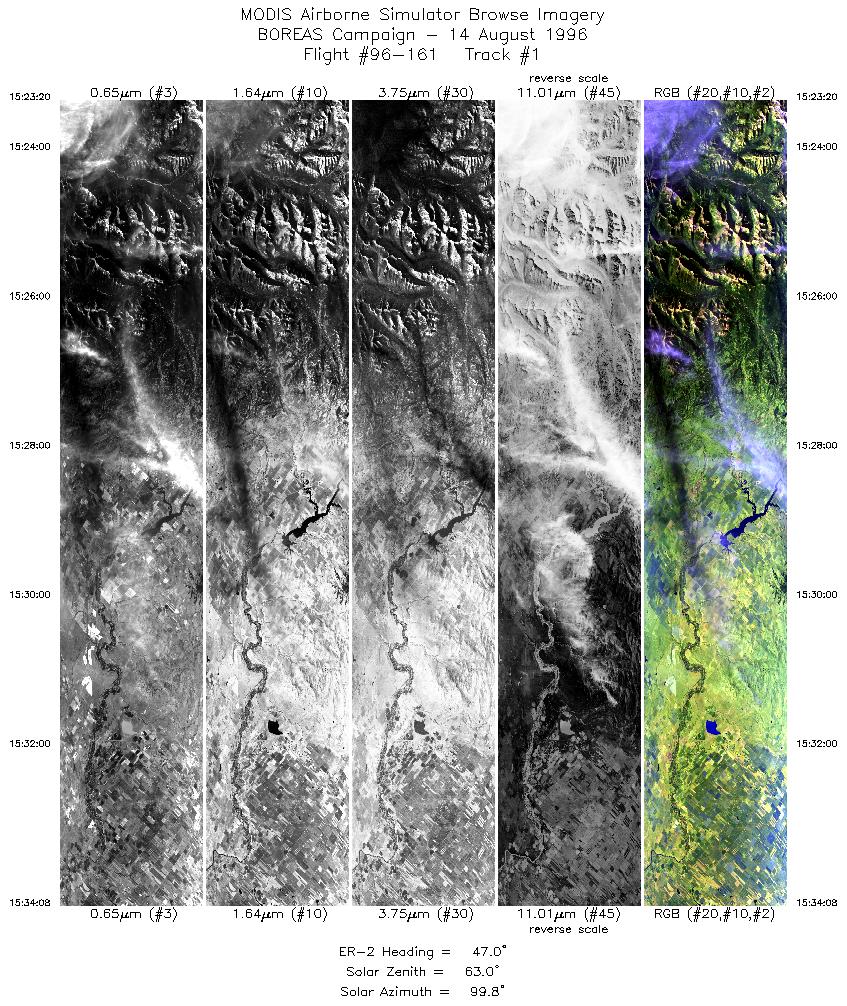
Flightline following the Canam Highway south through Saskatchewan, Canada. Image begins over the Thunder Hills, with Montreal Lake visible in the east (left) side of the image. Directly south of Montreal Lake is Bittern Lake; to the the southwest is Waskesiu Lake. Flightline ends north of the town of Prince Albert.
R: 2.15 microns
G: 1.65 microns
B: 0.55 microns
|
|
Mission Summary
Date: Aug 14, 1996
ER-2 Flight Number: 96-161
Deployment: BOREAS
Flight Location: Prince Albert, Canada
Principal Investigator: Dr. Piers Sellers (GSFC)
Additional Sensors: Dual 12" RC-10 (CIR), AVIRIS
Objective:
Level-1B Processing Information
Level-1B Data processed by: Ames Research Center
Level-1B Data Version: #09
Level-1B Configuration: (sample file)
Calibration Type: Final
Calibration Version: 1.0
Temperature Adjustment: No
Status: Completed with final calibration
|
|
Flight Track Map

|
Level-1B Browse Imagery
Straight Line Flight Tracks: 27
Scanlines Processed: 87746
Solar Azimuth and Zenith Angles
|
Browse Images
|
Click on the Flight Track number to load images.
Lat/Lon ranges are for the BEG-END scanline nadir pixels.
|
Flight
Track |
Time_Span
(GMT) |
Heading
(Deg) |
Lat_Range
(Deg_N) |
Lon_Range
(Deg_W) |
Length
(Scanlines) |
Altitude
(Meters) |
| 1 |
15:23-15:34 |
47 |
49.12-49.95 |
114.66-113.23 |
4033 |
~20000 |
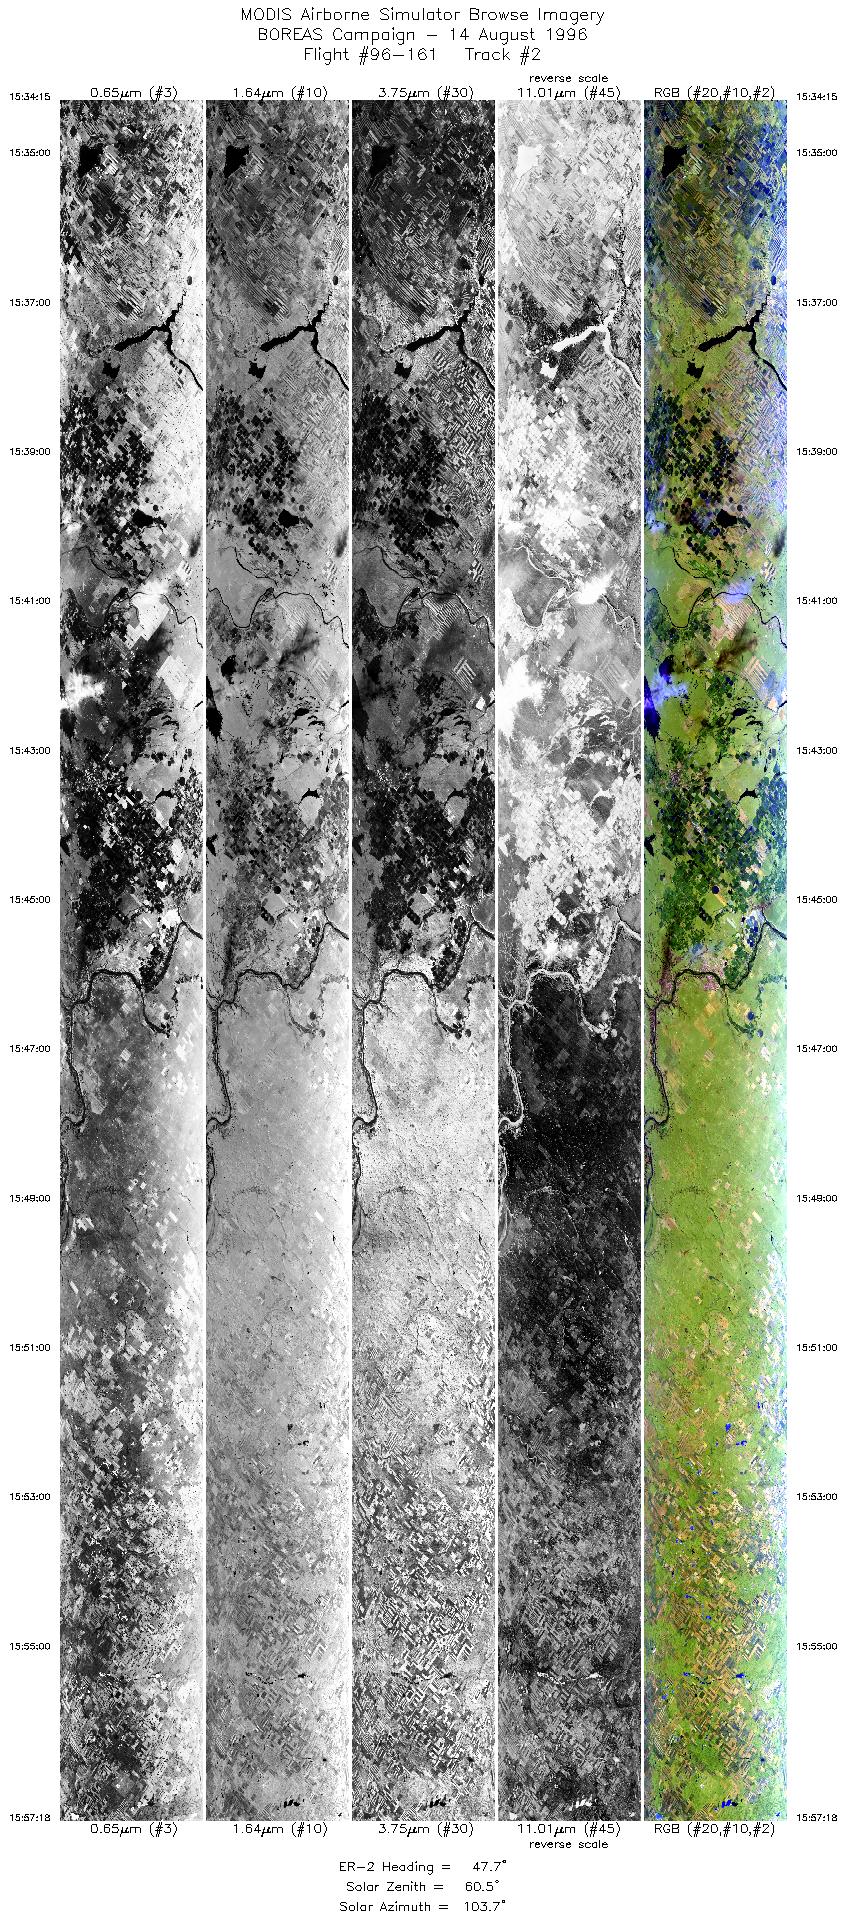
| 2 |
15:34-15:57 |
48 |
49.97-51.63 |
113.22-110.07 |
8609 |
~20000 |
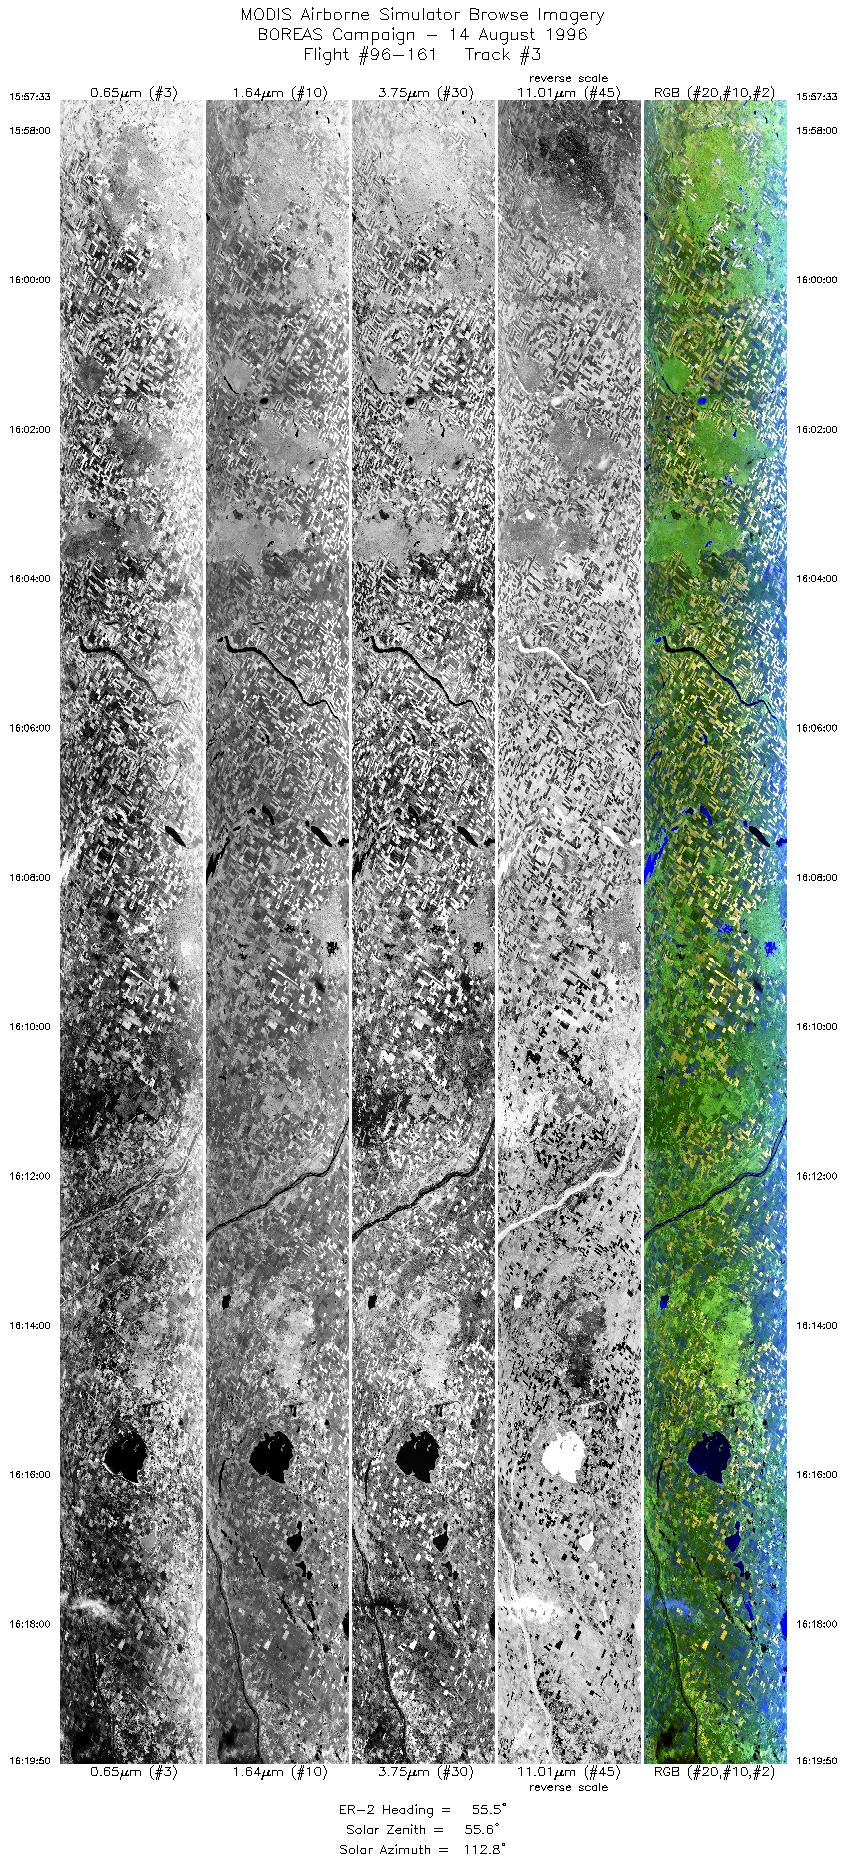
| 3 |
15:57-16:19 |
55 |
51.66-52.94 |
110.03-106.53 |
8320 |
~20000 |
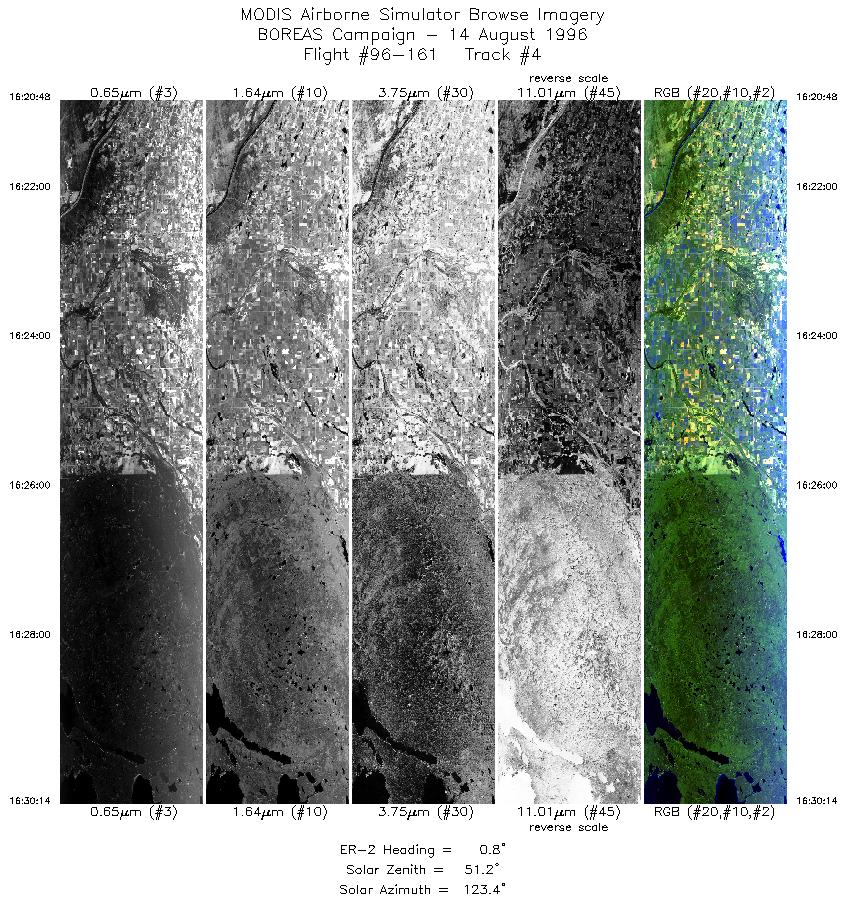
| 4 |
16:20-16:30 |
1 |
53.02-54.08 |
106.41-106.41 |
3521 |
~20000 |
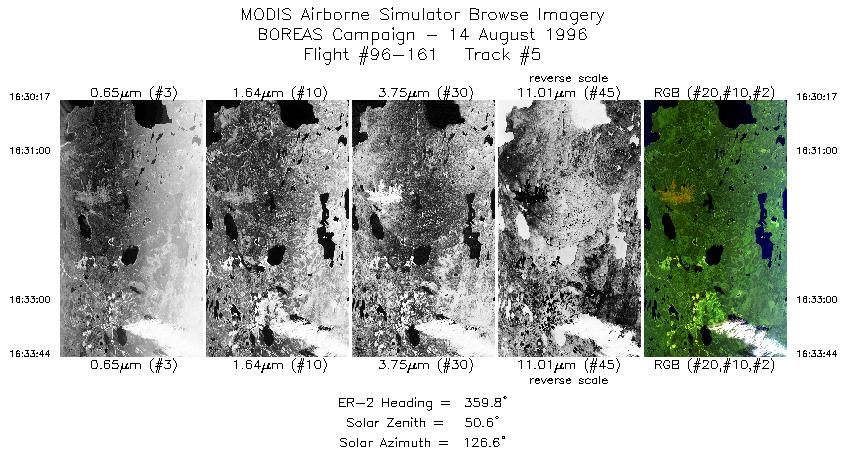
| 5 |
16:30-16:33 |
360 |
54.09-54.48 |
106.41-106.41 |
1288 |
~20000 |
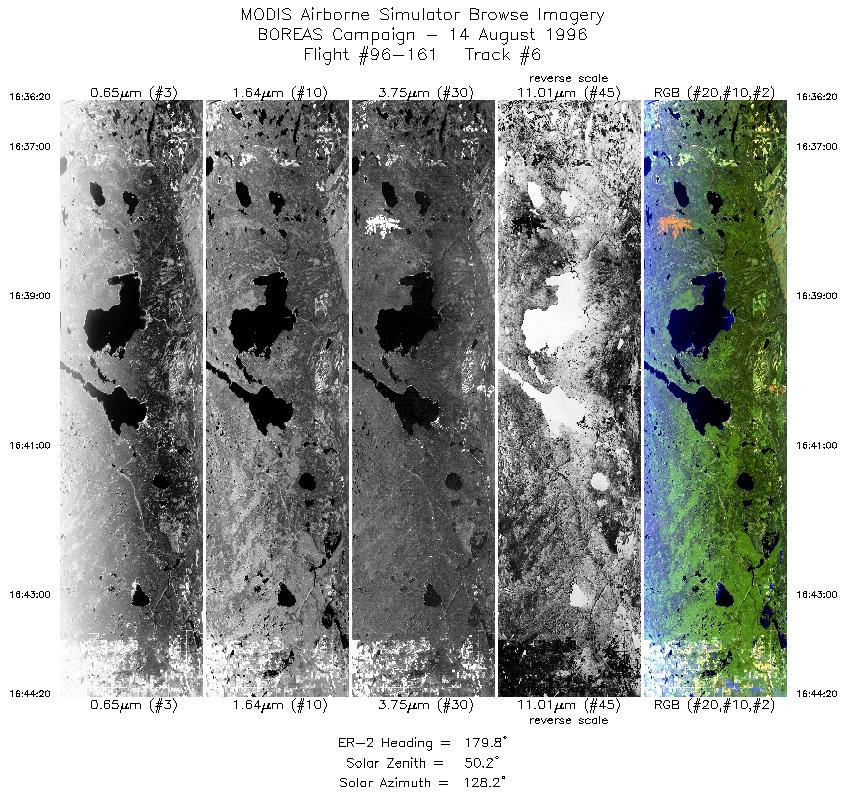
| 6 |
16:36-16:44 |
180 |
54.43-53.49 |
106.11-106.11 |
2987 |
~20000 |
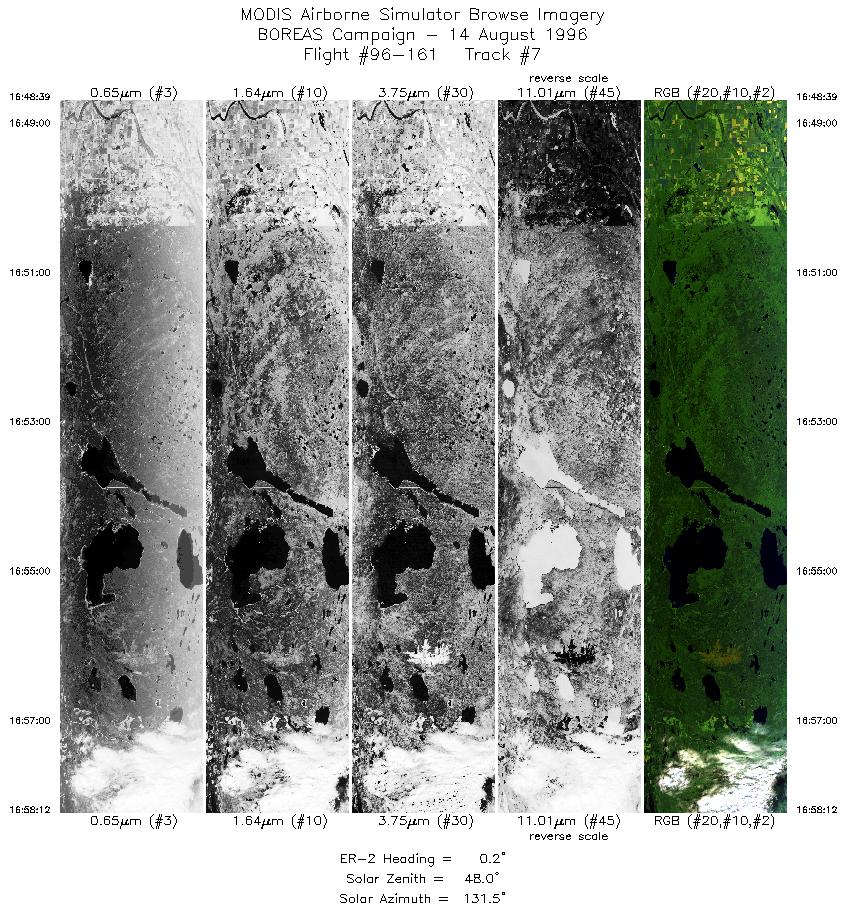
| 7 |
16:48-16:58 |
0 |
53.39-54.47 |
106.26-106.26 |
3565 |
~20000 |
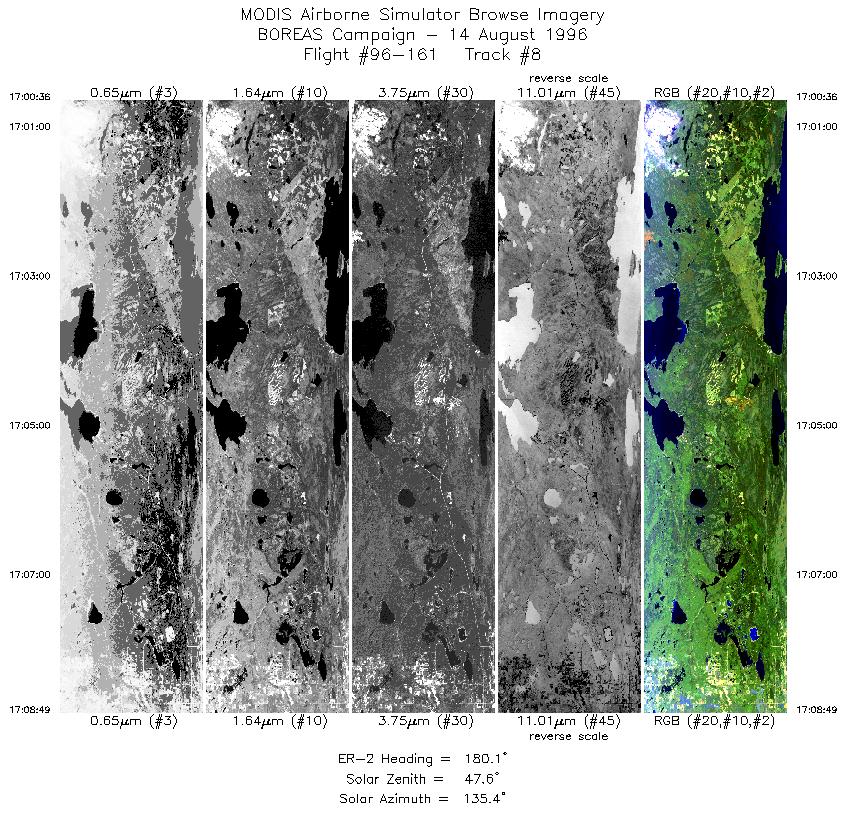
| 8 |
17:00-17:08 |
180 |
54.44-53.49 |
105.96-105.96 |
3068 |
~20000 |
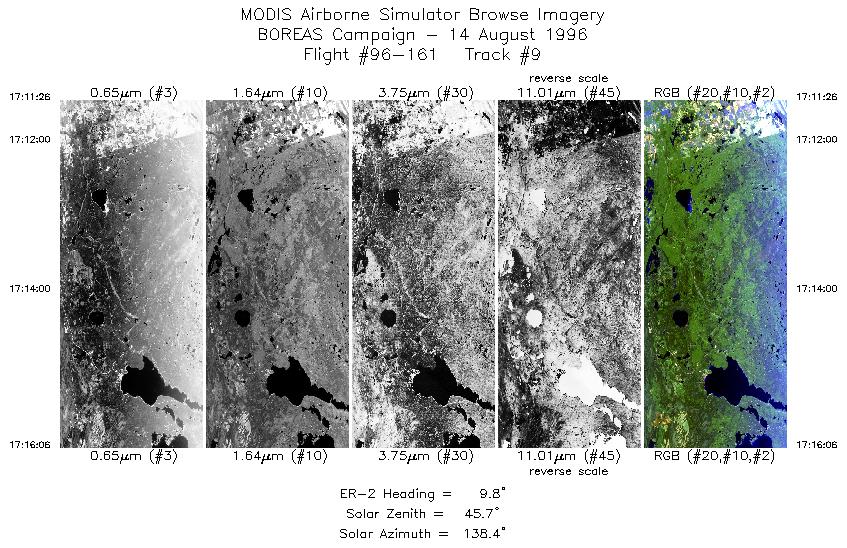
| 9 |
17:11-17:16 |
10 |
53.51-54.04 |
106.25-106.09 |
1742 |
~20000 |
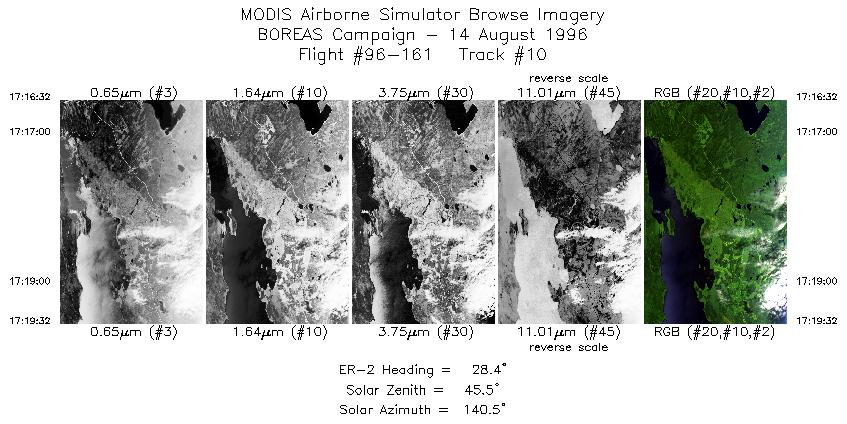
| 10 |
17:16-17:19 |
28 |
54.09-54.38 |
106.07-105.75 |
1121 |
~20000 |
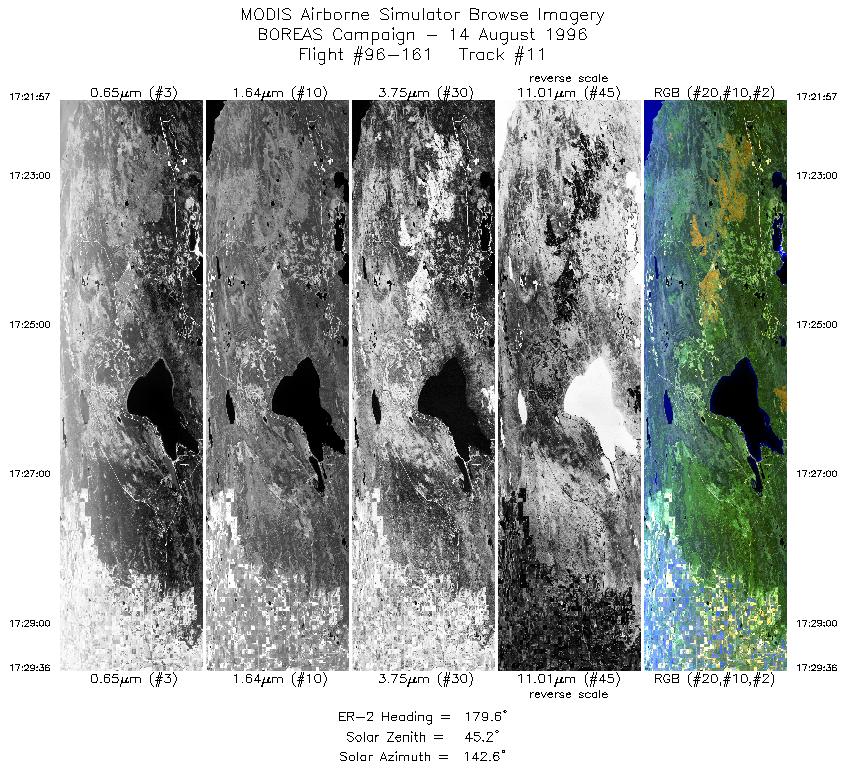
| 11 |
17:21-17:29 |
180 |
54.31-53.43 |
105.40-105.40 |
2856 |
~20000 |
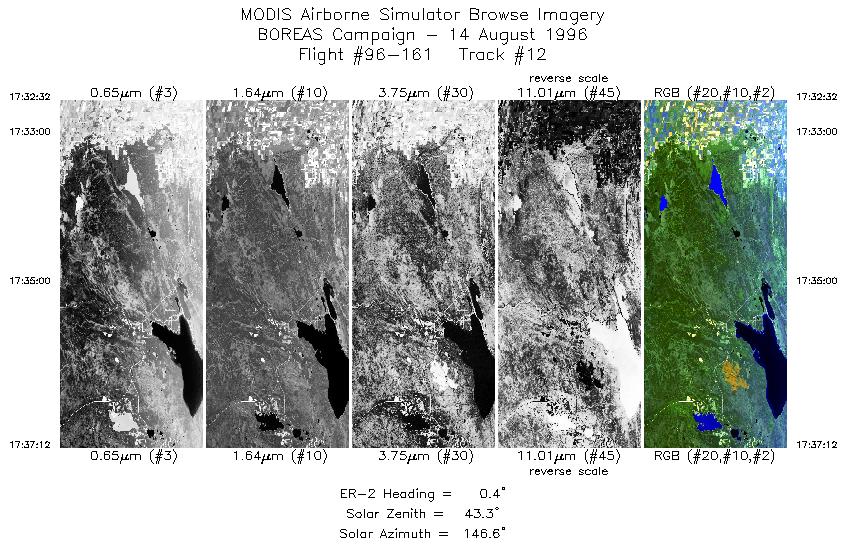
| 12 |
17:32-17:37 |
0 |
53.42-53.96 |
105.11-105.11 |
1743 |
~20000 |
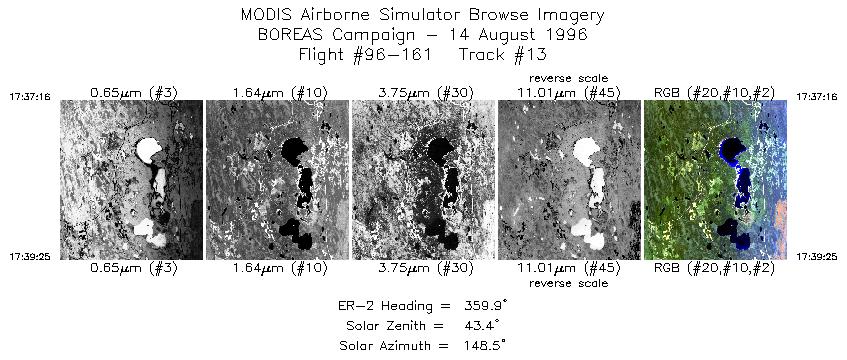
| 13 |
17:37-17:39 |
360 |
53.96-54.21 |
105.11-105.11 |
803 |
~20000 |
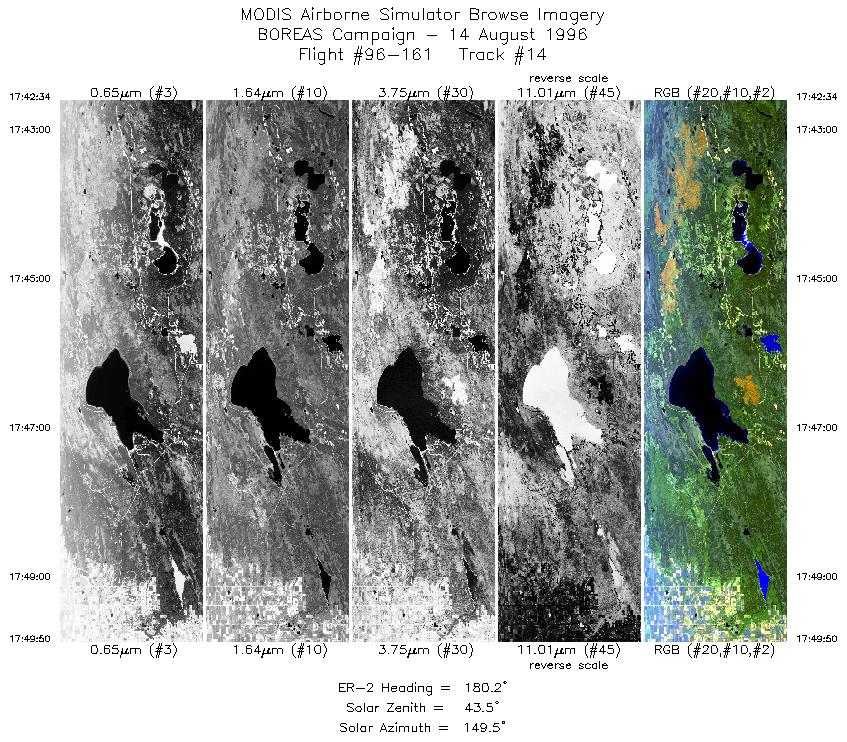
| 14 |
17:42-17:49 |
180 |
54.29-53.46 |
105.25-105.26 |
2713 |
~20000 |
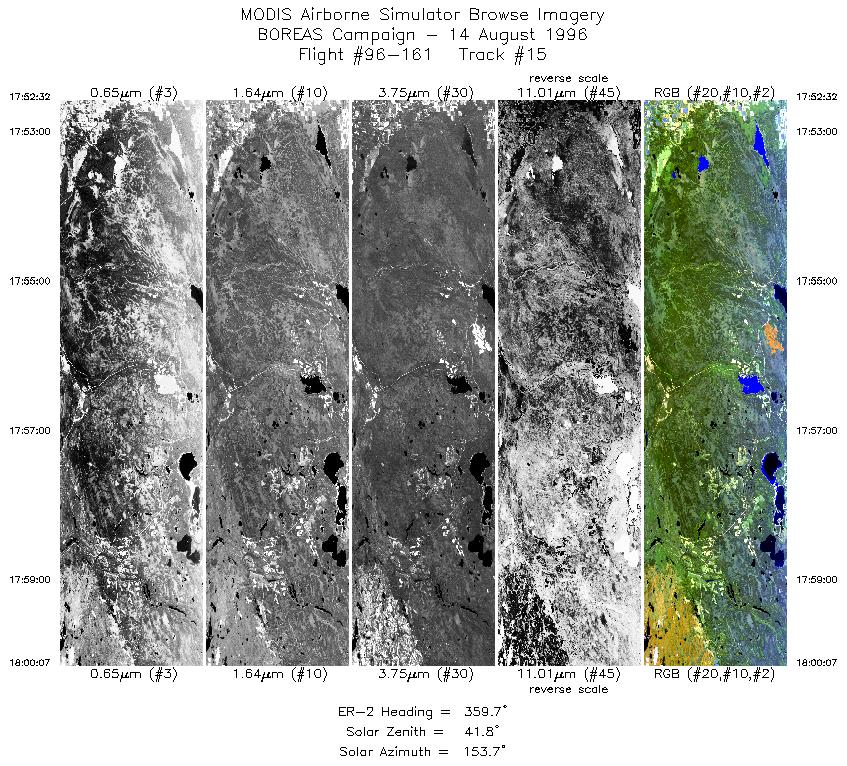
| 15 |
17:52-18:00 |
360 |
53.48-54.35 |
104.97-104.96 |
2831 |
~20000 |
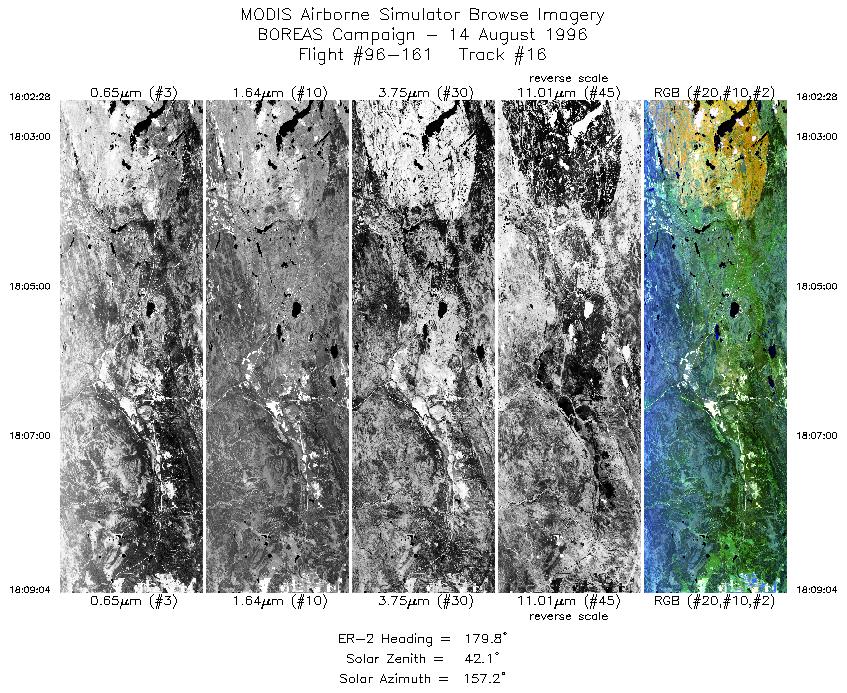
| 16 |
18:02-18:09 |
180 |
54.36-53.60 |
104.68-104.68 |
2465 |
~20000 |
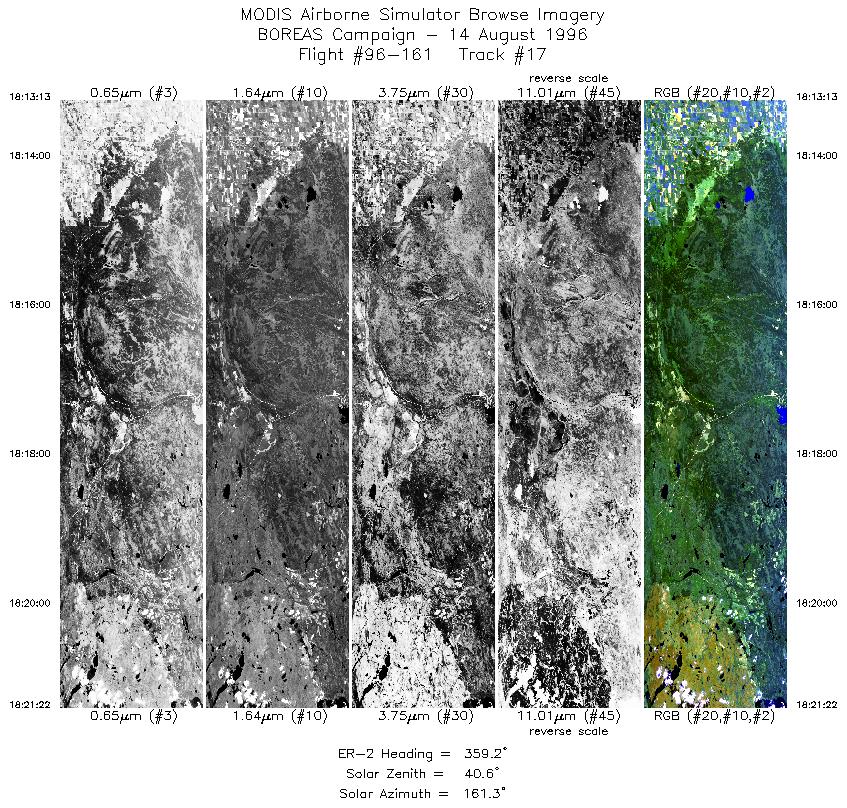
| 17 |
18:13-18:21 |
359 |
53.43-54.37 |
104.82-104.82 |
3043 |
~20000 |
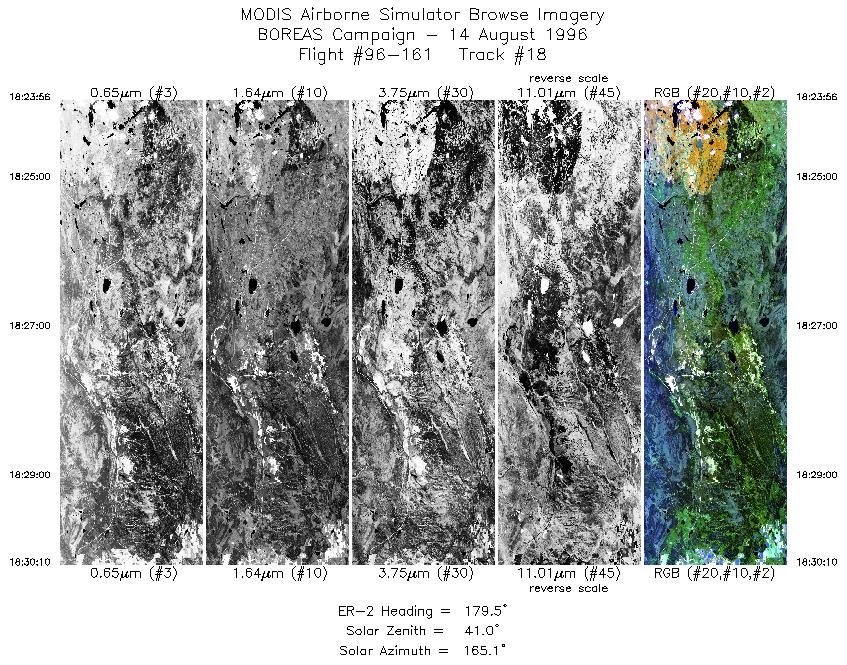
| 18 |
18:23-18:30 |
180 |
54.32-53.60 |
104.54-104.54 |
2326 |
~20000 |
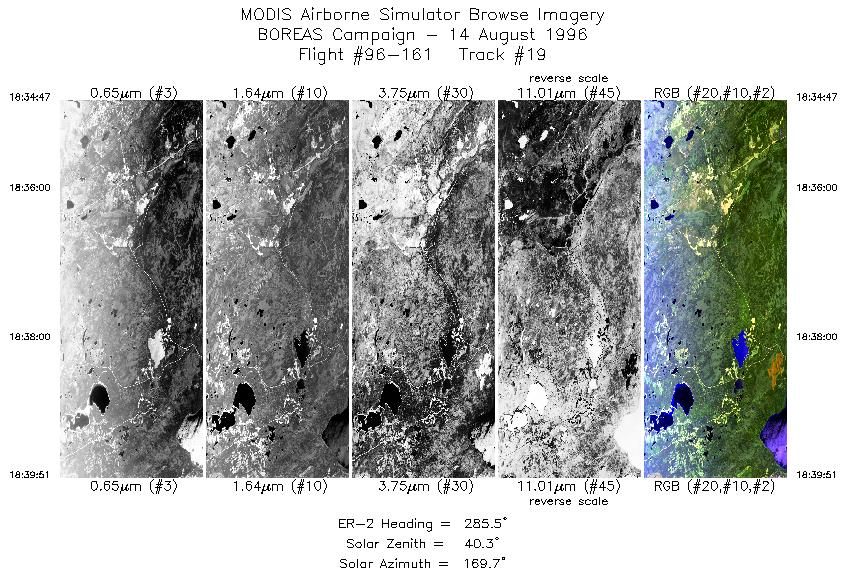
| 19 |
18:34-18:39 |
286 |
53.86-54.01 |
104.43-105.38 |
1892 |
~20000 |
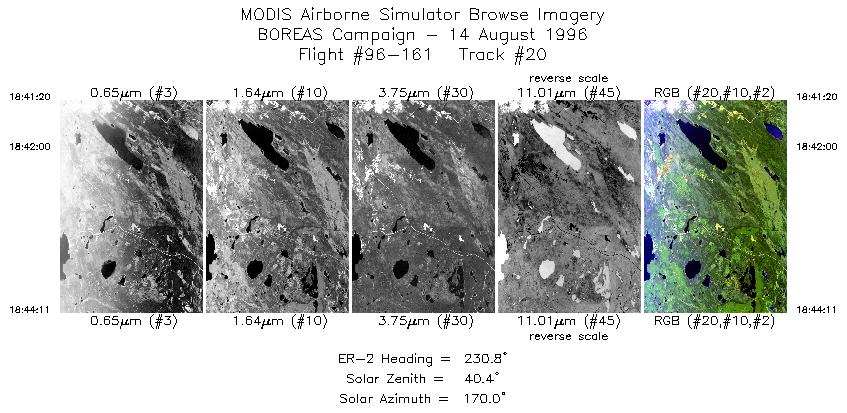
| 20 |
18:41-18:44 |
231 |
53.95-53.75 |
105.64-106.06 |
1065 |
~20000 |
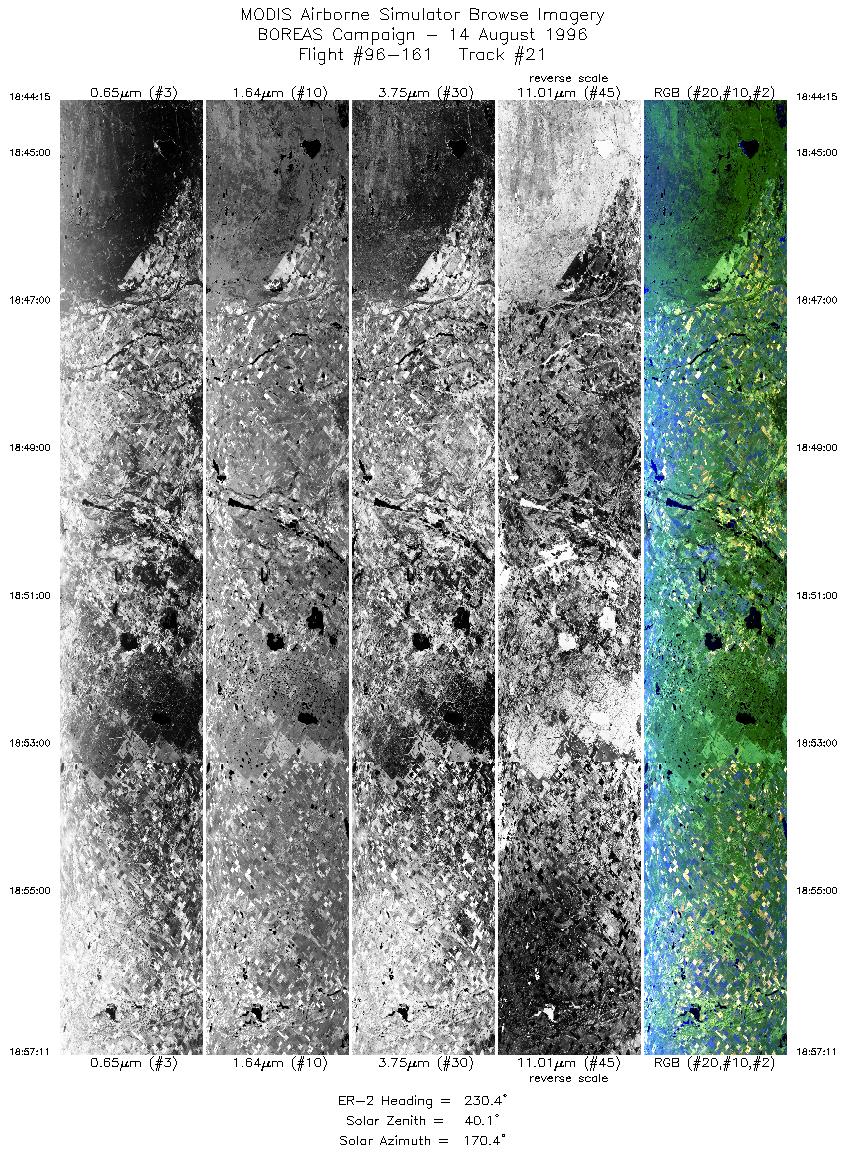
| 21 |
18:44-18:57 |
230 |
53.74-52.78 |
106.08-107.97 |
4779 |
~20000 |
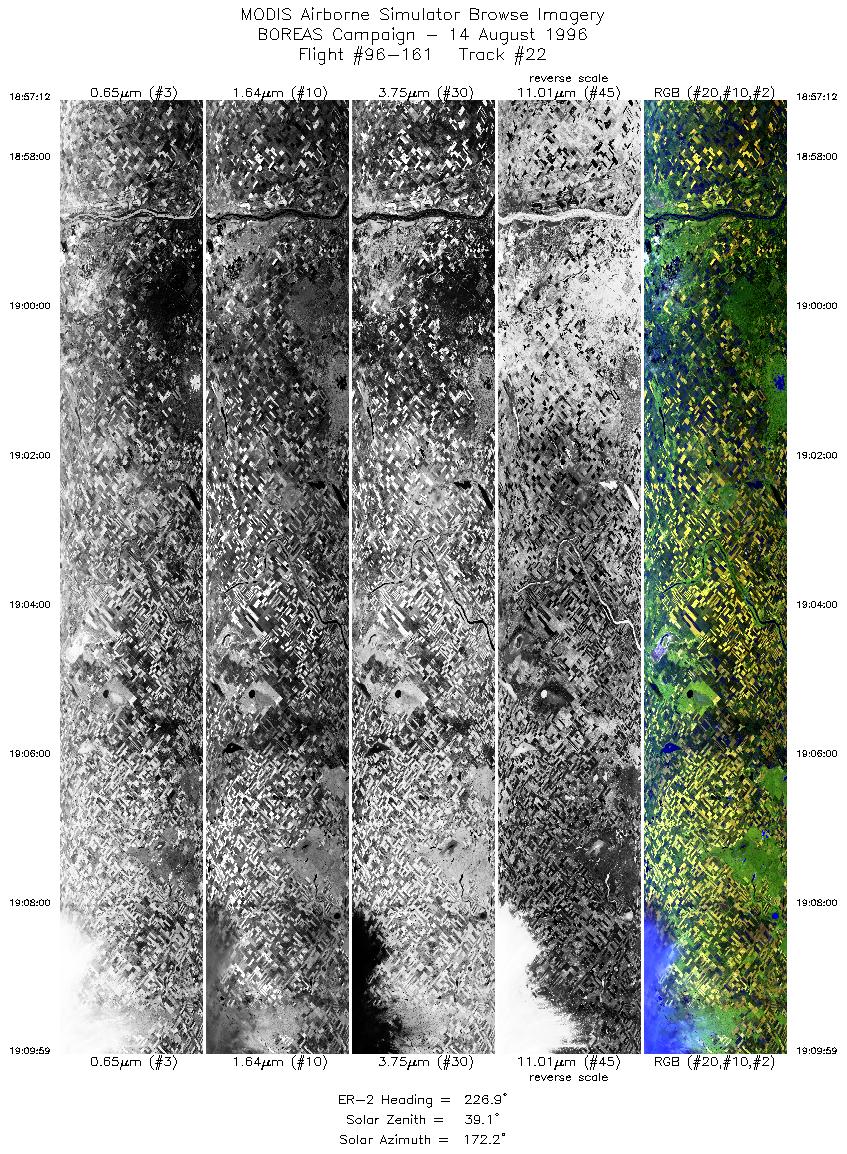
| 22 |
18:57-19:09 |
227 |
52.79-51.81 |
107.96-109.75 |
4771 |
~20000 |
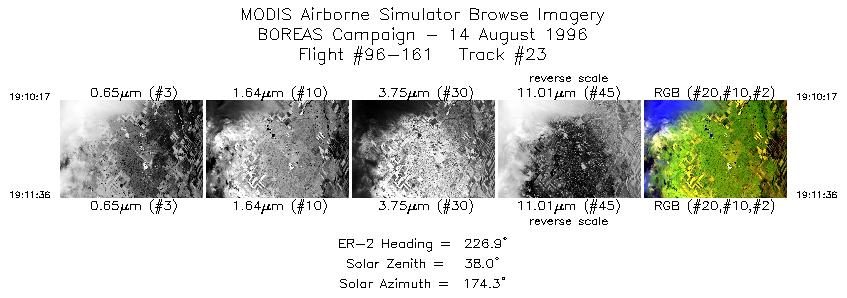
| 23 |
19:10-19:11 |
227 |
51.78-51.67 |
109.79-109.97 |
492 |
~20000 |
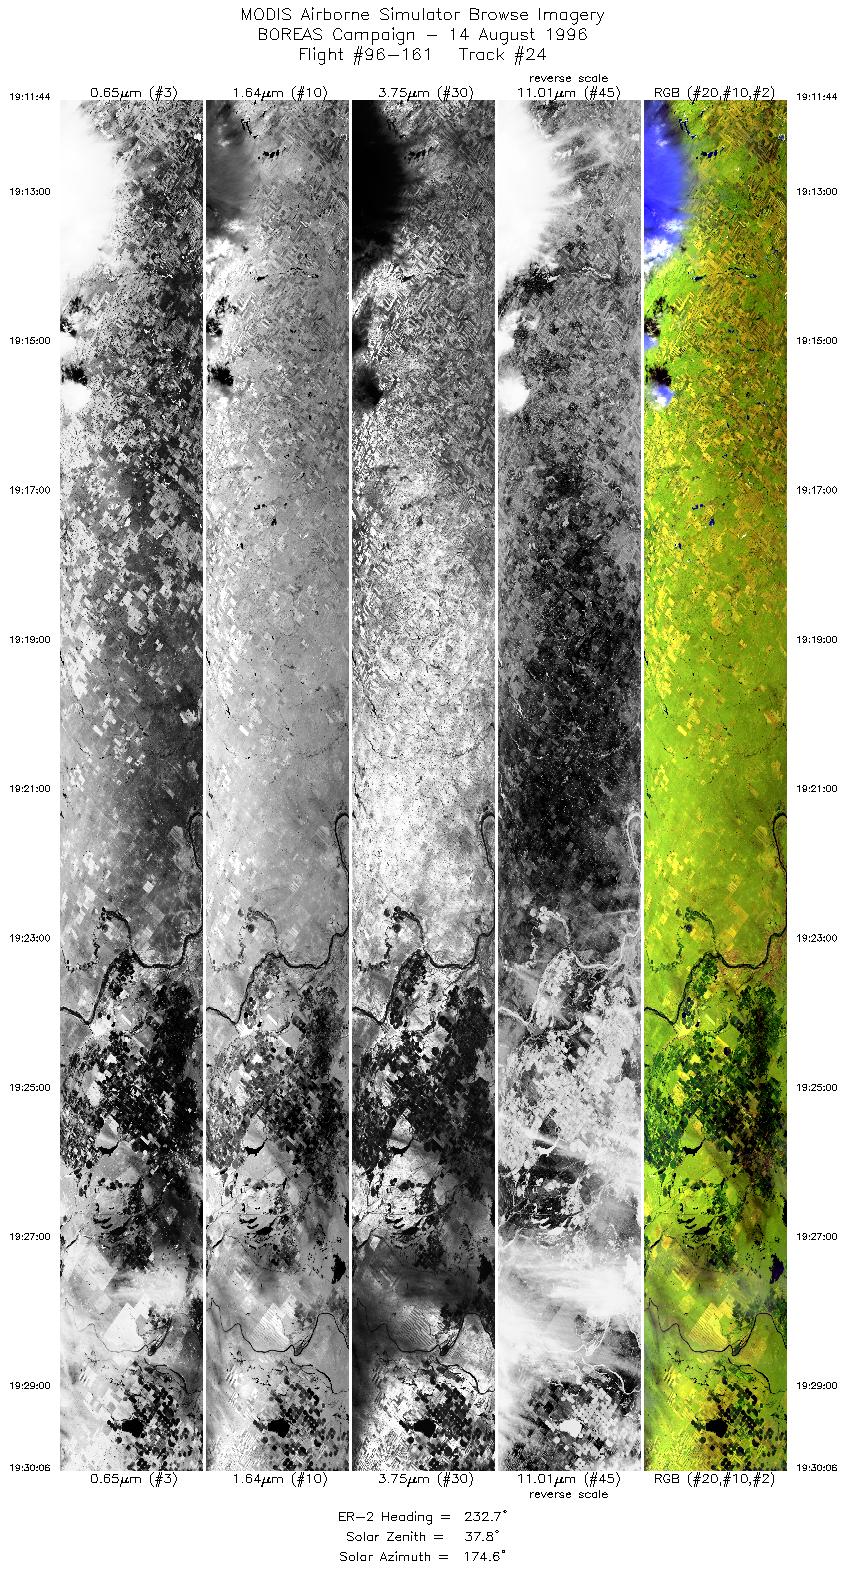
| 24 |
19:11-19:30 |
233 |
51.66-50.34 |
110.01-112.57 |
6856 |
~20000 |
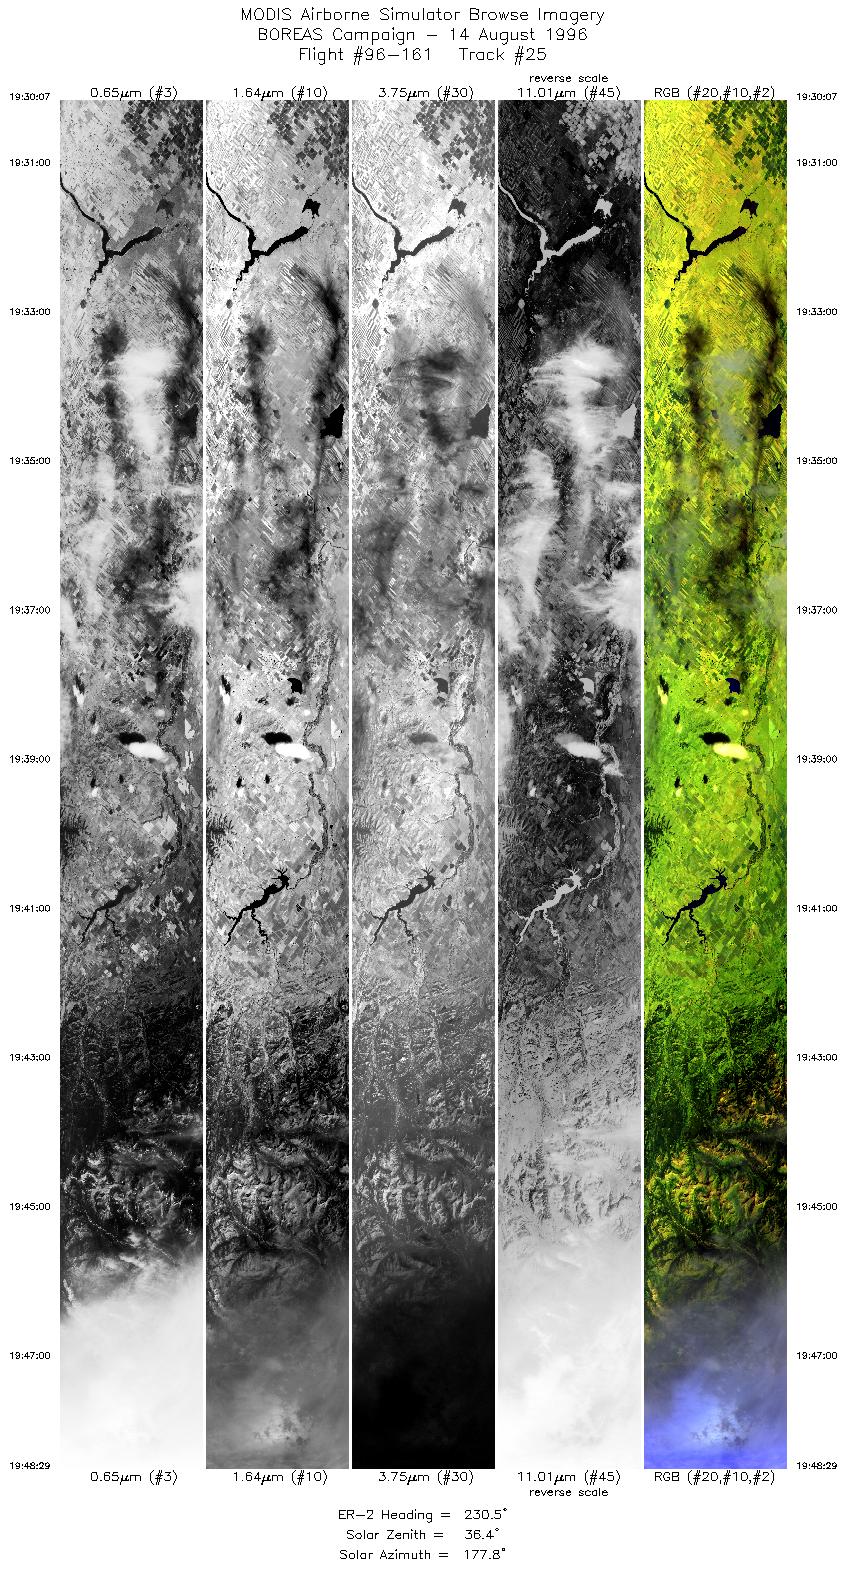
| 25 |
19:30-19:48 |
231 |
50.34-49.00 |
112.55-114.92 |
6847 |
~20000 |
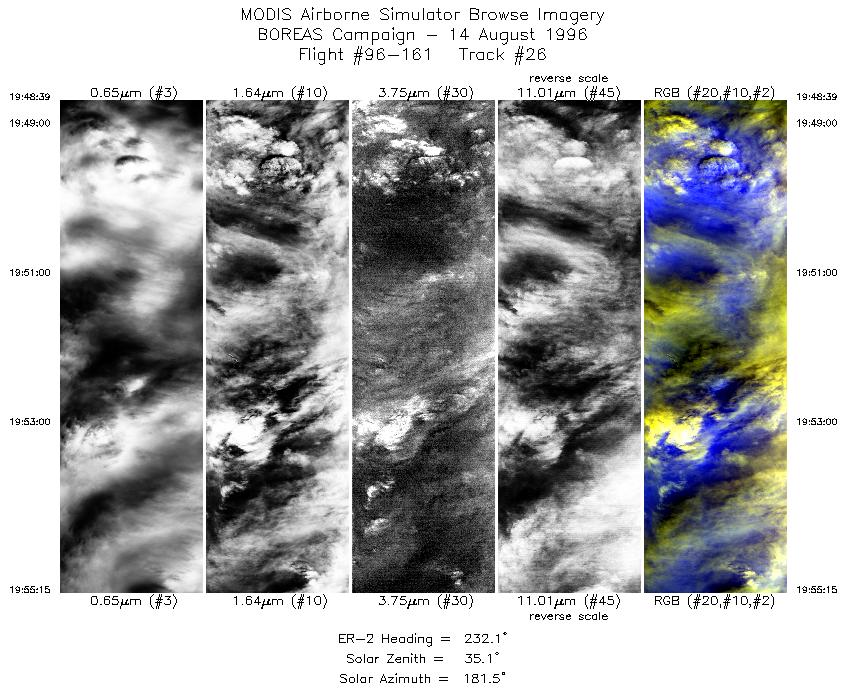
| 26 |
19:48-19:55 |
232 |
48.98-48.53 |
114.94-115.81 |
2465 |
~20000 |
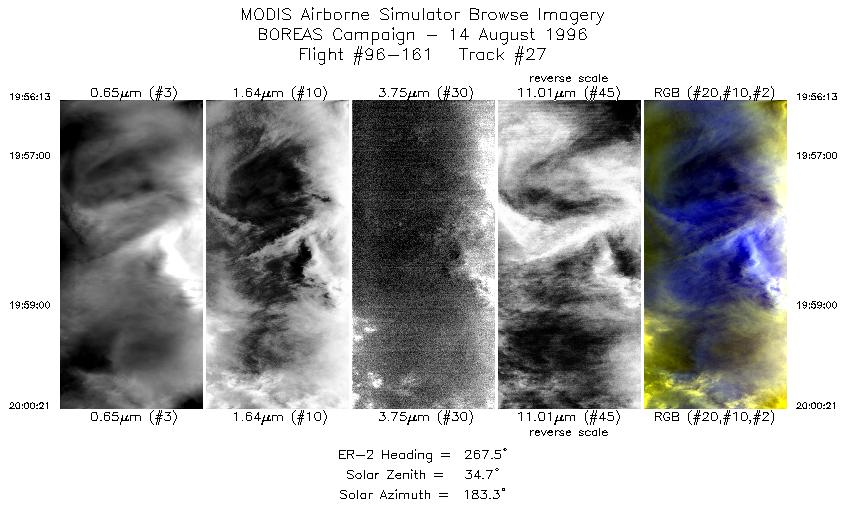
| 27 |
19:56-20:00 |
267 |
48.50-48.49 |
115.96-116.67 |
1545 |
~20000 |
|
Images 01 through 27 in sequence |
Data Evalutation
Track 1, channel 48, shows intermittent black bands across flightline. Some
noise in ports 3 and 4 during the later half of the flight. Additionaly,
onboard heaters failed during the flight, calibration is therefore suspect.
Spectral Summary
Spectral Band Configuration
Spectral Response Files
Level-1B Data Distribution
NASA Goddard Space Flight Center DAAC
Related Web Sites
Boreal Ecosystem-Atmosphere Study (BOREAS)
JPL AVIRIS Web Page
Airborne Sensors Facility Page
NASA ER-2 Aircraft Program
|
|